This version of the OpenSearch documentation is no longer maintained. For the latest version, see the current documentation. For information about OpenSearch version maintenance, see Release Schedule and Maintenance Policy.
Adding multiple data sources
The multiple data sources feature is an experimental feature released in OpenSearch 2.4. It can’t be used in a production environment. For updates on the feature’s progress or to leave feedback on improving the feature, see the OpenSearch Forum discussion.
You can add multiple data sources to a single dashboard. OpenSearch Dashboards allows you to dynamically manage data sources, create index patterns based on those data sources, and execute queries against a specific data source and then combine visualizations in one dashboard.
In this tutorial we provide the steps for enabling the data_source setting in Dashboards; adding credentials, data source connections, and index patterns; and combining visualizations in a single dashboard.
Try it: Exploring the multiple data sources feature in your local environment
This tutorial uses a preconfigured data source and index pattern, and you aren’t required to configure settings. However, you’ll need to enable the data_source setting in the configuration file before before getting started with exploring this feature.
The multiple data sources feature is experimental and can’t be deployed into production. You can try it out with a sample data source and a sample index pattern. Before getting started, you must first edit the YAML configuration. The following section provides the steps for enabling the feature.
Modifying the multiple data sources settings
Dashboards is configured in the cluster settings, and the multiple data sources feature is disabled by default. To enable it, you need to edit the configuration in opensearch_dashboards.yml and then restart the cluster.
To enable the feature:
- Navigate to your Dashboards home directory; for example, in Docker,
/usr/share/opensearch-dashboards. - Open your local copy of the Dashboards configuration file,
opensearch_dashboards.yml. If you don’t have a copy, get one from GitHub:opensearch_dashboards.yml. - Set
data_source.enabled: falsetodata_source.enabled: trueand save the configuration. - Restart the Dashboards container.
- Verify the feature configuration settings were created and configured properly by connecting to Dashboards through http://localhost:5601 and viewing the Stack Management console. Data Sources
Experimentalwill appear in the sidebar. Alternatively, you can open on http://localhost:5601/app/management/opensearch-dashboards/dataSources.
Creating a data source connection
A data source connection specifies the parameters needed to connect to a data source. These parameters form a connection string for the data source. In Dashboards, you can add new data source connections or edit existing connections.
To create a new data source connection:
-
Open Dashboards. If you’re not running the Security plugin, go to
http://localhost:5601. If you’re running the Security plugin, go tohttps://localhost:5601and log in with the usernameadminand passwordadmin. -
In the Dashboards console, choose Stack Management > Data Sources
Experimental> Data Sources > Create data source connection, as shown in the following image.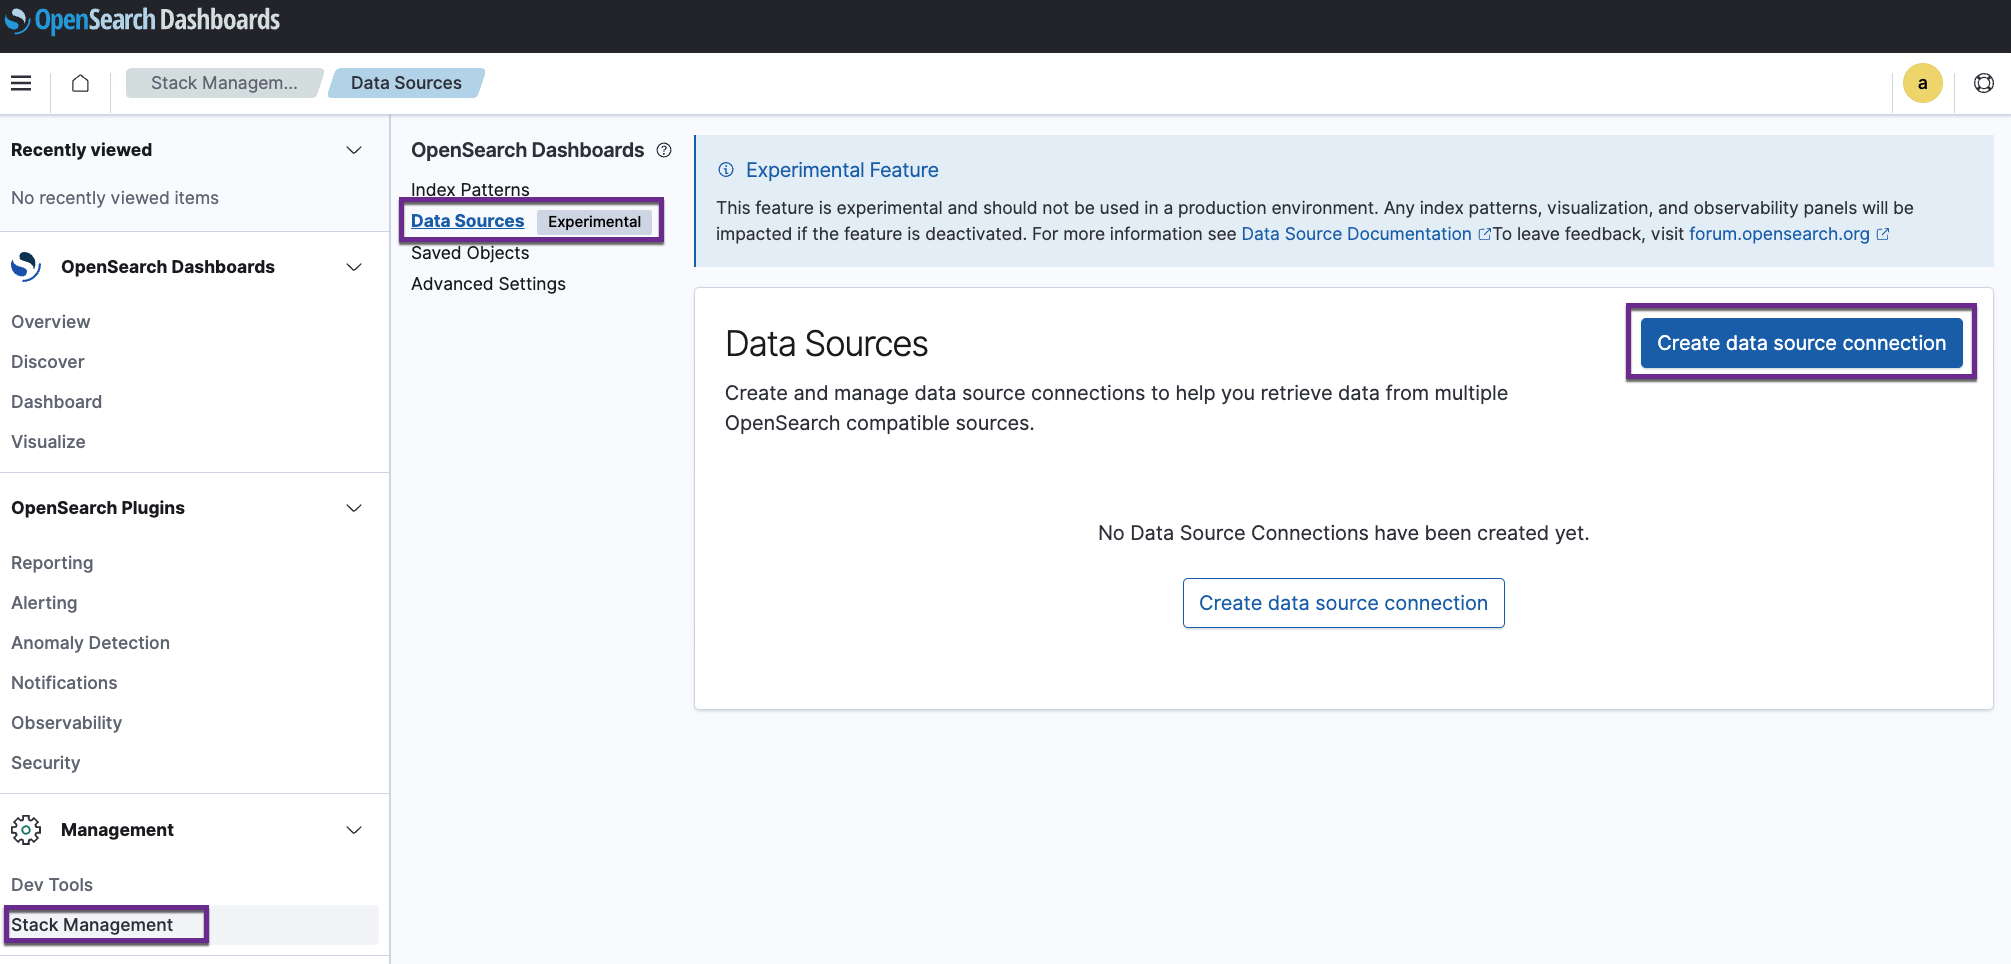
-
Add information to each field to configure Connection Details, Endpoint, and Authentication to connect to a data source, as shown in the following image. For this tutorial, the Endpoint URL is
http://localhost:5601/app/management/opensearch-dashboards/dataSources.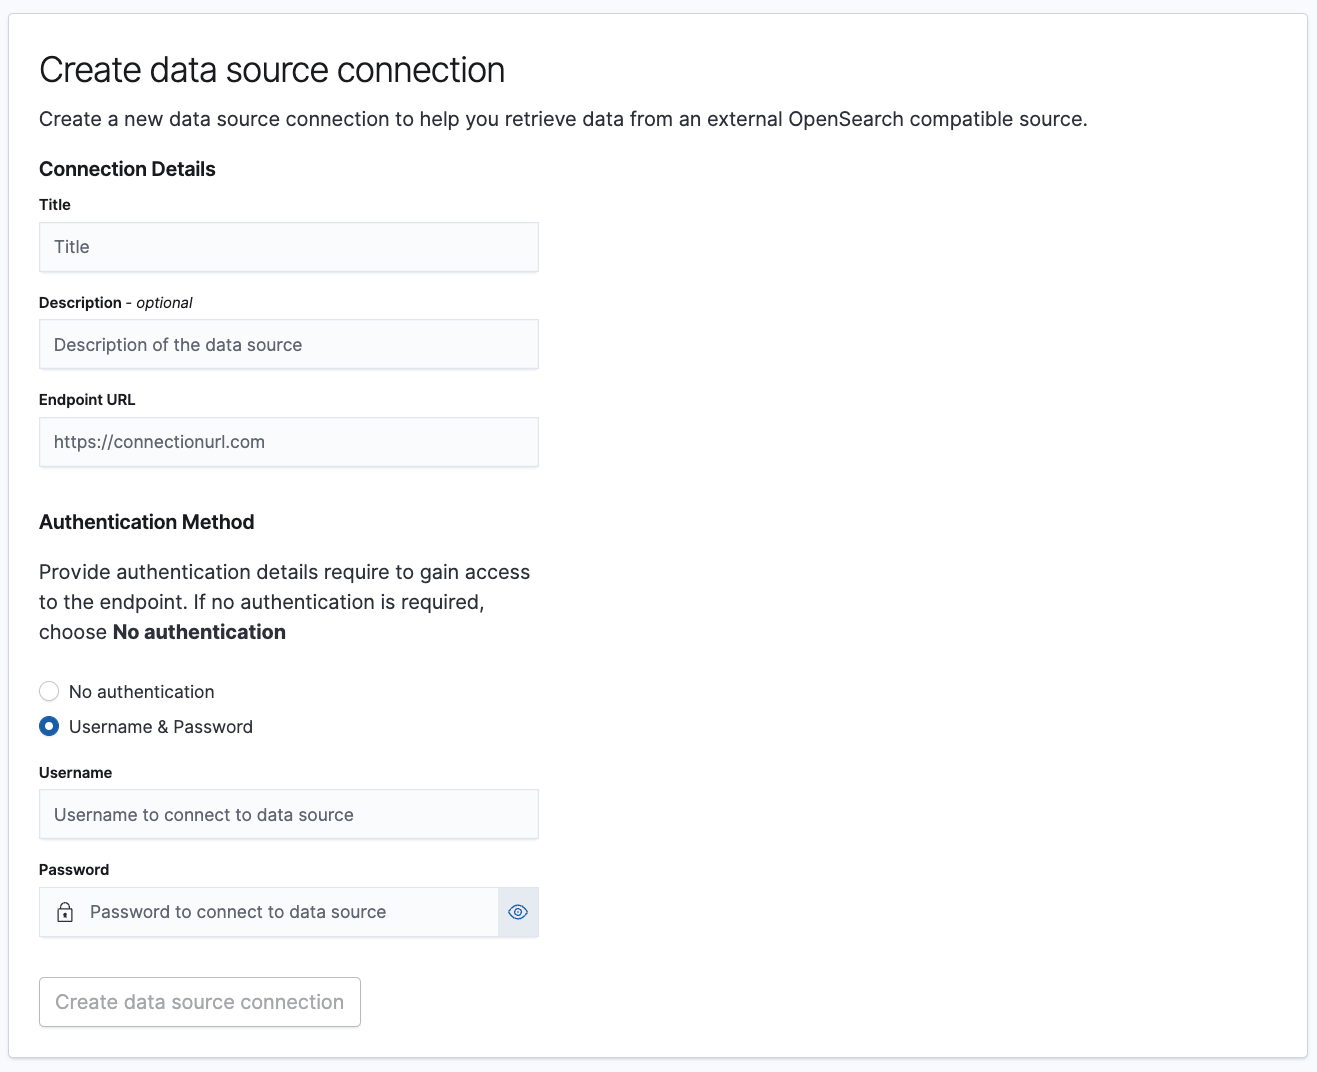
- Choose Create data source connection to save your settings.
-
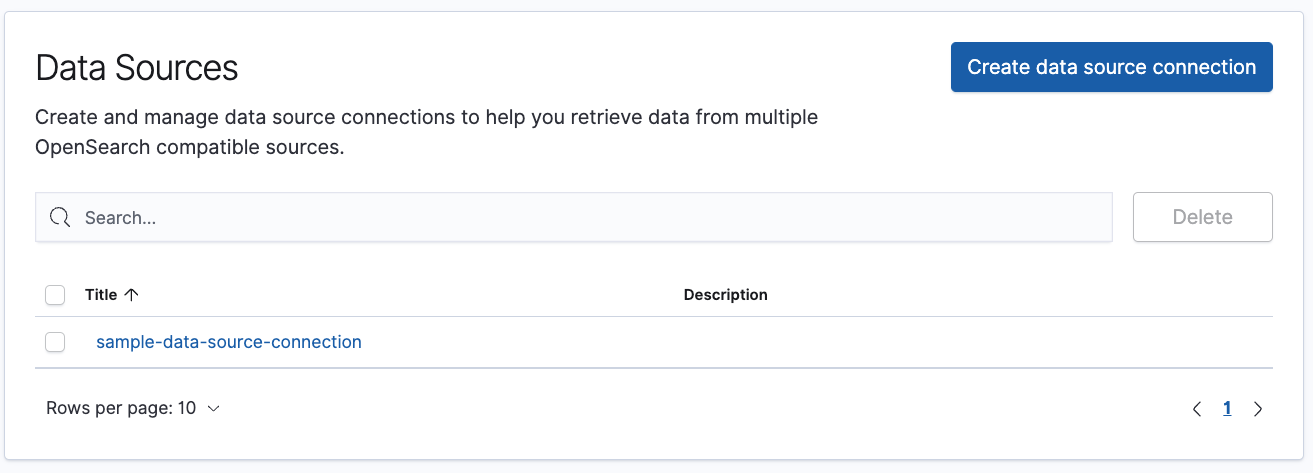
Return to the Data Sources main page to confirm that the newly created data source is listed under Data Sources, as shown in the following image.
-
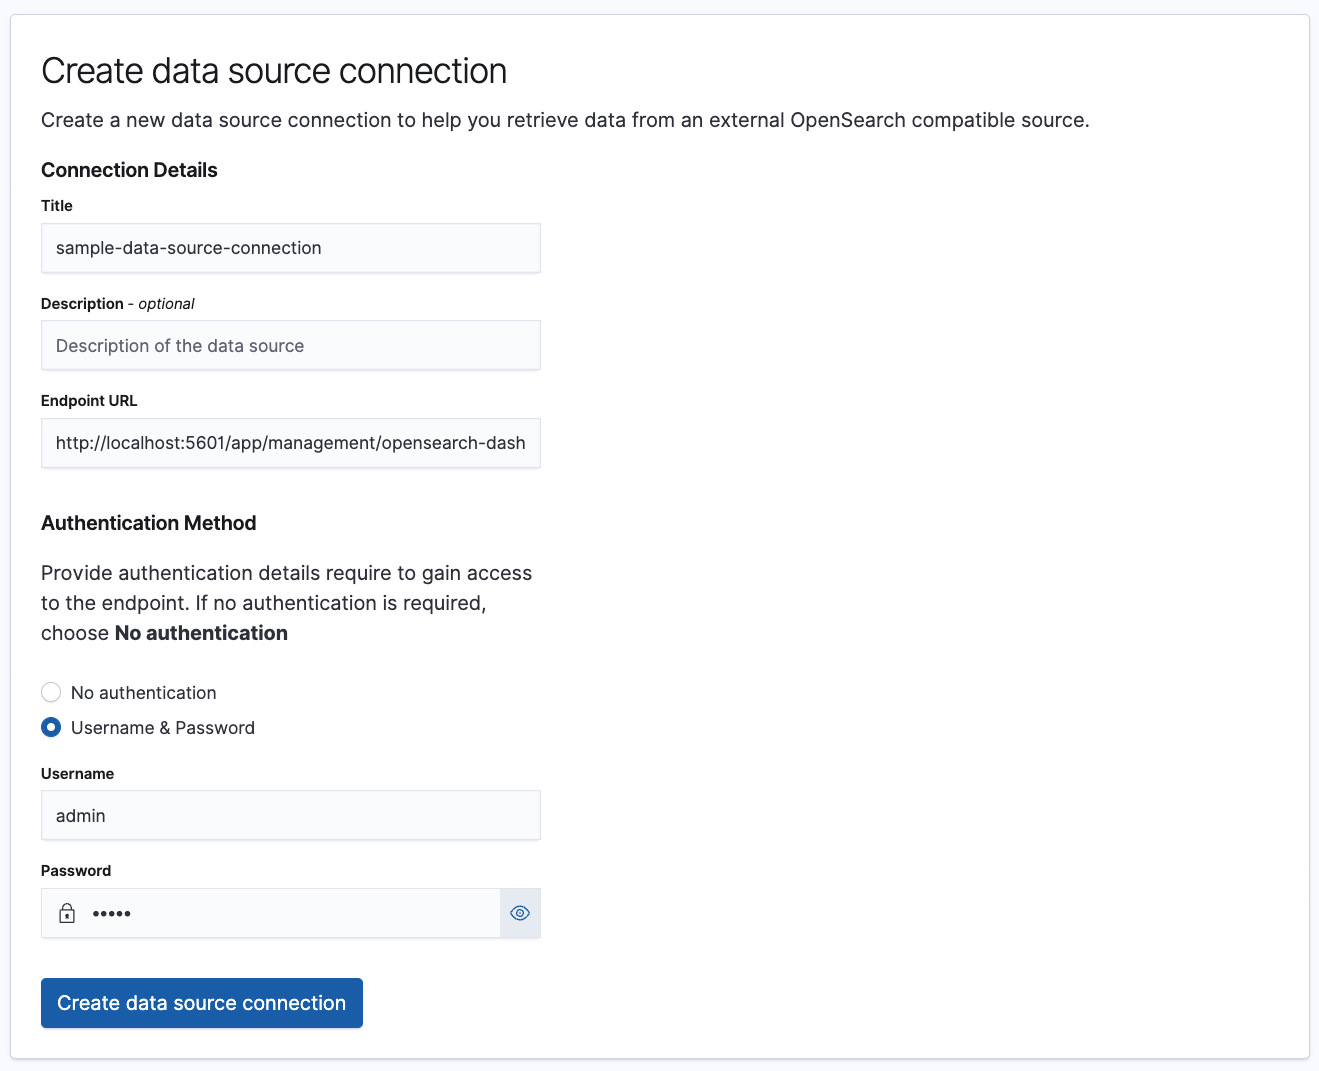
Optional: Select the data source to verify that the settings are configured properly, as shown in the following image.
Creating an index pattern
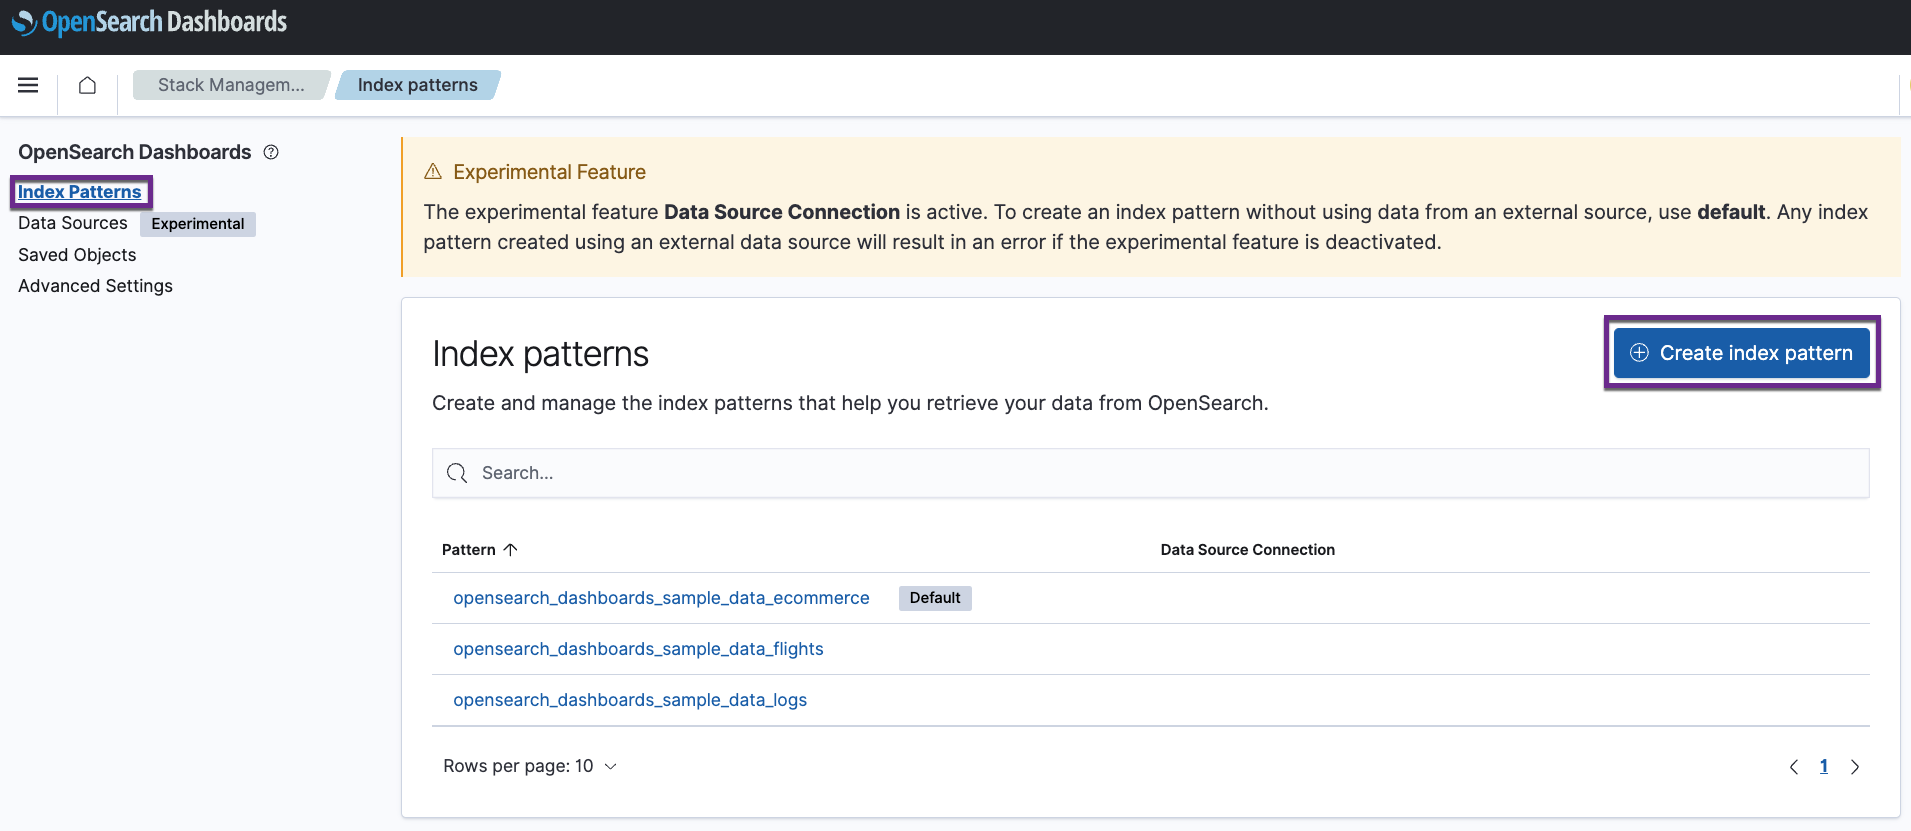
Index patterns allow you to access the OpenSearch data that you want to explore. An index pattern selects the data to use and allows you to define the field properties. Learn how to load your own data and create an index pattern following these steps. This tutorial uses the preconfigured index pattern opensearch_dashboards_sample_data_ecommerce Default.
-
In the Dashboards console, choose Index Patterns > Create index pattern, as shown in the following image.
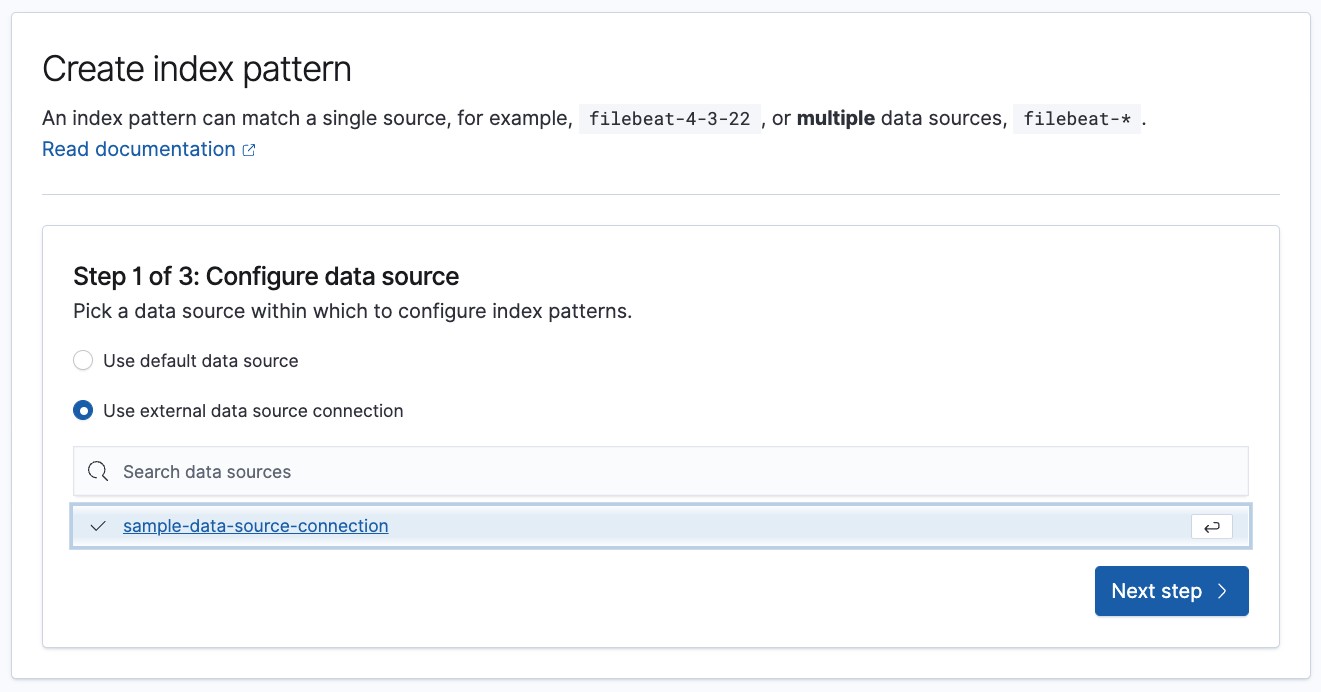
- Choose Use external data source connection.
-
Start typing in the Search data sources field to search for the data source you created earlier and then select the data source and Next step, as shown in the following image.
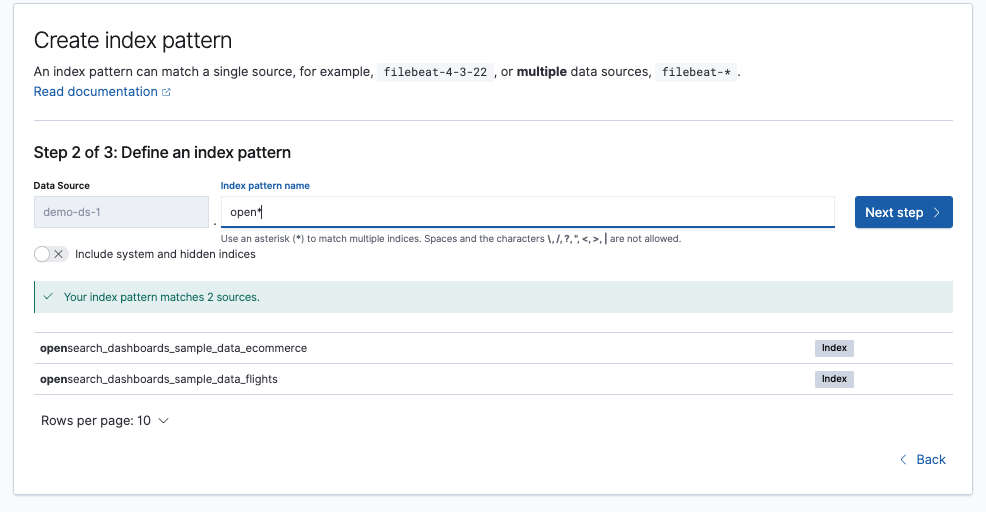
-
Add an Index pattern name to define the index pattern and then choose Next step, as shown in the following image.
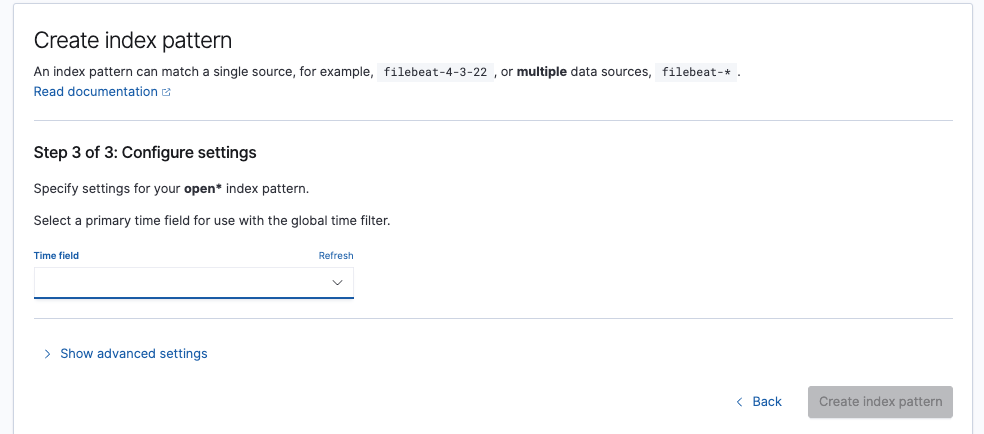
-
Select an option for the Time field and then choose Create index pattern, as shown in the following image.
Searching data
Before you start searching for data, set up the time filter. The sample index pattern used for this tutorial contains time-based data. You can set a time filter that displays only the data within a specified time range, and you can choose the time filter to change the time range or select a specific time range in the histogram.
Adjusting the time filter
To adjust the time filter:
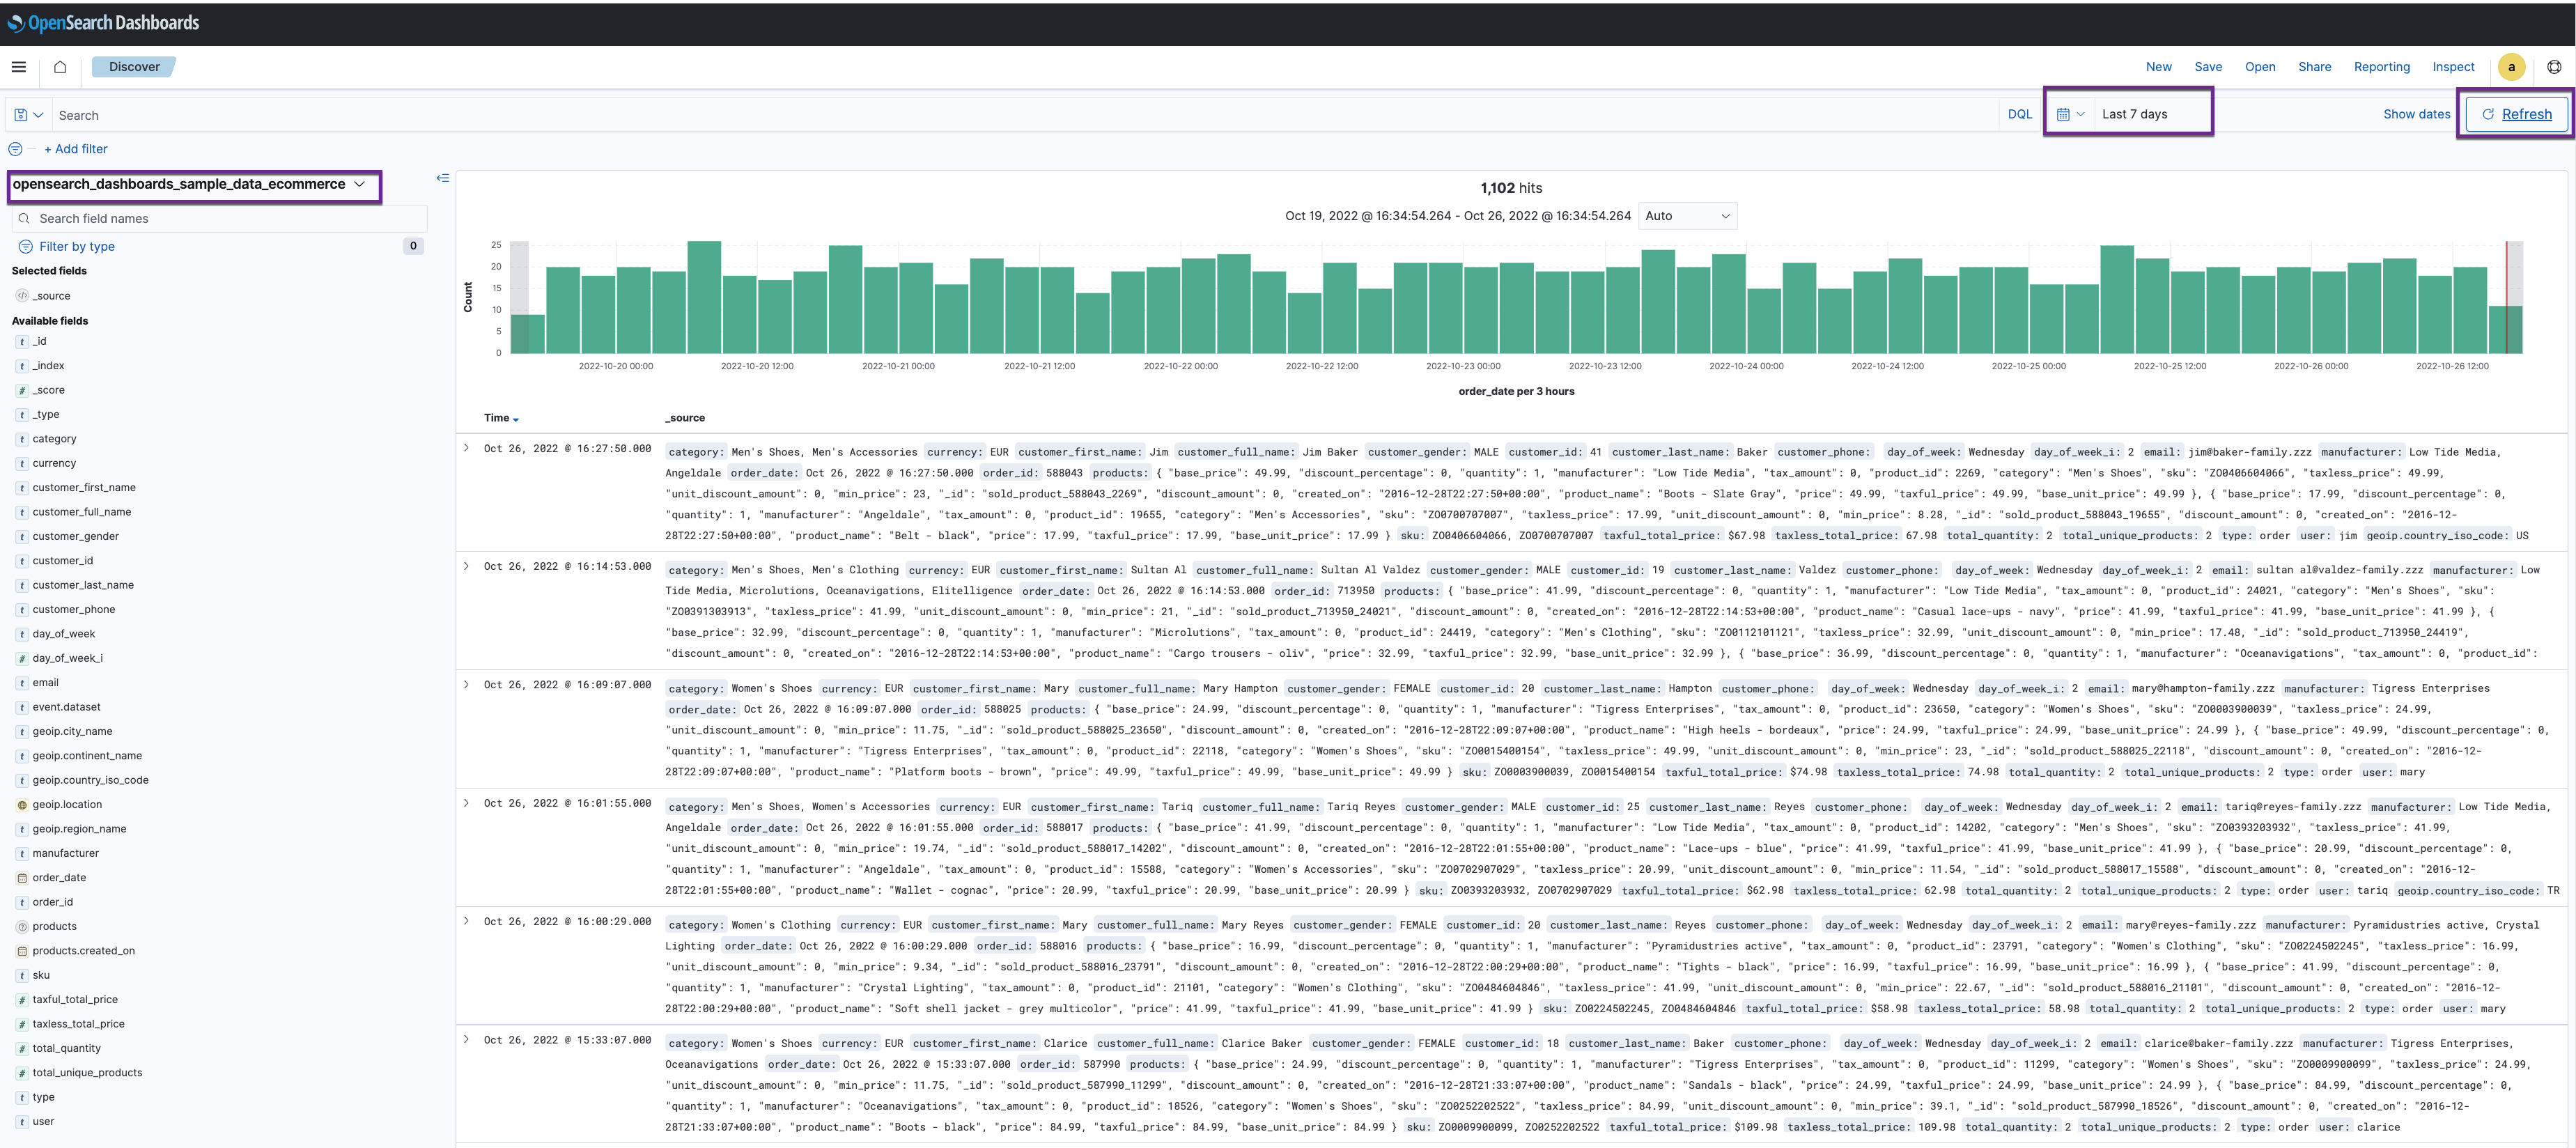
- In the Dashboards console, choose Discover and confirm that the index pattern being used is
opensearch_dashboards_sample_data_ecommerce. - Choose the calendar icon to change the time field. The default is Last 15 minutes.
-
Change the time field to Last 7 days and choose Refresh, as shown in the following image.
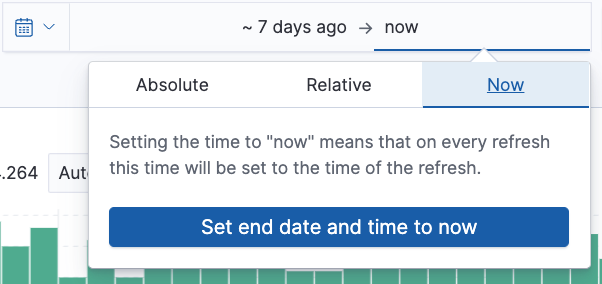
-
To set the start and end times, choose the bar next to the time filter. In the popup, select Absolute, Relative, or Now and then specify the required options, as shown in the following image.
Selecting a time range from the histogram
To select a time range for the histogram, you can do one of the following:
- Select the bar that represents the time range you want to zoom in on.
- Select the bar and drag to view a specific time range. You must start the selection with the cursor over the background of the chart (the cursor changes to a plus sign when you hover over a valid start point).
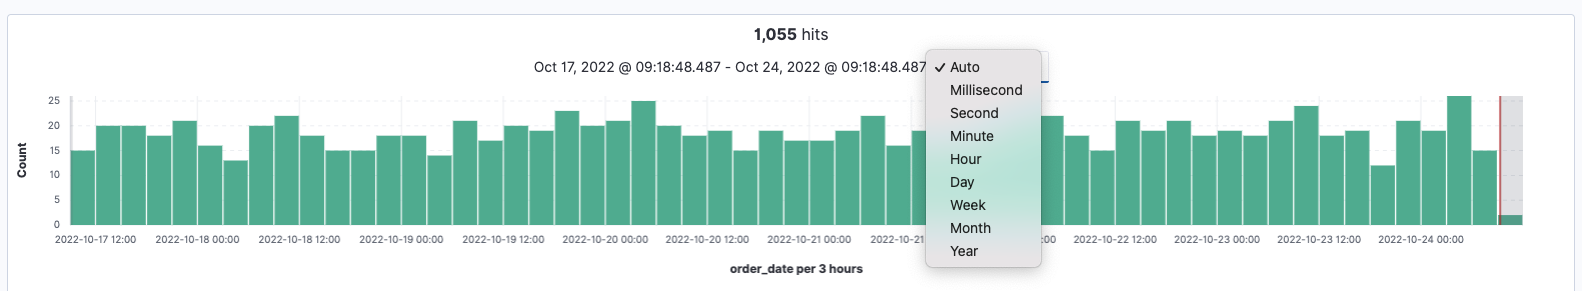
- Select the dropdown and then select an interval.
The following image shows a date histogram with an interval dropdown list.
Creating data visualizations for a dashboard
Follow these steps to learn how to create data visualizations for a dashboard:
- In the Dashboards console, choose Visualize > Create visualization.
- Select the visualization type. For this tutorial, choose Line.
- Select a source. For this tutorial, choose the index pattern
opensearch_dashboards_sample_data_ecommerce. - Under Buckets, choose Add > X-axis.
- In the Aggregation field, choose Date Histogram and then choose Update.
- Optional: Choose Save and add the file name. This tutorial uses preconfigured data visualizations, so you can’t save the file for this tutorial.
Connecting visualizations in a single dashboard
Follow these steps to connect your visualizations in a single dashboard:
- In the Dashboards console, choose Dashboard > Create dashboard.
- Choose Add an existing and then select the data you want to add.
- Choose Save and add the dashboard name in the Title field. This tutorial uses preconfigured dashboards, so you won’t be able to save your dashboard.
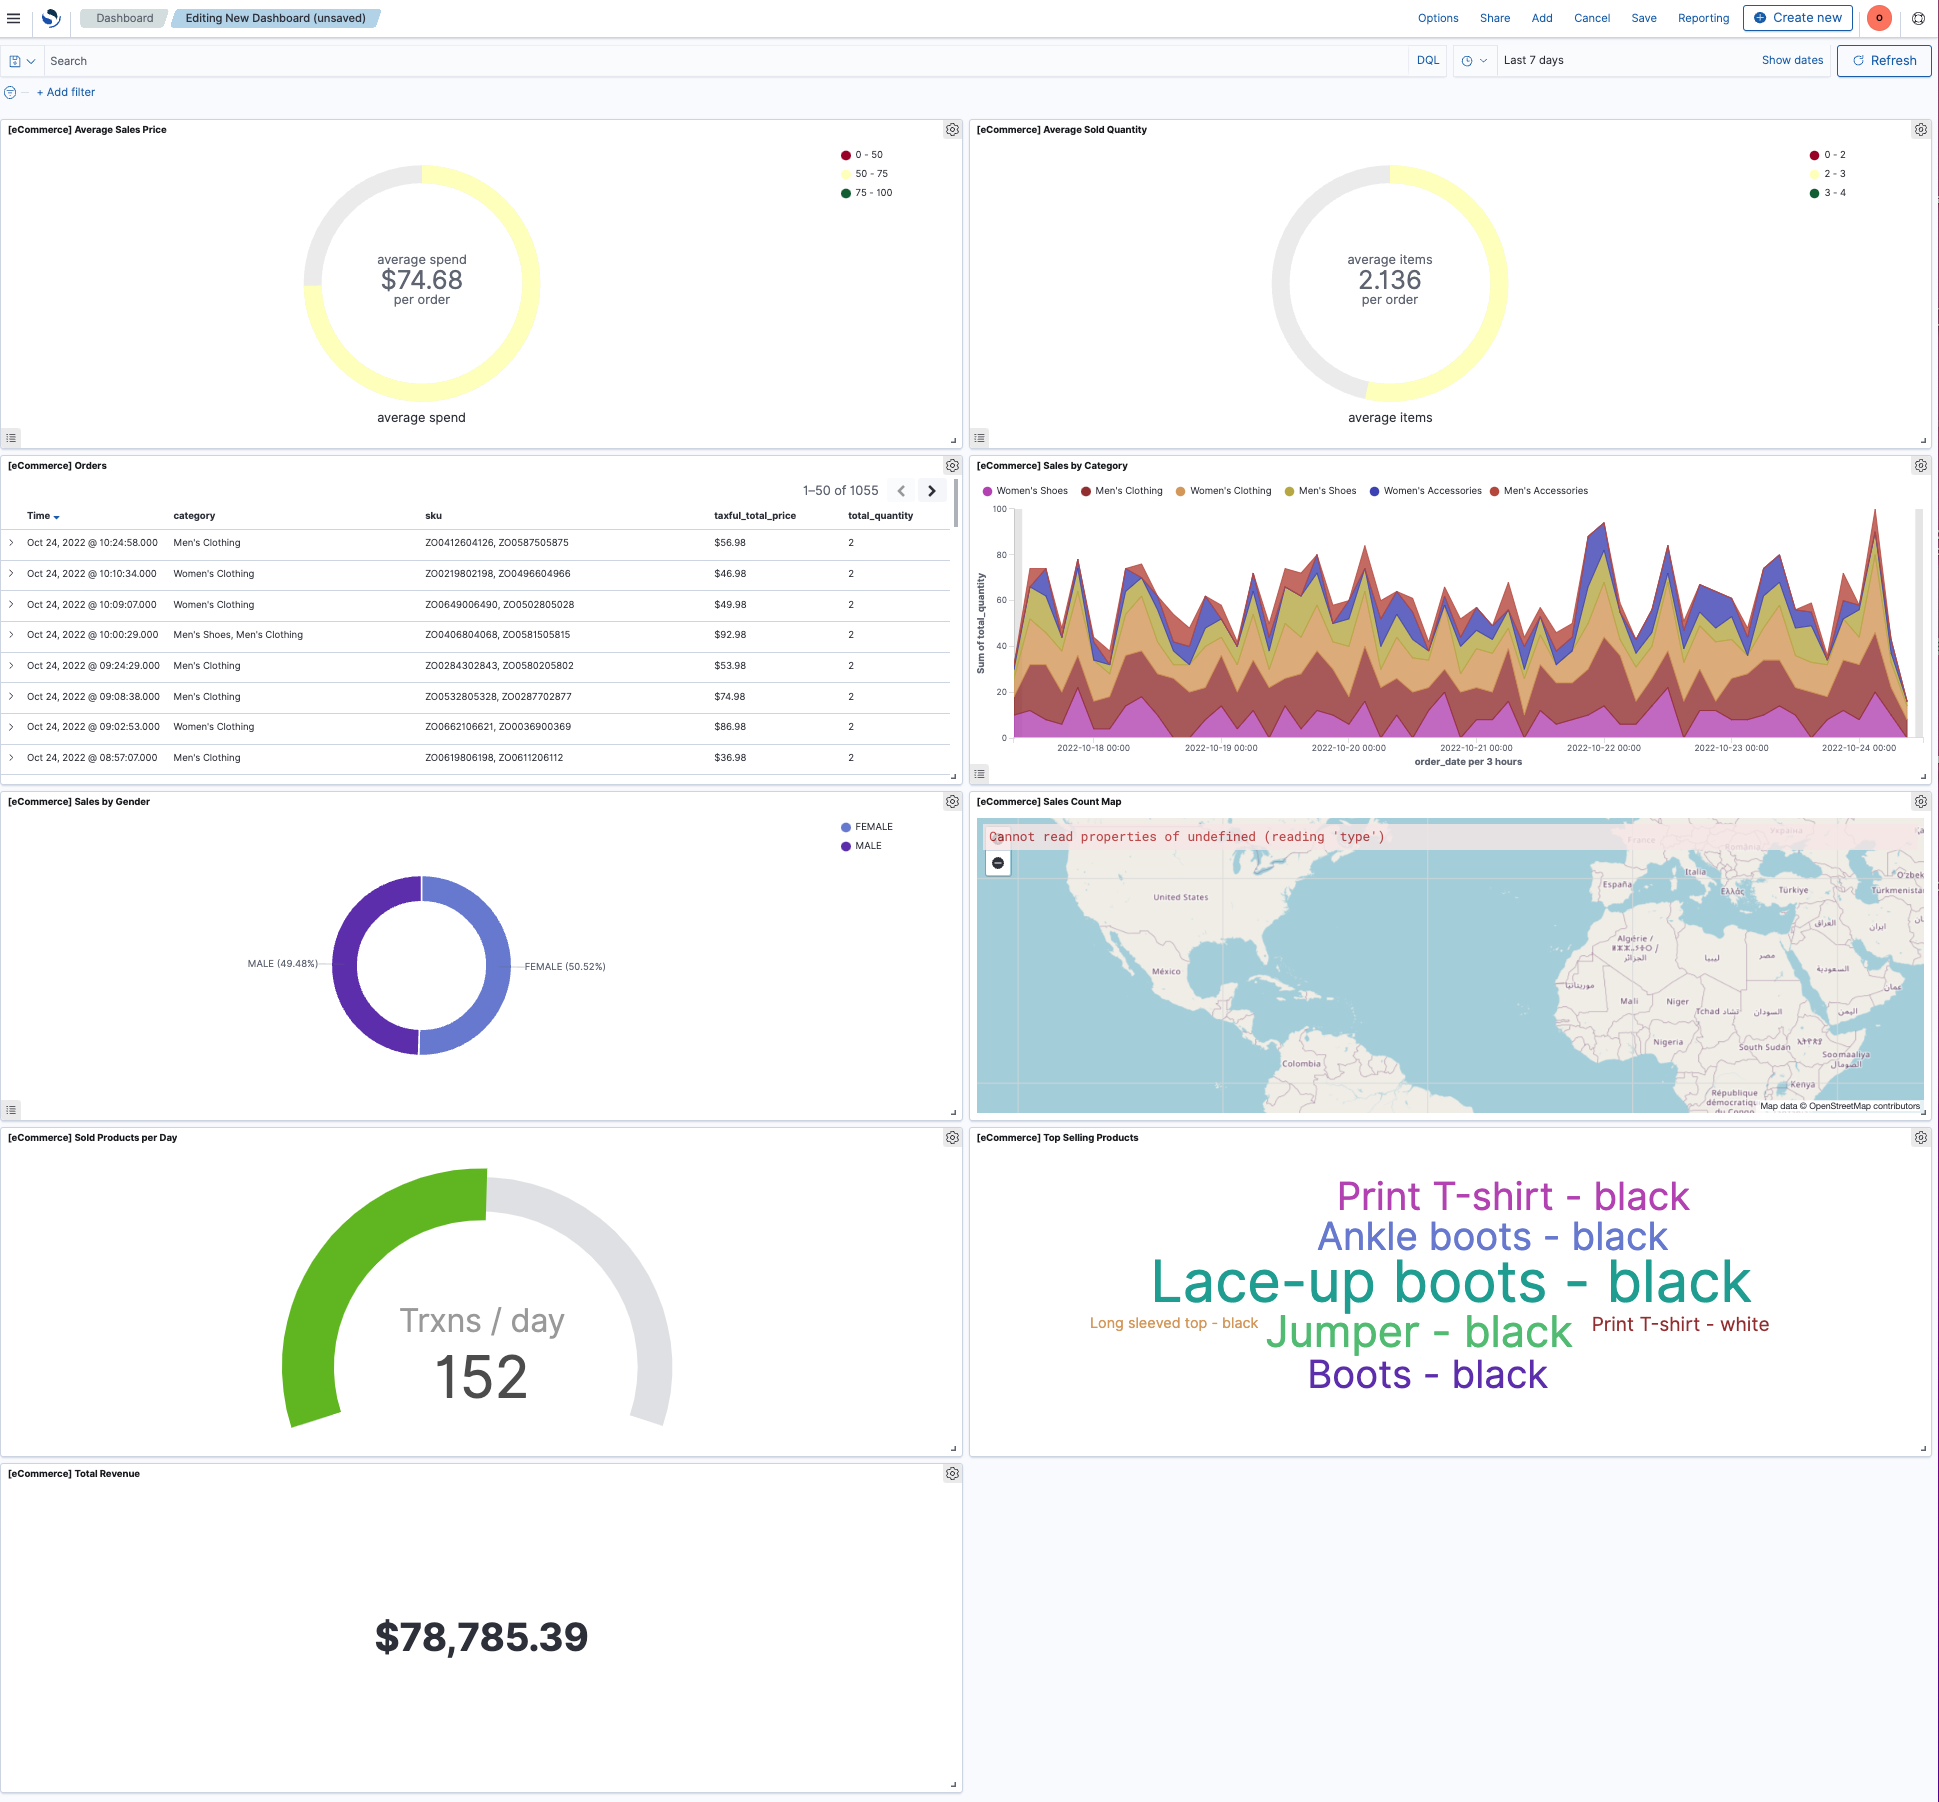
- Click on the white space left of Add panels to view the visualizations in a single dashboard.
Your dashboard might look like the one in the following image.
You have now explored the data sources experimental feature. To provide feedback on how this feature can be improved ahead of its release for production use, comment in the OpenSearch forum.
Understanding feature limitations
The following limitations apply to this experimental feature:
- The multiple data sources feature is supported for index-pattern-based visualizations only.
- The visualization types Time Series Visual Builder (TSVB), Vega and Vega-Lite, and timeline are not supported.
- External plugins, such as Gantt chart, and non-visualization plugins, such as the developer console, are not supported.