This version of the OpenSearch documentation is no longer maintained. For the latest version, see the current documentation. For information about OpenSearch version maintenance, see Release Schedule and Maintenance Policy.
Metrics analytics
Introduced 2.4
Starting with OpenSearch 2.4, you can ingest and visualize metric data from log data aggregated within OpenSearch, allowing you to analyze and correlate data across logs, traces, and metrics. Previously, you could ingest and visualize only logs and traces from your monitored environments. With this feature, you can observe your digital assets with more granularity, gain deeper insight into the health of your infrastructure, and better inform your root cause analysis.
The following image shows the process of ingesting metrics from Prometheus and visualizing them in a dashboard.
Configuring a data source connection from Prometheus to OpenSearch
You can view metrics collected from Prometheus in OpenSearch Dashboards by first creating a connection from Prometheus to OpenSearch using the SQL plugin.
To configure a connection to Prometheus, create a file on your OpenSearch nodes named datasources.json containing the Prometheus data source settings. The following examples demonstrate the various Prometheus data source configurations using different authentication methods.
No authentication:
[{
    "name" : "my_prometheus",
    "connector": "prometheus",
    "properties" : {
        "prometheus.uri" : "http://localhost:9090"
    }
}]
Basic authentication:
[{
    "name" : "my_prometheus",
    "connector": "prometheus",
    "properties" : {
        "prometheus.uri" : "http://localhost:9090",
        "prometheus.auth.type" : "basicauth",
        "prometheus.auth.username" : "admin",
        "prometheus.auth.password" : "admin"
    }
}]
AWS SigV4 authentication:
[{
    "name" : "my_prometheus",
    "connector": "prometheus",
    "properties" : {
        "prometheus.uri" : "http://localhost:8080",
        "prometheus.auth.type" : "awssigv4",
        "prometheus.auth.region" : "us-east-1",
        "prometheus.auth.access_key" : ""
        "prometheus.auth.secret_key" : ""
    }
}]
After configuring Prometheus in the datasources.json file, run the following command to load the configuration into the OpenSearch keystore. The configuration is securely stored in the keystore because it contains sensitive credential information.
bin/opensearch-keystore add-file plugins.query.federation.datasources.config datasources.json
If you are updating the keystore during runtime, refresh the keystore using following API command:
POST /_nodes/reload_secure_settings
{
  "secure_settings_password":""

}
After configuring the connection from Prometheus to OpenSearch, Prometheus metrics are displayed in Dashboards in the Observability > Metrics analytics window, as shown in the following image.
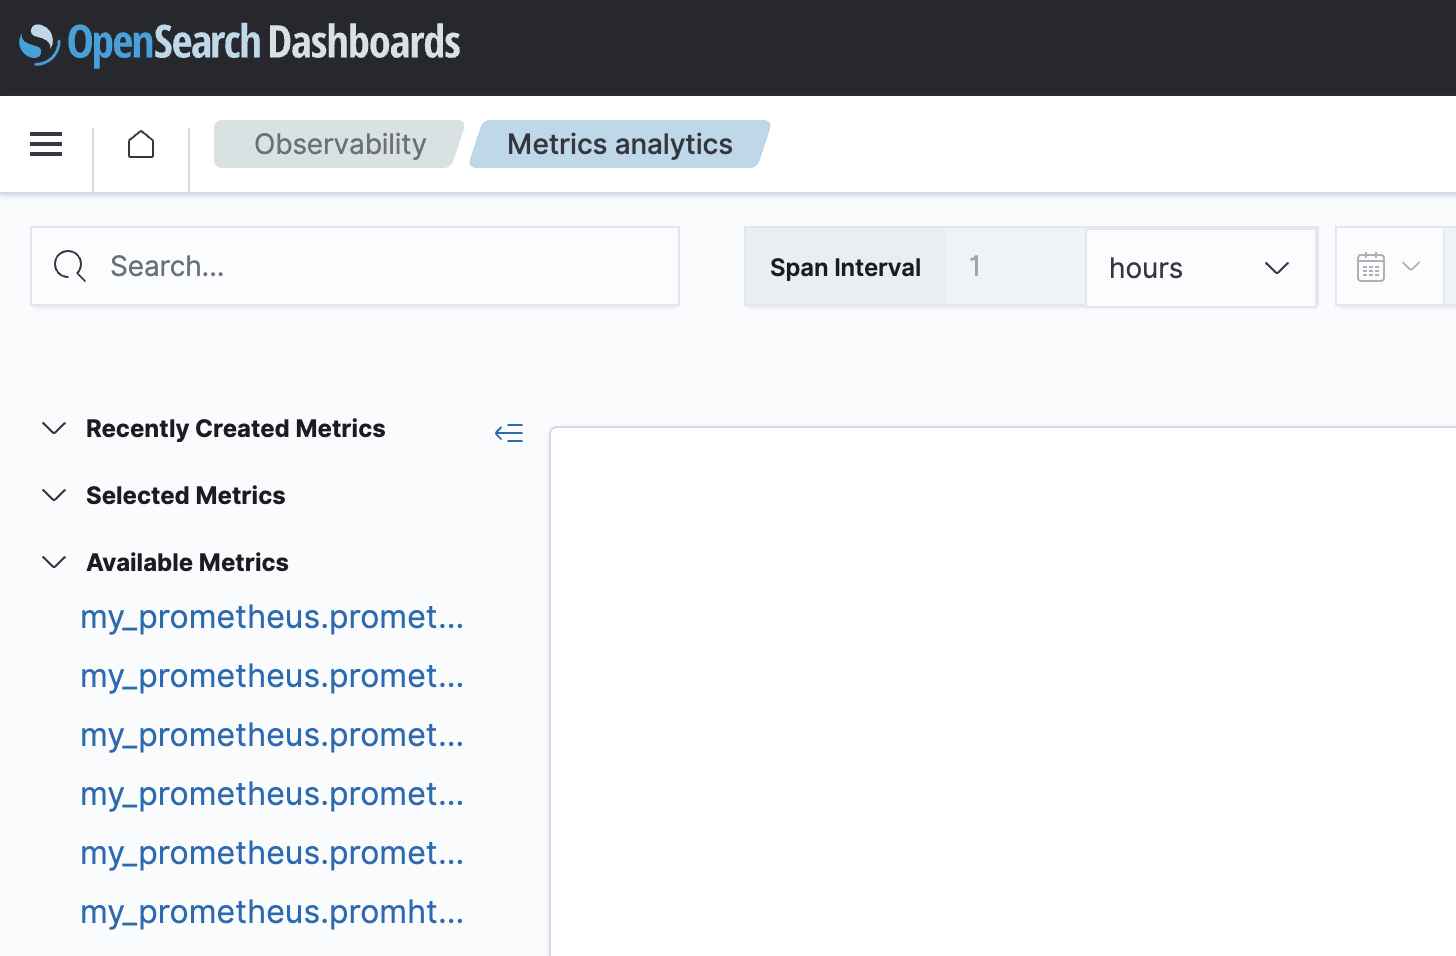
For more information, see the Prometheus Connector GitHub page.
Creating visualizations based on metrics
You can create visualizations based on Prometheus metrics and other metrics collected by your OpenSearch cluster.
To create a visualization, do the following:
- In Observability > Metrics analytics > Available Metrics, select the metrics you would like to include in your visualization.
- These visualizations can now be saved.
- From the Metrics analytics window, select Save.
- When prompted for a Custom operational dashboards/application, choose one of the available options.
- Optionally, you can edit the predefined name values under the Metric Name fields to suit your needs.
- Select Save.
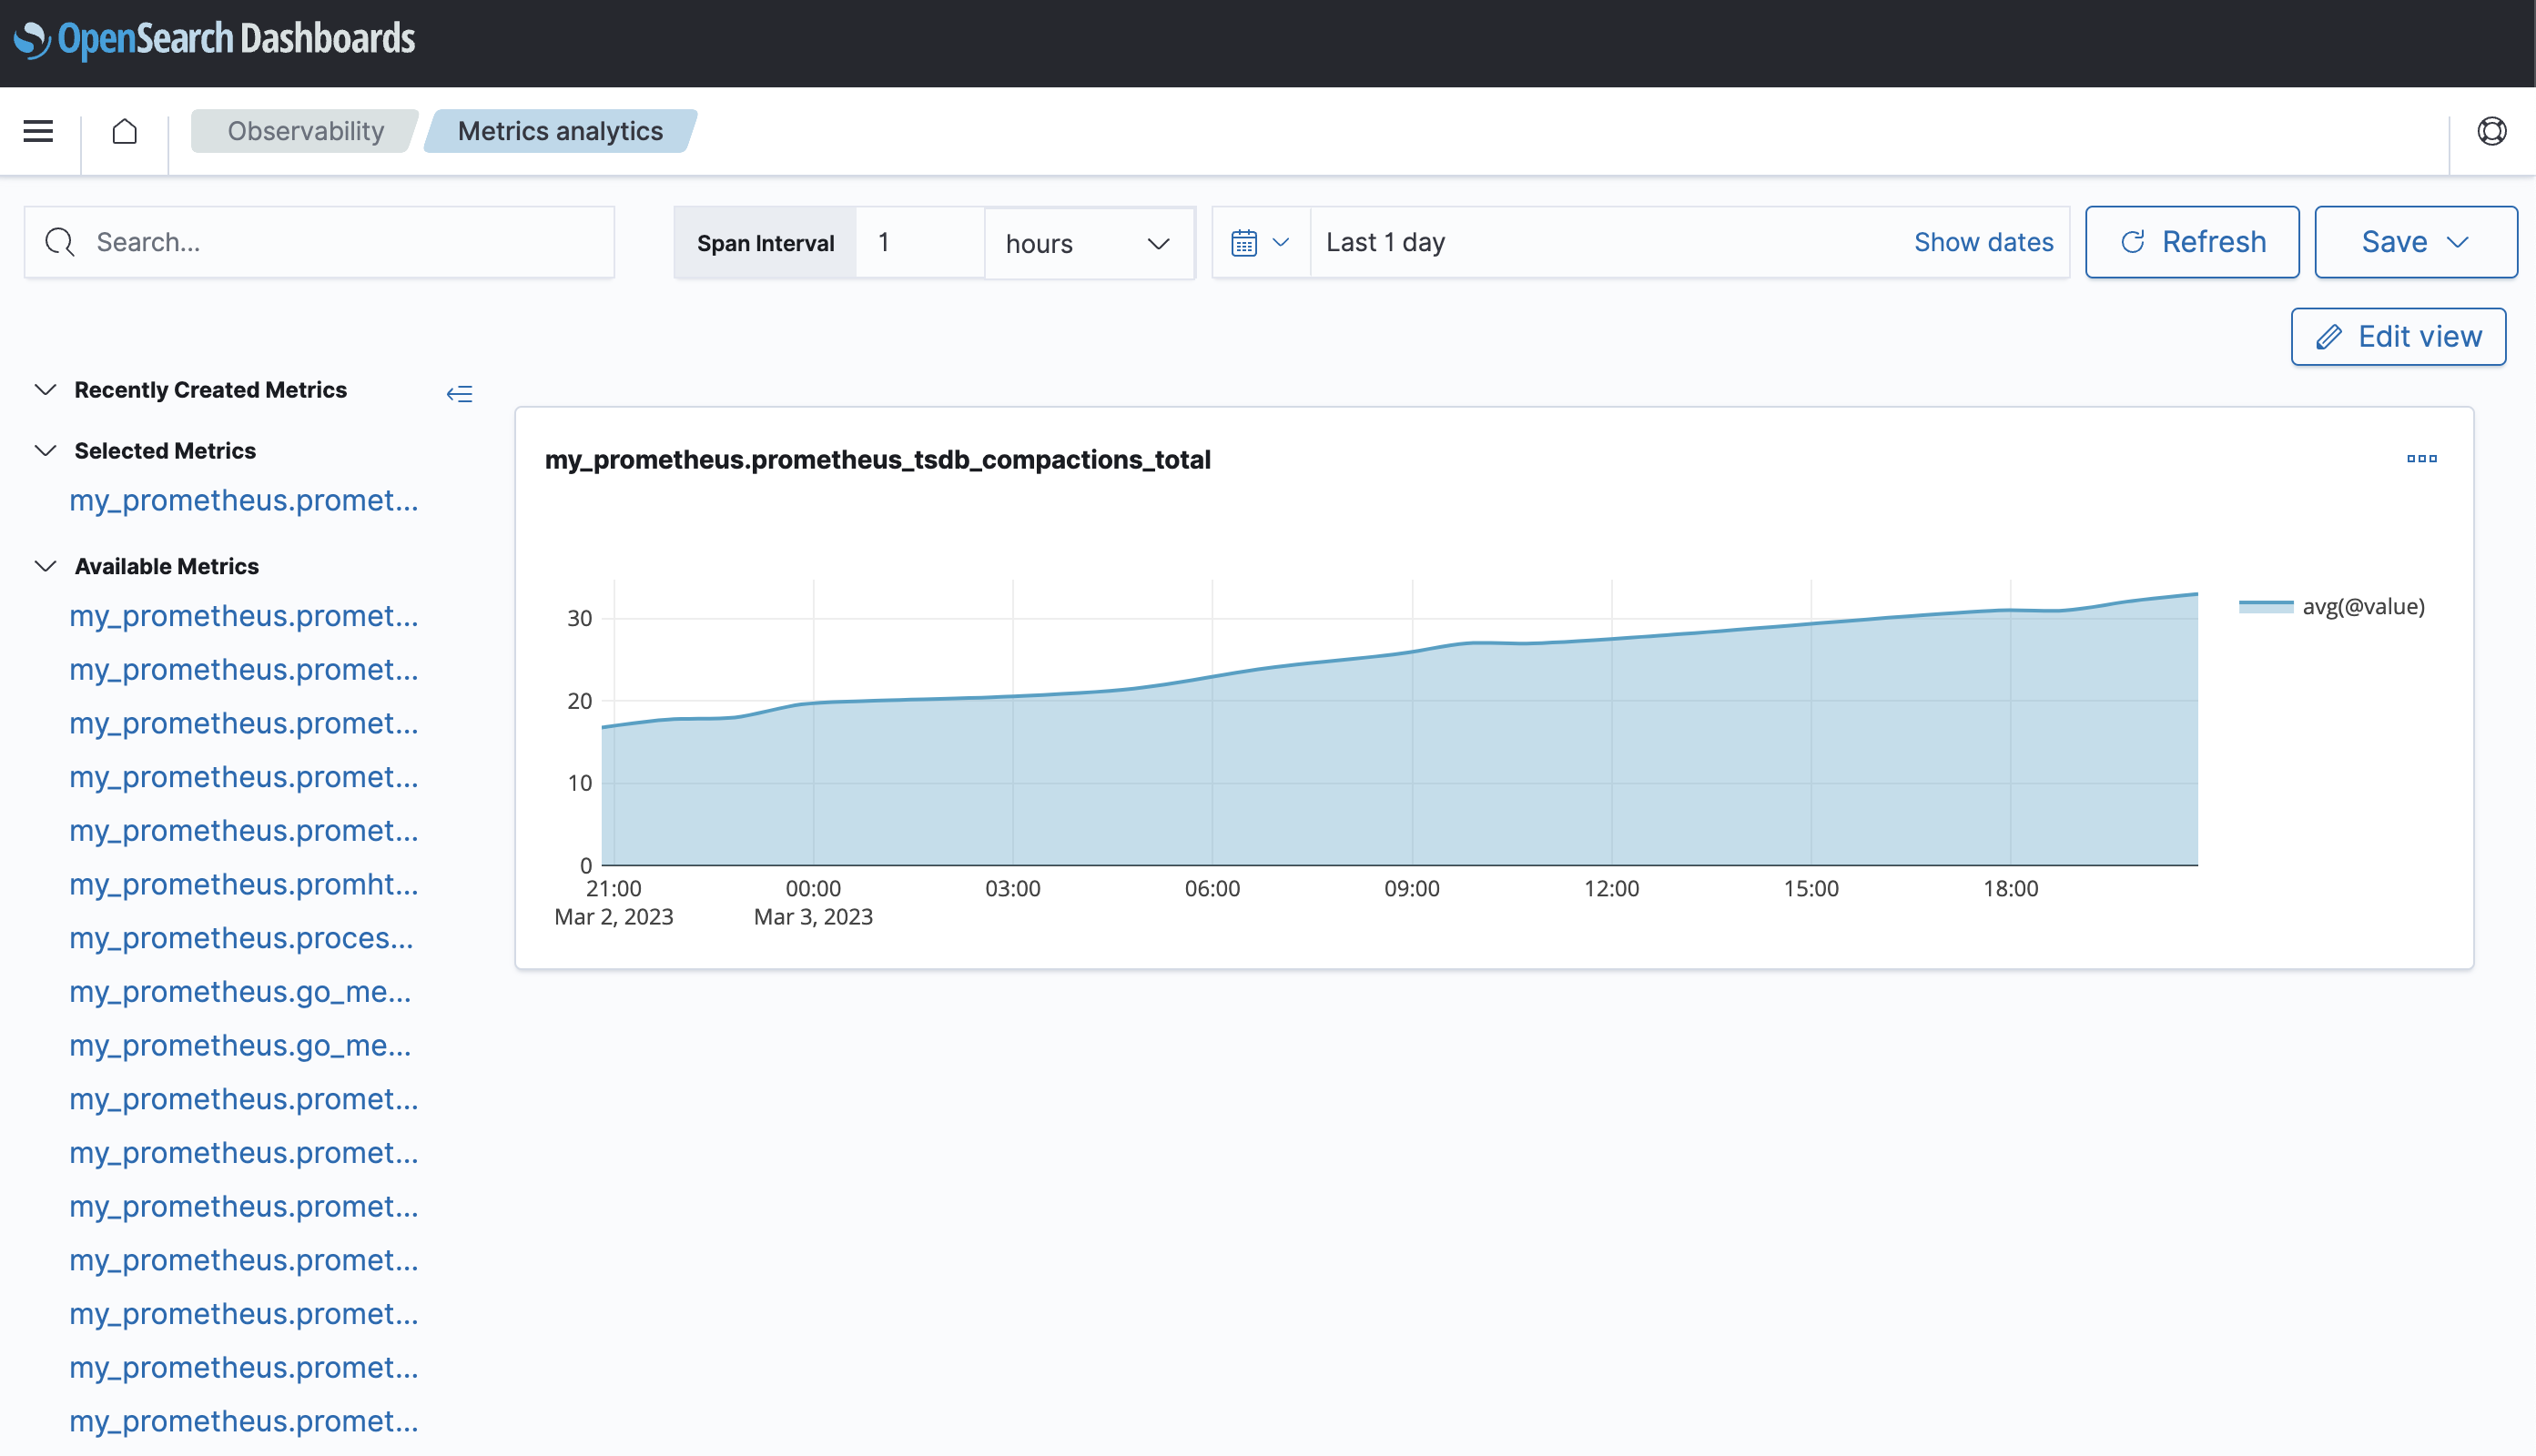
The following image shows an example of the visualizations that are displayed in the Observability > Metrics analytics window.
Defining PPL queries for use with Prometheus
You can define Piped Processing Language (PPL) queries against metrics collected by Prometheus. The following example shows a metric-selecting query with specific dimensions:
source = my_prometheus.prometheus_http_requests_total | stats avg(@value) by span(@timestamp,15s), handler, code
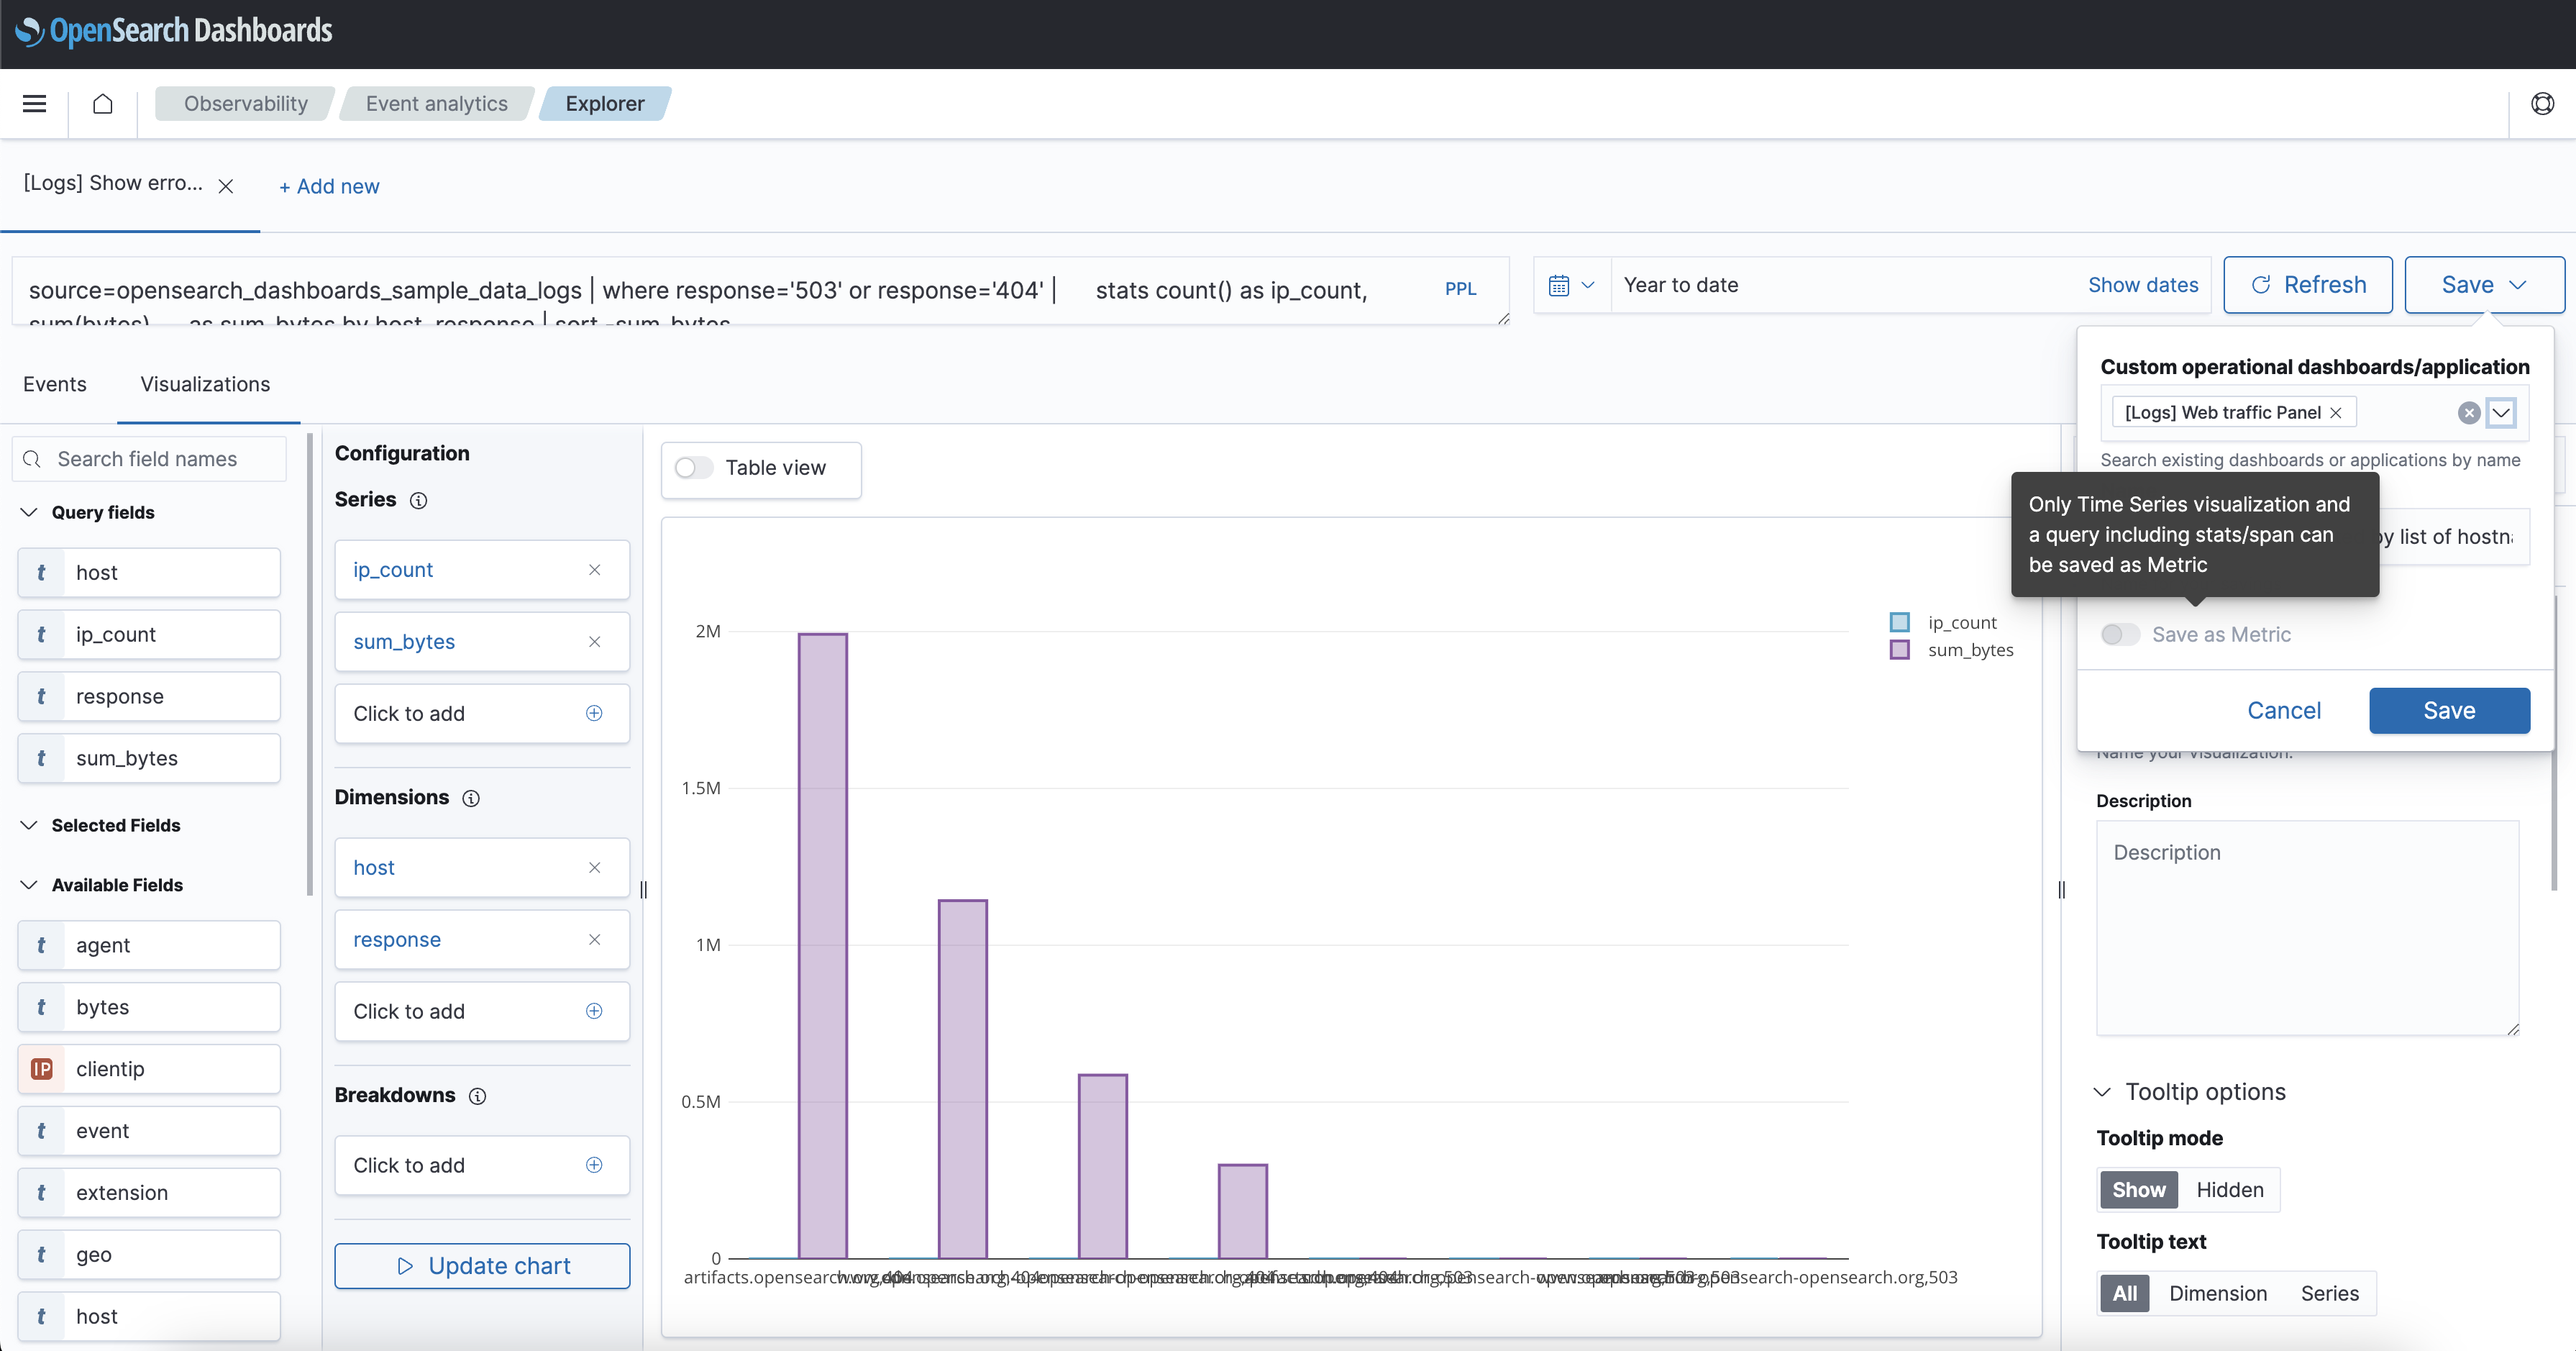
Additionally, you can create a custom visualization by performing the following steps:
- From the Events Analytics window, enter your PPL query and select Refresh. The Explorer page is now displayed.
- From the Explorer page, select Save.
- When prompted for a Custom operational dashboards/application, choose one of the available options.
- Optionally, you can edit the predefined name values under the Metric Name fields to suit your needs.
- Optionally, you can choose to save the visualization as a metric.
- Select Save.
Note: Only queries that include a time-series visualization and stats/span can be saved as a metric, as shown in the following image.