Using coordinate and region maps
OpenSearch has a standard set of GeoJSON files that provide a vector map with each region map. OpenSearch Dashboards also provides basic map tiles with a standard vector map to create region maps. You can configure the base map tiles using Web Map Service (WMS). For more information, see Configuring WMS in OpenSearch Dashboards.
For air gapped environments, OpenSearch Dashboards provides a self-host maps server. For more information, see Using the self-host maps server
While you can’t configure a server to support user-defined vector map layers, you can configure your own GeoJSON file and upload it for this purpose.
Customizing vector maps with GeoJSON
If you have a specific locale that is not provided by OpenSearch Dashboards vector maps, such as a US county or US ZIP Code, you can create your own custom vector map with a GeoJSON file. To create a custom region map you would define a geographic shape such as a polygon with multiple coordinates. To learn more about the various geographic shapes that support a custom region map location, see Geoshape field type.
GeoJSON format allows you to encode geographic data structures. To learn more about the GeoJSON specification, go to geojson.org.
You can use geojson.io to extract GeoJSON files.
PREREQUISITE To use a custom vector map with GeoJSON, install these two required plugins:
- OpenSearch Dashboards Maps
dashboards-mapsfront-end plugin- OpenSearch
geospatialbackend plugin
Step 1: Creating a region map visualization
To create your own custom vector map, upload a JSON file that contains GEO data for your customized regional maps. The JSON file contains vector layers for visualization.
- Prepare a JSON file to upload. Make sure the file has either a .geojson or .json extension.
- On the top menu bar, go to OpenSearch Dashboards > Visualize.
- Select the Create Visualization button.
- Select Region Map.
- Choose a source. For example, [Flights] Flight Log.
- In the right panel, select Import Vector Map.
-
In Upload map, select or drag and drop your JSON file and then enter Map name prefix (for example,
usa-counties). Your map will have the prefix that you defined followed by the-mapsuffix (for example,usa-counties-map), as shown in the following image: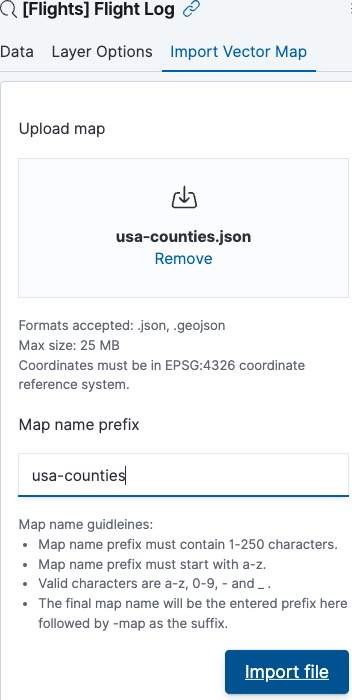
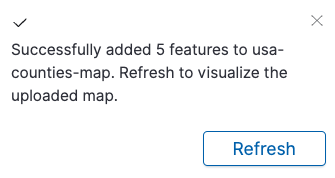
- Select the Import file button and then select the Refresh button in the pop-up window confirming successful upload, as shown in the following image.
Step 2: Viewing the custom region map in OpenSearch Dashboards
After you upload a custom GeoJSON file, you need to set the vector map layer to custom, and select your vector map:
- From Layer Options > Layer settings, select Custom vector map.
- Under Vector map, select the name of the vector map that you just uploaded.
- Optional: Under Style settings, increase Border thickness to see the borders more clearly.
- Select the Update button.
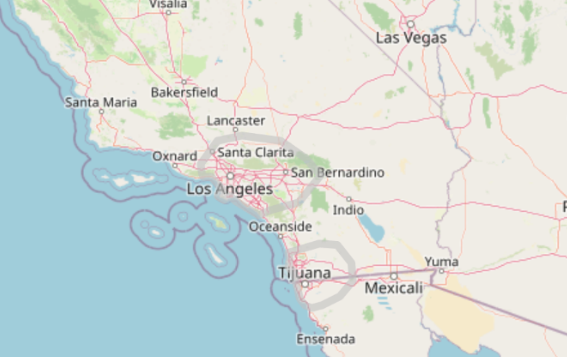
- View your region map in the Dashboards. For example, the following image shows the Los Angeles and San Diego county regions:
Example GeoJSON file
The following example GeoJSON file provides coordinates for two US counties.
{
  "type": "FeatureCollection",
  "name": "usa counties",
  "features": [
    { "type": "Feature", "properties": { "iso2": "US", "iso3": "LA-CA", "name": "Los Angeles County", "country": "US", "county": "LA" }, "geometry": { "type": "Polygon", "coordinates":[[[-118.71826171875,34.07086232376631],[-118.69628906249999,34.03445260967645],[-118.56994628906249,34.02990029603907],[-118.487548828125,33.957030069982316],[-118.37219238281249,33.86129311351553],[-118.45458984375,33.75631505992707],[-118.33923339843749,33.715201644740844],[-118.22937011718749,33.75631505992707],[-118.1414794921875,33.678639851675555],[-117.9107666015625,33.578014746143985],[-117.75146484375,33.4955977448657],[-117.55920410156249,33.55512901742288],[-117.3065185546875,33.5963189611327],[-117.0703125,33.67406853374198],[-116.69677734375,34.06176136129718],[-116.9439697265625,34.28445325435288],[-117.18017578125,34.42956713470528],[-117.3779296875,34.542762387234845],[-117.62512207031251,34.56990638085636],[-118.048095703125,34.615126683462194],[-118.44909667968749,34.542762387234845],[-118.61938476562499,34.38877925439021],[-118.740234375,34.21180215769026],[-118.71826171875,34.07086232376631]]] } },
    { "type": "Feature", "properties": { "iso2": "US", "iso3": "SD-CA", "name": "San Diego County", "country": "US", "county": "SD" }, "geometry": { "type": "Polygon", "coordinates":[[[-117.23510742187501,32.861132322810946],[-117.2406005859375,32.75494243654723],[-117.1636962890625,32.68099643258195],[-117.14172363281251,32.58384932565662],[-117.09228515624999,32.46342595776104],[-117.0538330078125,32.29177633471201],[-116.96044921875,32.194208672875384],[-116.85607910156249,32.16631295696736],[-116.6748046875,32.20350534542368],[-116.3671875,32.319633552035214],[-116.1474609375,32.55144352864431],[-116.1639404296875,32.80574473290688],[-116.4111328125,33.073130945006625],[-116.72973632812499,33.08233672856376],[-117.09228515624999,32.99484290420988],[-117.2515869140625,32.96258644191747], [-117.23510742187501,32.861132322810946]]] } }
  ]
}