Creating detectors
Security Analytics provides the options and functionality to monitor and respond to a wide range of security threats. Detectors are the essential components that determine what to look for and how to respond to those threats. This section covers their creation and configuration.
For information about working with existing detection rules, see Creating detection rules.
Step 1. Define a detector
You can define a new detector by naming the detector and then selecting a data source and detector type. After defining a detector, you can configure field mappings, create a detector schedule, and set up alerts.
To define a detector:
- On the Security Analytics home page or the Detectors page, choose Create detector.
- Give the detector a name and, optionally, a description.
- In the Data source section, select one or more sources for the log data. Use an asterisk (*) to indicate a wildcard pattern. When selecting multiple data sources, their logs must be of the same type. It is good practice to create separate detectors for different log types. Security Analytics also supports the following:
- Aliases: When configuring an alias as the data source, it must be attached to a Write index alias. When using an alias, ensure that your documents are ingested through the alias and not through the index for which the alias was created.
- Data streams: A set of time-series data stored across multiple indexes but called using a single named resource.
-
In the Detection section, select a log type for the data source. For a list of supported log types, see Supported log types. To create your own log types, see Creating custom log types.
When you select
network,cloudtrail, ors3as the log type, the system automatically creates a detector dashboard. The dashboard offers visualizations for the detector and can provide security-related insight into log source data. For more information about visualizations, see Building data visualizations. -
Expand Detection rules to show the list of available detection rules for the selected log type. Initially, all rules are selected by default. The following example shows the rules associated with the windows log type.
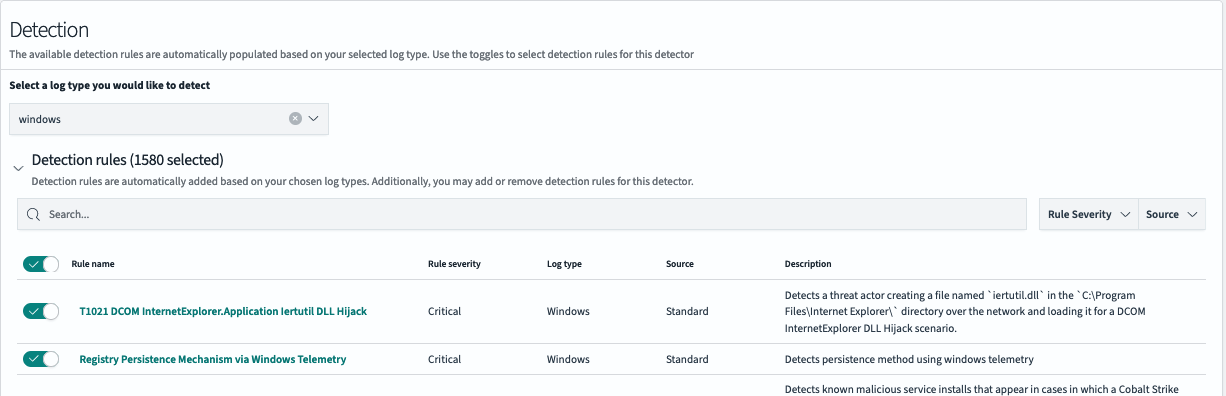
You can perform the following actions when viewing rules:
- Use the toggle to the left of Rule name to select or deselect rules.
- Use the Rule severity and Source dropdown lists to filter the rules you want to select from.
- Use the Search bar to search for specific rules.
To quickly select one or more known rules and dismiss others, first deselect all rules by turning off the Rule name toggle, then search for your target rule names and select each individually by turning its toggle on.
-
Review the field mappings. Field mappings allow the system to accurately pass event data from the log to the detector and then use the data to trigger alerts. For more information about field mappings, refer to the A note on field mappings section.
-
Choose whether to enable threat intelligence feeds. Threat intelligence feeds only work with standard log types.
-
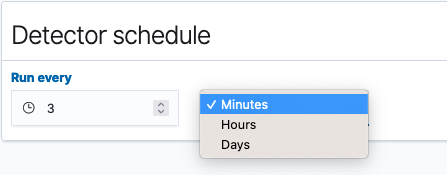
In the Detector schedule section, create a schedule for how often to run the detector. Specify a unit of time and a corresponding number to set the interval. The following image shows that the detector runs every 3 minutes.
-
Select Next. The Set up alerts page appears and displays settings for an alert trigger.
Step 2. Set up alerts
The second step in creating a detector involves setting up alerts. Alerts are configured to create triggers that, when matched with a set of detection rule criteria, send notifications of possible security events. You can select rule names, rule severity, and tags in any combination to define a trigger. Once a trigger is defined, the alert setup lets you choose the channel on which to be notified and provides options for customizing a message for the notification.
At least one alert condition is required before a detector can begin generating findings.
You can also configure alerts from the Findings window. To see how to set up alerts from the Findings window, see The findings list. A final option for adding additional alerts is to edit a detector and navigate to the Alert triggers tab, where you can edit existing alerts as well as add new ones. For details, see Editing a detector.
To set up an alert for a detector, continue with the following steps:
- In the Trigger name box, optionally enter a name for the trigger or edit the default name.
-
To define rule matches for the alert, select security rules, severity levels, and tags.
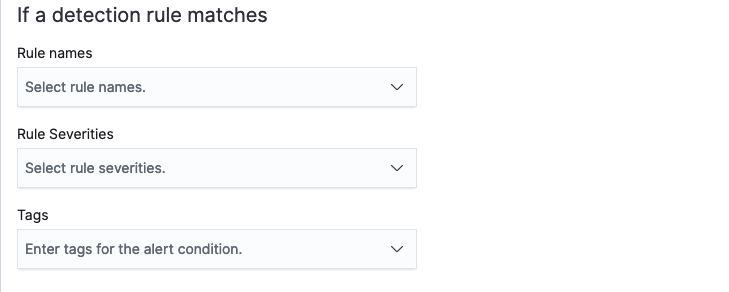
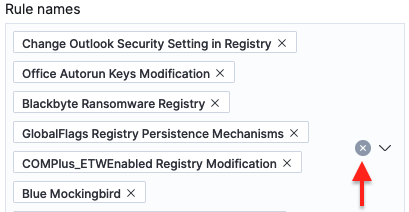
- Select one rule or multiple rules that will trigger the alert. Put the cursor in the Rule names box and type a name to search for it. To remove a rule name, select the X beside the name. To remove all rule names, select the X beside the dropdown list’s down arrow.
- Select one or more rule severity levels as conditions for the alert.
- Select from a list of tags to include as conditions for the alert.
-
To define a notification for the alert, assign an alert severity, select a channel for the notification, and customize a message generated for the alert.
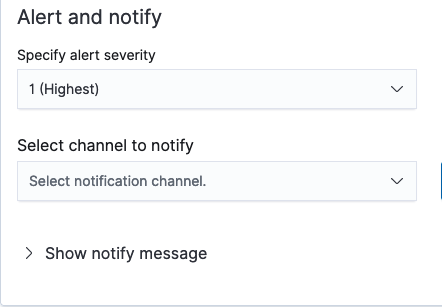
- Assign a level of severity for the alert to give the recipient an indication of its urgency.
- Select a channel for the notification from the Select channel to notify dropdown list. Examples include Slack, Chime, or email. To create a new channel, select the Manage channels link to the right of the field. The Channels page for Notifications opens in a new tab where you can edit and create new channels. For more information about notifications, see the Notifications documentation.
- Expand Show notify message to show message preferences. The message subject and message body are populated with details about the current alert configuration. You can edit these text fields to customize the message. Beneath the message body text box, you can select Generate message to populate more details in the message, such as rule names, rule severity levels, and rule tags.
- Select Add another alert trigger to configure an additional alert.
- After configuring the conditions in the preceding fields, select Create detector in the lower-right corner of the screen.
Integrated Alerting plugin workflows
By default, when you create a threat detector, the system automatically creates a composite monitor and triggers workflows for the Alerting plugin. The detector’s rules are converted into search queries for the Alerting plugin monitor, and the monitor executes its queries according to a schedule derived from the detector’s configuration.
You can change the behavior of automatically generated composite monitors by enabling or disabling the workflow functionality with the plugins.security_analytics.enable_workflow_usage setting. This setting is defined using the Cluster settings API.
For more information about composite monitors and their workflows, see Composite monitors.
Automatically mapped fields
Once you select a data source and log type, the system attempts to automatically map fields between the log and rule fields. Switch to the Mapped fields tab to show the list of these mappings. When the field names are similar to one another, the system can successfully match the two, as shown in the following image.
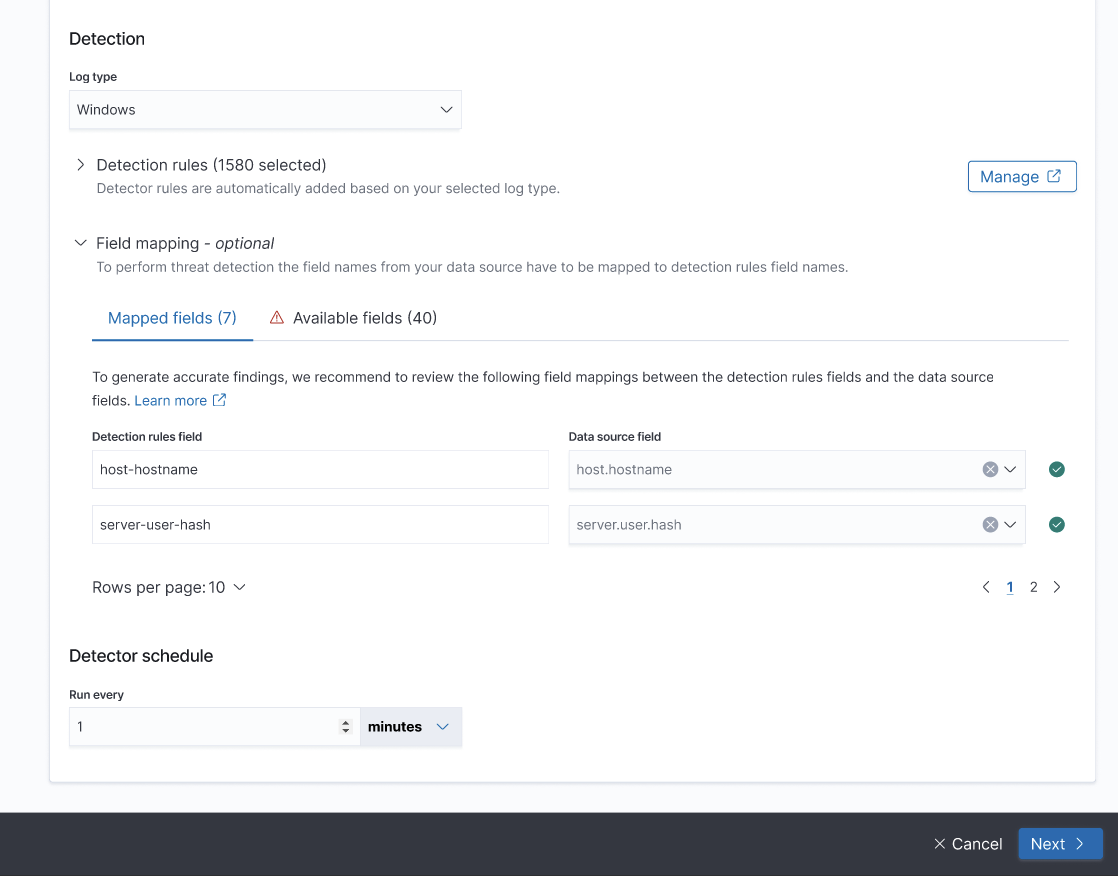
Although these automatic matches are normally dependable, it’s still a good idea to review the mappings in the Mapped fields table and verify that they are correct and matched as expected. If you find a mapping that doesn’t appear to be accurate, you can use the dropdown list to search for and select the correct field name. For more information about matching field names, see the following section.
For more information about field mappings, refer to the About field mappings section within the Working with log types documentation.
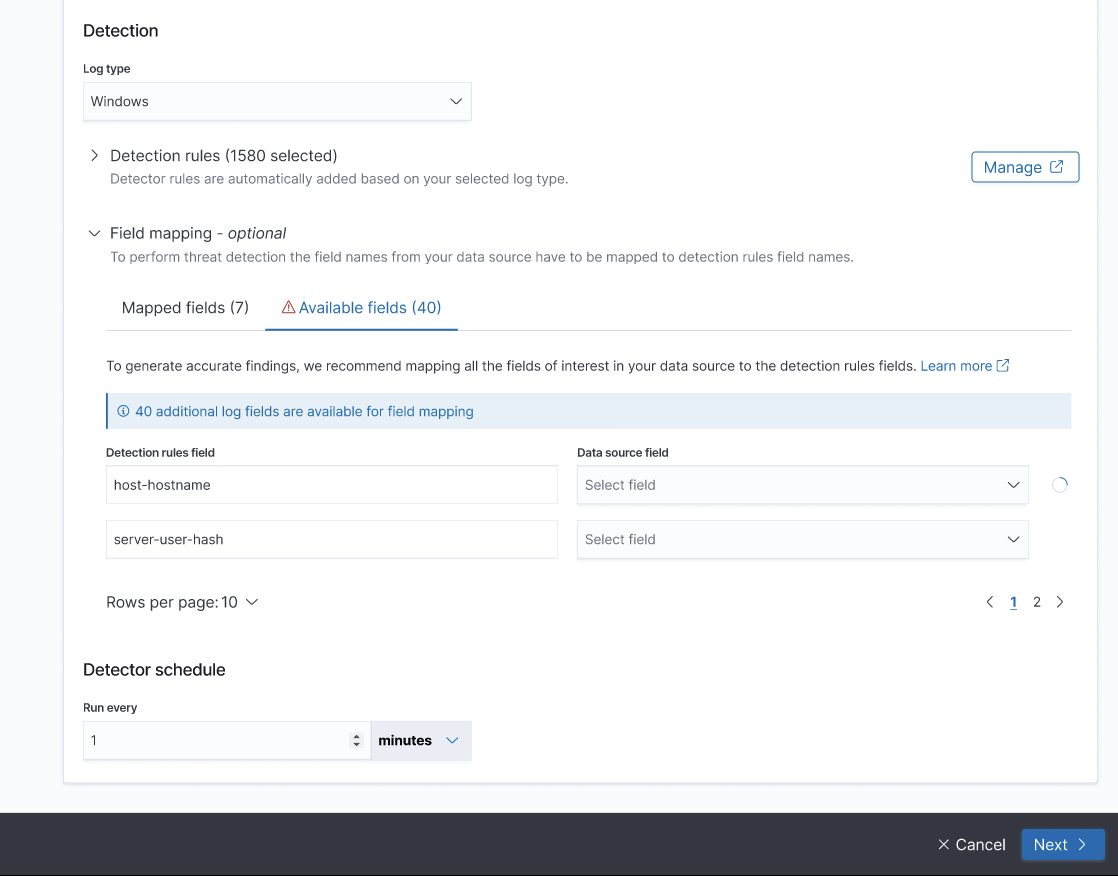
Available fields
The field names that are not automatically mapped appear in the Available fields table. In this table you can manually map detection rule fields to data source fields, as shown in the following image.
While mapping fields, consider the following:
- The Detection rule field column lists field names based on all of the prepackaged rules associated with the selected log type.
- The Data source field column includes a dropdown list for each of the detector fields. Each dropdown list contains field names extracted from the log index.
-
To map a detector field name to a log source field name, use the dropdown arrow to open the list of log source fields and select the log field name from the list. To search for names in the log field list, enter text in the Select a data source field box.
- Once the log source field name is selected and mapped to the detector field name, the icon in the Status column to the right changes from the alert icon to a check mark.
- Make as many matches between field names as possible to complete an accurate mapping for the detector and log source fields.
A note on field names
If you choose to perform manual field mapping, you should be familiar with the field names in the log index and have an understanding of the data contained in those fields. If you have an understanding of the log source fields in the index, the mapping is typically a straightforward process.
Security Analytics takes advantage of prepackaged Sigma rules for security event detection. Therefore, the field names are derived from a Sigma rule field standard. To make them more identifiable, aliases for the Sigma rule fields have been created based on the following specifications:
- For all log types, the open-source Elastic Common Schema (ECS)
- For AWS CloudTrail and DNS log types, the Open Cybersecurity Schema Framework (OCSF)
The field names for alias rules are used in the following steps and are listed in the Detector field name column within the mapping tables.
Predefined mappings that correlate the field names from Sigma rules to those of ECS rules for all supported log types are available in the following resources:
- The Supported log types reference documentation
- The GitHub Security Analytics repository. To find the field mappings:
- Navigate to the OSMappings folder.
- Select the file for the specific log type. For example, for the
windowslog type, to view field names that correlate from Sigma rules to those of ECS rules, select thewindows_logtype.jsonfile. Theraw_fieldvalue represents the field name for the Sigma rule in the mapping.
Amazon Security Lake logs
Amazon Security Lake converts security log and event data to the OCSF format to normalize combined data and facilitate its management. OpenSearch supports ingestion of log data from Amazon Security Lake in the OCSF format. Security Analytics can automatically map fields from OCSF to ECS (the default field mapping schema).
The Amazon Security Lake log types that can be used as log sources for detector creation include AWS CloudTrail, Amazon Route 53, and VPC Flow Logs. Because Amazon Route 53 logs capture DNS activity, the log type must be specified as dns when defining a detector. Because AWS CloudTrail logs can be captured in both raw format and OCSF, you should name indexes distinctly and identifiably. This can be helpful when specifying an index name in an API associated with Security Analytics.
Supported log types are available in the following resources:
- For all log types, see the open-source ECS specification.
- For AWS CloudTrail, DNS log types, and VPC Flow Logs, see the OCSF.
The field names for alias rules are used in the following steps and are listed in the Detector field name column in the mapping tables.
Predefined mappings that correlate the field names from Sigma rules to those of ECS rules for all supported log types are available in the following resources:
-
The Supported log types reference documentation.
-
The GitHub Security Analytics repository. To find the field mappings:
- Navigate to the OSMappings folder.
- Select the file for the specific log type. For example, for the
windowslog type, to view field names that correlate from Sigma rules to those of ECS rules, select thewindows_logtype.jsonfile. Theraw_fieldvalue represents the field name for the Sigma rule in the mapping.
What’s next
If you are ready to view findings generated by the new detector, see the Working with findings section. If you would like to import rules or set up custom rules before working with findings, see the Working with detection rules section.
To configure Security Analytics to identify correlations between events happening in different logs throughout your system, see Working with correlation rules.