This post was imported from the Open Distro For Elasticsearch blog, a predecessor project of OpenSearch. Information reflected in this post may not be current or accurate.
We are excited to release the real-time Root Cause Analysis engine for Elasticsearch in Open Distro for Elasticsearch version 1.9.0. The RCA engine enables operators to diagnose and identify bottlenecks in their Elasticsearch clusters. This is a value-add feature on top of the current array of low-level metrics they have access to with Performance Analyzer. Operators can leverage the RCA to tune the relevant Elasticsearch settings and adjust the workloads to ensure cluster stability and performance. In this blog, we dive into some aspects of the RCA engine and how it can be leveraged for Elasticsearch cluster diagnosis.
Introduction
Elasticsearch can be difficult to manage, especially at scale. We released Performance Analyzer to provide deep visibility into Elasticsearch shards, nodes, storage and network resources to quantify resource health and usage (starvation, overuse and contention). However, operators are required to have deep insights into Elasticsearch to debug and identify the root cause once things start to go sideways. The RCA engine is incredibly useful for reducing the operational burden of Elasticsearch clusters. Several mission-critical systems and applications rely on Elasticsearch and when the cluster experiences performance or stability issues, it is critical to get it back on track as quickly as possible. RCA engine helps operators transition immediately from being alerted about an issue to executing remediation actions. RCA uses the metrics emitted by the Performance Analyzer to infer and pinpoint performance and reliability problems in the database and the underlying infrastructure layers. RCAs are designed to diagnose the problems, with accuracy (precision and recall), and in the shortest time possible for that accuracy level.
Let’s examine a use case on how RCA engine can be utilized. Imagine you are managing a 3 node Elasticsearch cluster (nodes A, B, and C) containing indexes without any replicas. The cluster health appears GREEN, but every few minutes, the query rejection rate spikes up. While investigating this issue, you notice that all the data for the rejected queries resides on node B. Using Performance Analyzer metrics, you notice that the JVM memory pressure and CPU utilization metrics coming from Node B follows a sawtooth pattern.
These metrics line up with the query rejections you noticed, great! While you’ve made progress on your investigation, you still don’t know the root cause of this behavior. Is it the CPU or the memory? How can you fix the issue? At this point, you might be tempted to simply restart the Elasticsearch node. When you restart your node, the spiky behavior stops! Everything seems to go back to normal until you get paged a few minutes later with the exact same issue. Time for more investigation now …
This investigation process can be tiring and may breach your service SLAs. This is where the RCA engine comes in handy and helps alleviate the burden involved in debugging Elasticsearch issues. Let’s examine how we could investigate the exact same issue with the help of the RCA engine.
- We notice something is wrong so we issue a general RCA query to our elected master node A
curl <master node>:9600/_opendistro/_performanceanalyzer/rca -XGET- Most of our resources look healthy, but the HighHeapUsageClusterRca is in an unhealthy state. So we drill down into that specific RCA using
curl <master node>:9600/_opendistro/_performanceanalyzer/rca?name=HighHeapUsageClusterRca -XGET- Look at the RCA response, see if anything stands out to you:
  {
    "HighHeapUsageClusterRca": [
        {
            "rca_name": "HighHeapUsageClusterRca",
            "state": "unhealthy",
            "timestamp": 1587426650942,
            "HotClusterSummary": [
                {
                    "number_of_nodes": 2,
                    "number_of_unhealthy_nodes": 1,
                    "HotNodeSummary": [
                        {
                            "host_address": "192.168.0.X",
                            "node_id": "JtlEoRowSI6iNpzpjlbp_Q",
                            "HotResourceSummary": [
                                {
                                    "resource_type": "young gen",
                                    "unit_type": "promotion rate in mb/s",
                                    "threshold": 400,
                                    "value": 500,
                                    ...
                                }
                            ]
                        }
                    ]
                }
            ]
        }
    ]
}- Notice that while your acceptable young garbage collection (GC) promotion rate is 400 MB/s, the actual rate on node B is 500 MB/s. You can conclude that this young generation promotion rate is the most likely candidate for your cluster’s spiky, degraded performance. When objects are quickly promoted from the young generation, they start to fill up the old generation (or tenured space) of the JVM heap. Once the tenured space becomes full, an expensive event called Major GC takes place. When this occurs, the JVM stops executing instructions until the garbage collection completes. This garbage collection operation can be CPU intensive as well. The solution to this problem can be a simple change to the young generation size by altering
-XX:NewSize, -XX:MaxNewSize and -XX:SurvivorRatioparameters of the Elasticsearch process.
RCA particularly shines at scale. Imagine the same problem discussed above in a larger, 100 node multi-tenant production cluster. Manual diagnosis of the issue is like finding a needle in a haystack, but isolating the problem using RCA follows the same basic steps: issue a query to the master, read the output, and take appropriate actions. RCA framework is powerful, lightweight and highly extensible that enables you to write your own RCAs for the resources or combination of resources that are important for your particular cluster. We plan to release a series of blogs with the RCAs that you can leverage and reduce the mean time to repair (MTTR) your cluster.
RCA Framework System Design
We define a root cause as a function of one or more symptoms and/or one or more RCAs and metric(s). A symptom is an operation applied to one or more metrics and/or other symptoms. Root causes may also be a function of other root causes. The following equations show an example of these relationships
// A resource state is a function of one or many metrics and theresholds. The
// function over the metrics and threshold is the evaluation function.
resource_state = f(metric1, threshold1)

// An rca is a function of one or many resource states and other metrics and some
// other RCAs. Not all of them are required.
rca = g(resource_state, metric2, threshold2, rca1)
The RCA framework is modeled as a distributed data-flow graph (see Fig 1) where data flows downstream from the leaf nodes to the root. Leaf nodes of the graph represent Performance Analyzer metrics on which intermediate computations are performed. The intermediate nodes can be RCAs or other derived symptoms which helps in computation of the final RCA(s). The framework operates on a single analysis graph which is composed of multiple connected-components.
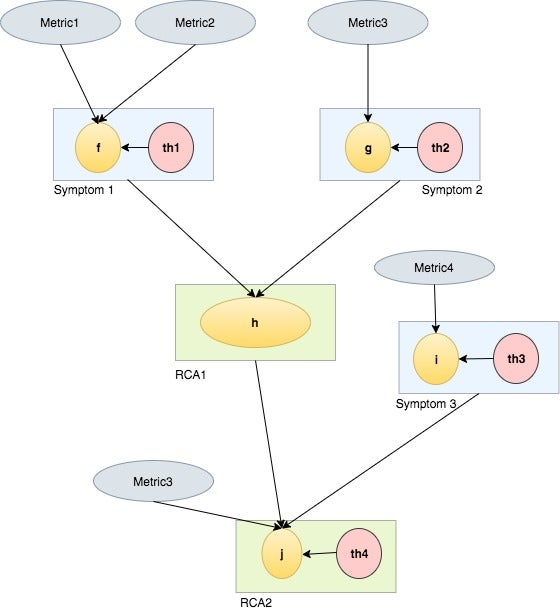
- Fig 1: A multi-level RCA graph composed of metrics and thresholds
Execution of an RCA is the evaluation of the data-flow graph on the physical nodes of the cluster (Fig 2). We evaluate the RCA directed acyclic graph (DAG) in a particular order such that all the data for the RCA is available when it is being evaluated. Nodes in the cluster can also communicate among themselves to share the output of graph evaluations. For simplicity, we let only the currently active master node listen to the output emitted by other data nodes.
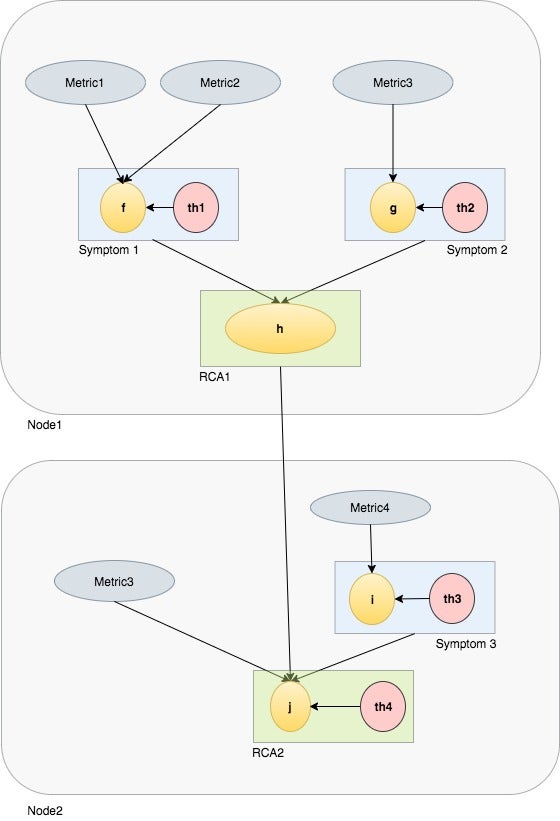
- Fig 2: Execution model of RCA graph across Elasticsearch nodes
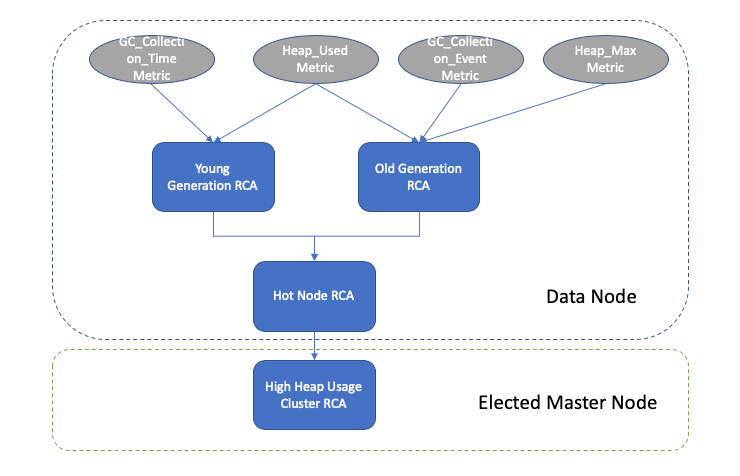
RCA to diagnose high heap usage
Most Elasticsearch clusters perform reasonably well when they are configured with the right JVM heap pressure with right configuration settings. However, the heap pressure in Elasticsearch could shoot up for a variety of reasons such as organic growth in traffic, spike in customer requests, rogue queries etc. We’ve leveraged the RCA framework and created two JVM RCAs to help you identify and diagnose heap pressure issues. Out of the box, you’ll get access to the HighHeapUsageClusterRca, which diagnose old and young generation issues in the JVM garbage collector. By querying the RCA API, you’ll be able to quickly identify if your GC is unhealthy and which consumers (fielddata cache/request cache, Lucene segment memories, etc.) are consuming the most memory.
API Usage
Use the API below on the elected master node to get a cluster level view of the JVM RCA output.
curl --url "localhost:9600/_opendistro/_performanceanalyzer/rca?name=HighHeapUsageClusterRca" -XGET
Sample RCA response from above API
{
    "HighHeapUsageClusterRca": [
        {
            "rca_name": "HighHeapUsageClusterRca",
            "state": "unhealthy",
            "timestamp": 1587426650942,
            "HotClusterSummary": [
                {
                    "number_of_nodes": 3,
                    "number_of_unhealthy_nodes": 2,
                    "HotNodeSummary": [
                        {
                            "host_address": "192.168.144.X",
                            "node_id": "JtlEoRowSI6iNpzpjlbp_Q",
                            "HotResourceSummary": [
                                {
                                    "resource_type": "old gen",
                                    "threshold": 0.65,
                                    "value": 0.81827232588145373,
                                    "avg": NaN,
                                    "max": NaN,
                                    "min": NaN,
                                    "unit_type": "heap usage in percentage",
                                    "time_period_seconds": 600,
                                    "TopConsumerSummary": [
                                        {
                                            "name": "CACHE_FIELDDATA_SIZE",
                                            "value": 5907025640
                                        },
                                        {
                                            "name": "CACHE_REQUEST_SIZE",
                                            "value": 28375
                                        },
                                        {
                                            "name": "CACHE_QUERY_SIZE",
                                            "value": 12687
                                        }
                                    ],
                                }
                            ]
                        },
                        {
                            "host_address": "192.168.144.Y",
                            "node_id": "v2gdRXDFQHioIULQ5vn_7A",
                            "HotResourceSummary": [
                                {
                                    "resource_type": "young gen",
                                    "threshold": 400.0,
                                    "value": 512.8,
                                    "avg": NaN,
                                    "max": NaN,
                                    "min": NaN,
                                    "unit_type": "promotion rate in mb/s",
                                    "time_period_seconds": 600,
                                }
                            ]
                        }
                    ]
                }
            ]
        }
    ]
}
The JVM RCA API response returns a list of nodes in the cluster that are marked unhealthy. Each unhealthy node is augmented with a nested list of unhealthy JVM resources. From the list resource summaries, we can quickly identify the root cause of the JVM issue. i.e. whether the heap contention is from the old generation or the young generation of the JVM heap and the resource metrics that breach the set thresholds.
In the sample response above, two out of three nodes in the cluster are under JVM pressure and one node has old generation contention while the other has young generation issue. Let’s assume that we set the GC parameter XX:CMSInitiatingOccupancyFraction to 75 when we start the ES process. This setting means that Major GC will kick in once heap usage is above 75%. However, from the sample response, node with ip address “192.168.144.X” which is experiencing old generation contention has 81% occupancy even after a Major GC. This points to the fact that a huge chunk of old generation heap is occupied by long lived objects that can not be garbage collected. So our next question is what are those long lived objects? Luckily the TopConsumer field in this json output provides us that information and fielddata cache is the top consumer (5.9GB). So the easiest way to mitigate this issue is to clear the fielddata cache and set limits for the fielddata cache to say, 40% of node heap space to improve the cluster stability.
Conclusion
The new RCA engine enables you to quickly diagnose performance bottlenecks in your Elasticsearch cluster in an automated fashion. It leverages deep metric insights provided by Performance Analyzer to isolate the root cause. We plan to add RCAs for other commonly encountered bottlenecks in Elasticsearch clusters and a decision maker framework that collates RCA outputs and provides unified recommendations in the future.
We encourage you to try out this solution on Open Distro for Elasticsearch and provide your valuable feedback to our engineering team at https://github.com/opendistro-for-elasticsearch/performance-analyzer-rca. We also invite you to contribute to this feature. Check out the contribution guidelines here to get more involved in the project.