The OpenSearch Anomaly Detection plugin is powered by the Random Cut Forest (RCF) algorithm. Although RCF is a powerful algorithm, false alarms reduce its practical value because users must spend time verifying and dismissing the alarms. To address this issue, in OpenSearch 2.17, The Anomaly Detection team has introduced four major enhancements to RCF, significantly reducing false positives. In this blog post, we’ll explore four major algorithmic improvements to OpenSearch’s RCF algorithm that have resulted in a 94.3% reduction in false positives while maintaining high detection accuracy, demonstrate these improvements through real-world case studies, and provide a detailed comparison with previous OpenSearch versions.
RCF limitations
The following sections address limitations of the RCF algorithm.
Recurring periodic spikes
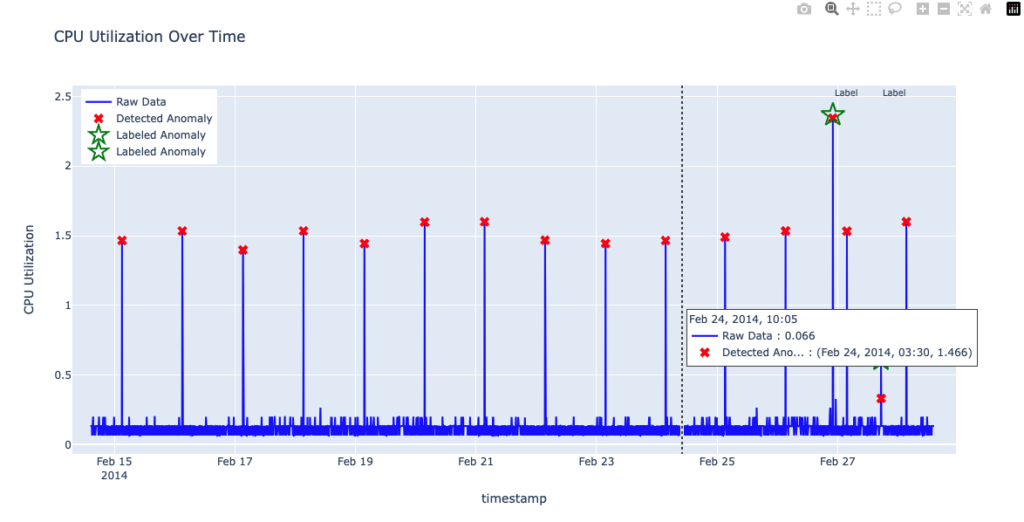
Detecting anomalies in data with strong daily or weekly patterns can be challenging. RCF struggles to filter out regularly occurring spikes, flagging these normal, repeating events as anomalies, as shown in the following figure.
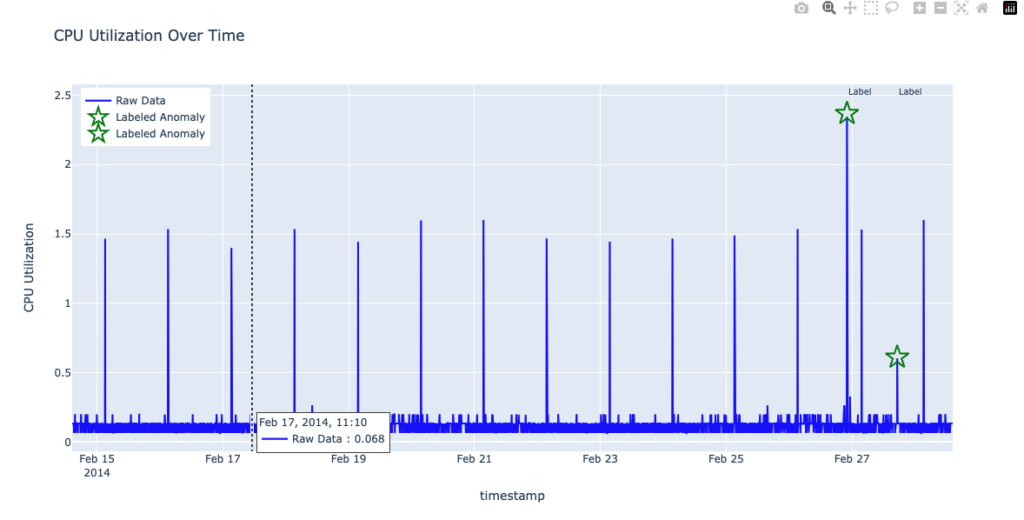
A natural approach to capturing seasonal behavior is to increase the shingle size so that the model observes a full cycle—in this dataset, a day. Because data was collected every 5 minutes, 1 day corresponds to 288 data points. In the previous figure, the default shingle size of 8 (in the Anomaly Detection plugin) was used. In the following figure, the shingle size was increased to 288 in order to capture a full day of data. Although this larger shingle size helps the model learn daily patterns, it can also introduce false negatives: RCF now overlooks two genuinely anomalous spikes—one unusually large and one unusually small—as shown in the following figure.
Transition period during data drift and level shift
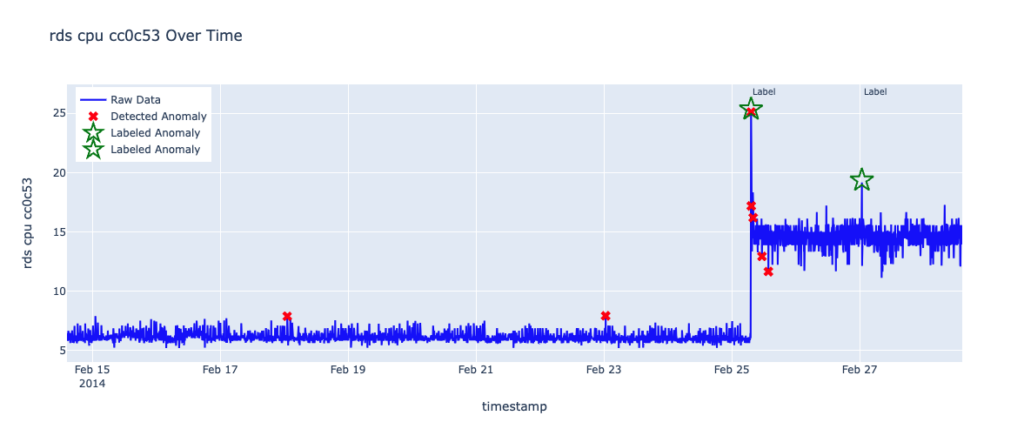
Data can exhibit gradual changes in its distribution (data drift) or sudden shifts in its baseline (level shift). Although RCF is designed to adapt to these changes through streaming and continuous learning, it still needs time to adjust. In the following figure, after a level shift occurs, RCF generates four false positives before stabilizing and accepting the new baseline.
Normal fluctuations compared to true anomalies
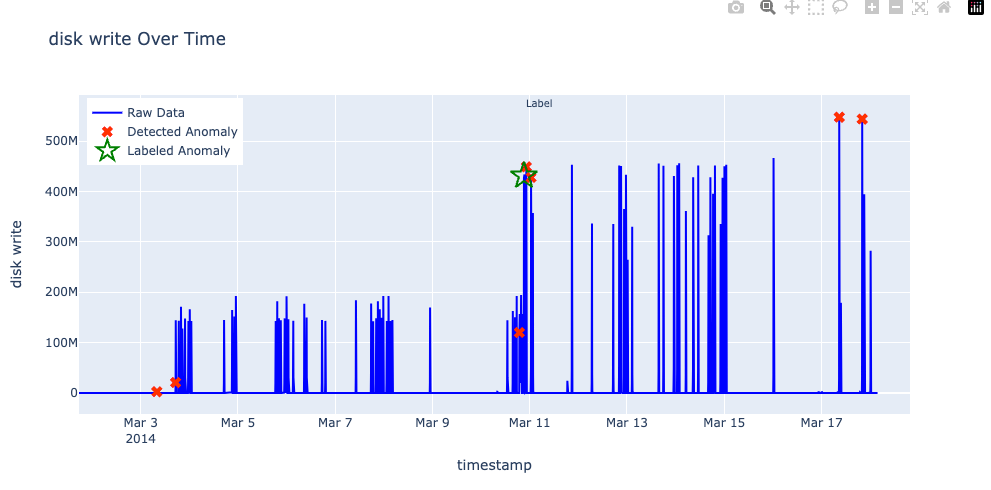
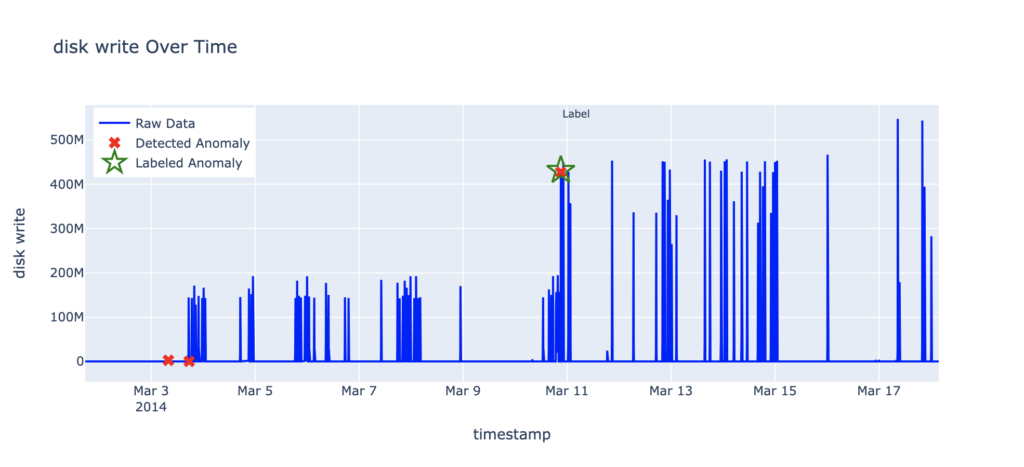
Data often exhibits regular fluctuations that should not be mistaken for true anomalies. Initially, RCF may be overly sensitive and flag these normal variations as anomalies. However, if changes remain within a typical variance range around the mean, they represent normal behavior rather than genuine anomalies. In the following figure, even though disk write spikes appear to be large around March 17–18, they fall within the expected range and thus are not actual anomalies.
Overcoming RCF limitations
OpenSearch 2.17 introduced the following improvements to the RCF algorithm in order to address the limitations described in the previous sections.
Statistical tracking of candidate anomalies
To address recurring periodic spikes, the model employs statistical tracking specifically for points that appear unusual—those with high RCF scores. Rather than updating global statistics for every data point, RCF maintains a running mean and variance (with exponential decay) for this smaller set of candidate anomalies. When a high-score event occurs, the model checks whether it resembles prior high-score observations by comparing two sets of values:
- Actual observations and their running mean: RCF verifies whether the observed data remains near its running mean within acceptable limits.
- Expected observations and their running mean: The model also examines expected (imputed) values, ensuring that they continue to cluster around their own running mean. This step helps confirm that the baseline evolves appropriately.
If both the actual and expected values remain within their updated acceptable ranges, the algorithm stops flagging them as anomalies.
Grouped alerting
To handle transitional periods during data drift or a level shift, the algorithm supports grouped alerting. When multiple unusual events occur around the same time (within one time window, or shingle), you’ll receive just one alert instead of many. This approach prevents flooding the user with redundant alerts when the system is still adapting to new conditions.
Using approximate nearest neighbors for anomaly detection
When deciding whether a candidate event is a true anomaly or merely a normal fluctuation, RCF considers approximate nearest neighbors using the following approach:
- Build an expected value vector: RCF creates a “normal” version of the queried point by replacing suspicious features with typical historical values.
- Find neighbors in each tree: RCF traverses each tree along its splitting dimensions to find a leaf node close to the expected vector. Closeness is measured using a scaling factor CC (for example, CC = 1.1), which determines the distance threshold for how far neighbors can be from the expected vector. If a sufficient number of trees (for example, at least 10%) detect neighbors within CC multiplied by the average distance, the event is considered likely to be normal.
- Determine the “safe box”: RCF also defines a “safe box” around the original point, based on factors such as recent noise levels and average deviations. If most neighbors lie within this box, the point is deemed “explainable.” If too few neighbors fall inside the box, the point is flagged as an anomaly.
Rescoring using expected value vectors
To further reduce false positives caused by minor fluctuations and during transitional periods (such as data drifts or level shifts), RCF rescales the anomaly score using an expected value vector. Essentially, it replaces potentially anomalous segments with similar historical values in order to compute a new score. If the difference between this “expected” score and the original score remains below a scaled threshold (factoring in the prior anomaly’s score and the current threshold), RCF does not raise another alert. This strategy helps avoid repeated notifications for the same anomaly.
Evaluating RCF using the Numenta Anomaly Benchmark
To test these improvements, the Anomaly Detection team evaluated RCF using labeled Amazon CloudWatch metrics from the Numenta Anomaly Benchmark (NAB). The datasets include AWS server performance metrics, such as CPU utilization, incoming network traffic (measured in bytes), and disk write activity (measured in bytes). These datasets also contain verified anomaly labels provided by Numenta, which serve as a reliable reference for identifying abnormal patterns.
Test configuration
We used the following RCF configuration for testing:
- 50 trees, each trained on 256 samples
- A shingle size of 8
- A warm-up period of 40 data points
- A constraint requiring actual values to deviate by at least 20% from expected values
These settings match the default RCF parameters in the Anomaly Detection plugin.
Furthermore, RCF assigns an anomaly grade ranging from 00 to 11 for each data point. A grade of 00 indicates a normal event, while any value above 00 represents a potential anomaly. The closer the grade is to 11, the higher the likelihood of an anomaly. In our case study, we used a threshold of 0.50.5 to filter out lower-likelihood anomalies.
Results
The following sections provide test results for various metrics.
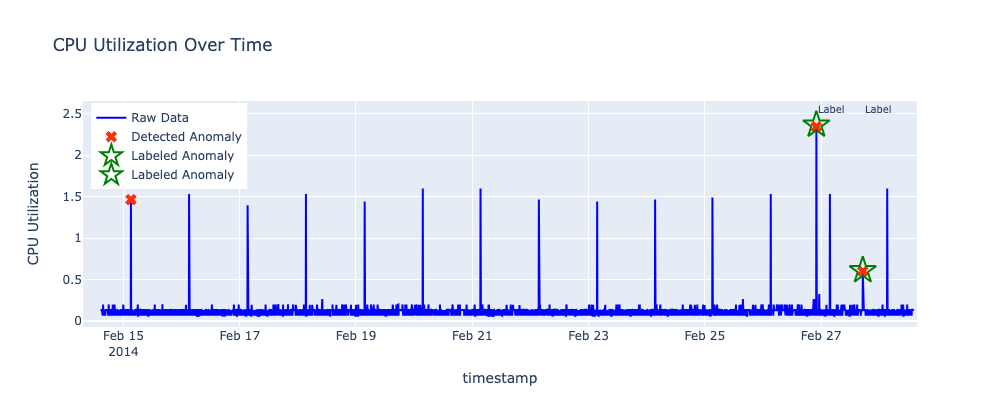
CPU utilization
- Dataset: NAB AWS
ec2_cpu_utilization_24ae8d - Total records: 4,031
- Labeled anomalies:
- 2014-02-26 22:05:00 (Detected)
- 2014-02-27 17:15:00 (Detected)
- Total RCF anomalies: 3
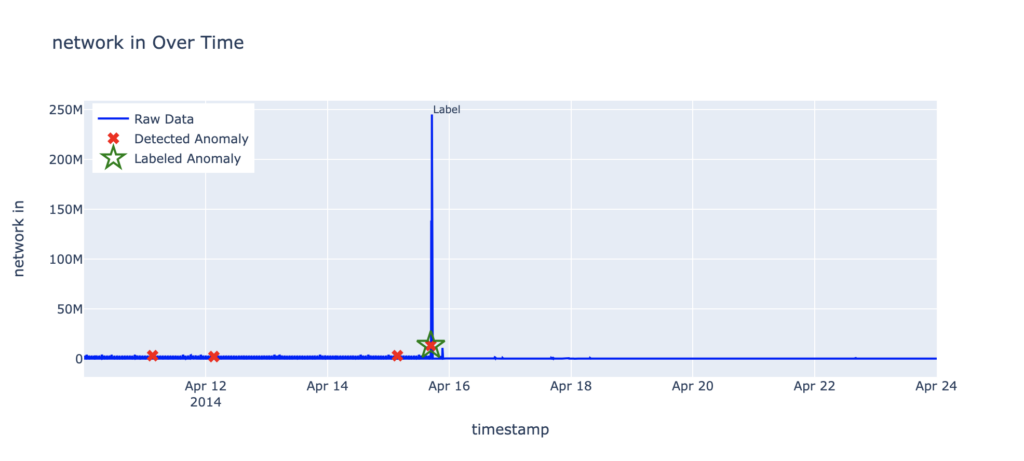
Incoming network traffic
- Dataset: NAB AWS
ec2_network_in_257a54 - Total records: 4,031
- Labeled anomalies:
- 2014-04-15 16:44:00 (Detected)
- Total RCF anomalies: 4
Disk write activity
- Dataset: NAB AWS
ec2_disk_write_bytes_1ef3de - Total records: 4,718
- Labeled anomalies:
- 2014-03-10 21:09:00 (Detected)
- Total RCF anomalies: 3
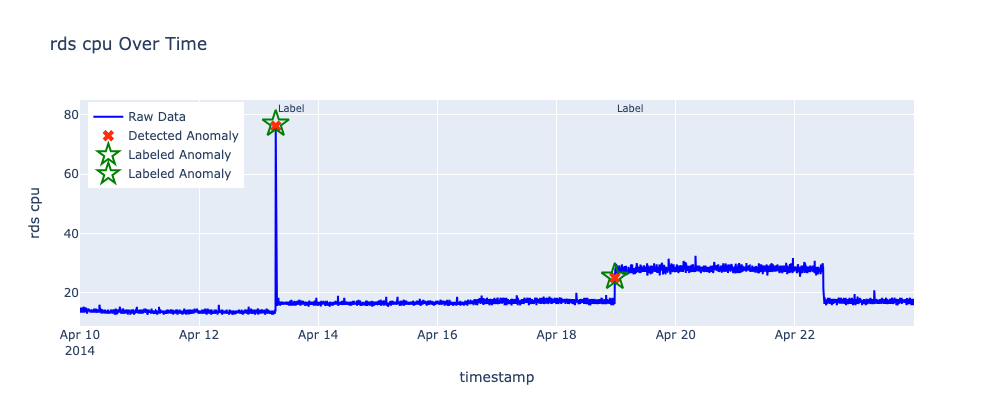
RDS CPU utilization (rds_cpu_utilization_e47b3b)
- Dataset: NAB AWS
rds_cpu_utilization_e47b3b - Total records: 4,031
- Labeled anomalies:
- 2014-04-13 06:52:00 (Detected)
- 2014-04-18 23:27:00 (Detected)
- Total RCF anomalies: 2
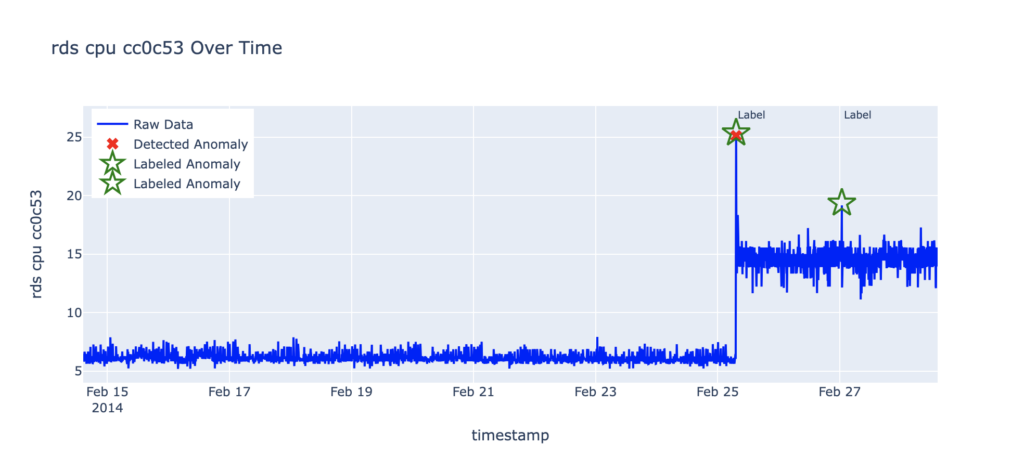
RDS CPU utilization (rds_cpu_utilization_cc0c53)
- Dataset: NAB AWS
rds_cpu_utilization_cc0c53 - Total records: 4,031
- Labeled anomalies:
- 2014-02-25 07:15:00 (Detected)
- 2014-02-27 00:50:00 (Undetected)
- Total RCF anomalies: 1
Precision and recall
Before we present the results, let’s define two key concepts in machine learning evaluation:
- Precision: The proportion of detected anomalies that are correct—of all the anomalies the algorithm detected, how many were true anomalies? High precision results in fewer mistaken identifications. For example, if the algorithm detects 10 anomalies and 8 are actually anomalies, then the precision is 8/10=0.88/10=0.8, or 8080.
- Recall: The proportion of true anomalies that are detected—of all true anomalies, how many did the algorithm detect? High recall results in fewer missed anomalies. For example, if there are 10 true anomalies and the algorithm detects 8 of them, then the recall is 8/10=0.88/10=0.8, or 8080.
Results
The following table summarizes RCF’s precision and recall performance using the NAB CloudWatch benchmarks.
| Dataset | Precision | Recall |
|---|---|---|
AWS ec2_cpu_utilization_24ae8d |
0.67 | 1 |
AWS ec2_network_in_257a54 |
0.25 | 1 |
AWS ec2_disk_write_bytes_1ef3de |
0.33 | 1 |
AWS rds_cpu_utilization_e47b3b |
1 | 1 |
AWS rds_cpu_utilization_cc0c53 |
1 | 0.5 |
Overall, RCF demonstrated strong recall, correctly detecting 7 out of 8 anomalies across the datasets. Notably, it achieved perfect recall in 4 of the 5 datasets.
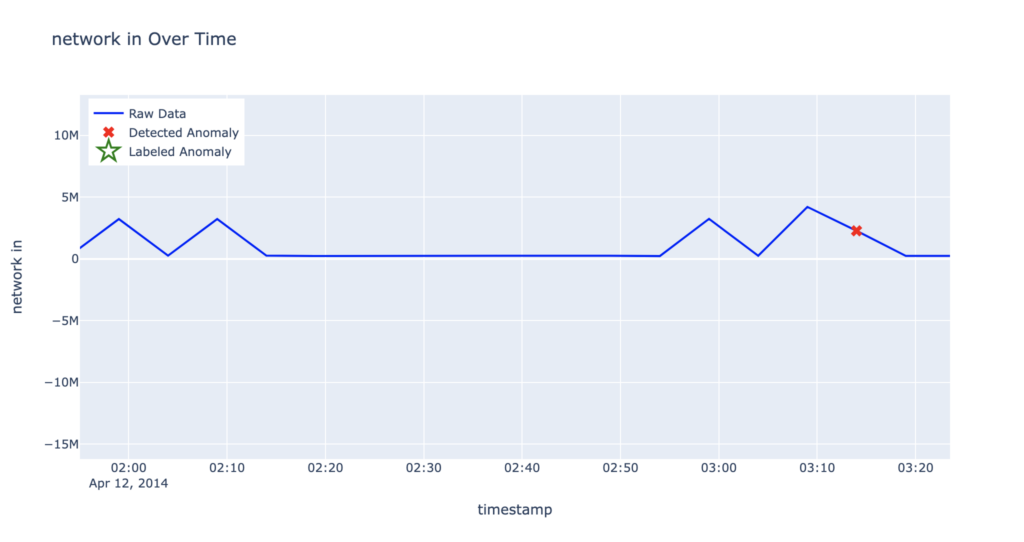
RCF also maintains high precision. Most false positives occur early in the time series, before the model has accumulated sufficient historical data to make accurate predictions. For example, in the following graph, the anomaly detected around April 12 at 3:14 for the ec2_network_in_257a54 dataset is particularly noteworthy. It deviates from the previously observed pattern of uniform double spikes. Earlier patterns show the second spike declining within approximately 5 minutes, whereas this anomalous spike exhibits an extended decline lasting around 10 minutes.
When excluding the first 20% of the dataset as a probation period, precision improves across datasets. This adjustment highlights how RCF becomes more accurate after observing enough historical data. The results of the last 80% of the dataset are summarized in the following table.
| Dataset | Precision | Recall |
|---|---|---|
| AWS ec2_cpu_utilization_24ae8d | 1 | 1 |
| AWS ec2_network_in_257a54 | 0.5 | 1 |
| AWS ec2_disk_write_bytes_1ef3de | 1 | 1 |
| AWS rds_cpu_utilization_e47b3b | 1 | 1 |
| AWS rds_cpu_utilization_cc0c53 | 1 | 0.5 |
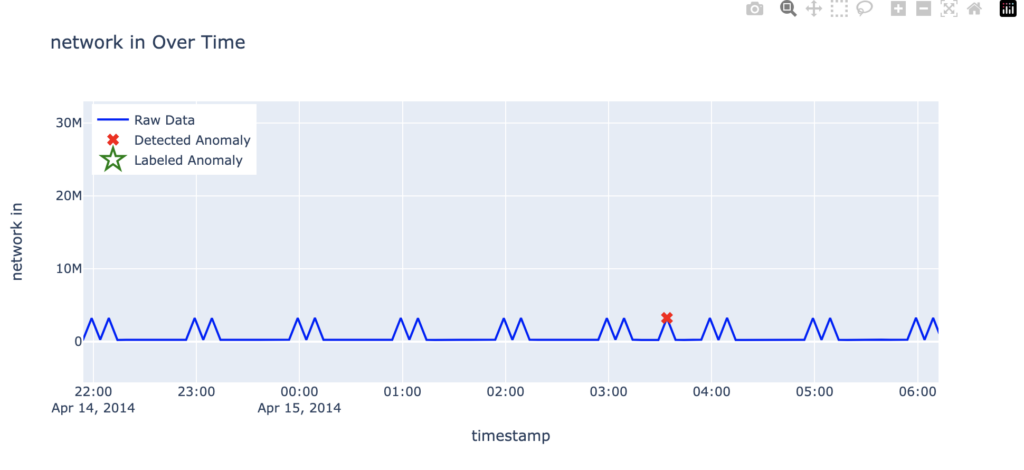
Another type of false positive occurs when detected anomalies seem valid based on the data but are in fact not labeled as anomalies. For example, in the following graph, the anomaly detected on April 15 at approximately 3:34 for the ec2_network_in_257a54 dataset deviates from the typical pattern of paired spikes. Instead of the usual two consecutive peaks, this event shows a single spike. While this represents a departure from the established pattern, it is not labeled as an anomaly.
OpenSearch 2.17 and 2.9 compared
Let’s examine how OpenSearch 2.17 has improved its anomaly detection performance relative to OpenSearch 2.9. Before we present the results, let’s define the following key concepts:
- True positive (correct detection): An true anomalous event correctly flagged as anomalous by the algorithm.
- False positive (false alarm): A non-anomalous event incorrectly flagged as anomalous by the algorithm.
- False negative (missed anomaly): An anomalous event that the system failed to flag as anomalous.
Results
The following table compares anomaly detection in OpenSearch versions 2.9 and 2.17.
| Dataset | 2.9 anomalies detected | 2.9 true positives | 2.17 anomalies detected | 2.17 true positives | Actual anomalies |
|---|---|---|---|---|---|
| AWS ec2_cpu_utilization_24ae8d | 17 | 1 | 3 | 2 | 2 |
| AWS ec2_network_in_257a54 | 33 | 1 | 4 | 1 | 1 |
| AWS ec2_disk_write_bytes_1ef3de | 16 | 1 | 3 | 1 | 1 |
| AWS rds_cpu_utilization_e47b3b | 23 | 2 | 2 | 2 | 2 |
| AWS rds_cpu_utilization_cc0c53 | 23 | 1 | 1 | 1 | 2 |
| Totals | 112 | 6 | 13 | 7 | 8 |
Discussion
Version 2.17 showed an overall reduction in false alerts and an increase in true alerts compared to version 2.9.
OpenSearch 2.9 flagged 112 anomalies, but only 6 were true anomalies, resulting in a high false positive rate. After algorithmic improvements in OpenSearch 2.17, only 13 anomalies were flagged, with 7 being true anomalies. This reflects a significant increase in precision, from 5.4% (6/112) to 53.8% (7/13), and an increase in recall from 75% (6/8) to 87.5% (7/8).
In comparison, OpenSearch 2.9 produced 106 false positives, while OpenSearch 2.17 produced just 6—representing a 94.3% reduction in false positives. This percent reduction can be calculated using the following formula:
$$
\text{Percent Reduction in FP}
= \frac{\text{Old FP} – \text{New FP}}{\text{Old FP}} \times 100\%
= \frac{106 – 6}{106} \times 100\% = 94.3\%
$$
Similarly, OpenSearch 2.9 missed 2 real anomalies, whereas OpenSearch 2.17 missed just 1—representing a 50% reduction in false negatives, computed as follows:
$$
\text{Percent Reduction in FN}
= \frac{\text{Old FN} – \text{New FN}}{\text{Old FN}} \times 100\%
= \frac{2 – 1}{2} \times 100\% = 50\%
$$
Overall, OpenSearch 2.17 significantly decreased both false positives and false negatives compared to version 2.9.
Conclusions
The enhancements to the RCF algorithm in OpenSearch 2.17 significantly improve anomaly detection by reducing false positives. Key improvements include tracking the history of candidate anomalies, implementing grouped alerting, suppressing redundant signals with nearest neighbors, and refining scores through expected value comparisons. These updates help address real-world challenges like periodic spikes while maintaining high recall. Empirical tests using the NAB CloudWatch benchmarks demonstrate their effectiveness, with a 94.3% reduction in false positives and a 50% reduction in false negatives.