
Automatically determine your OpenSearch cluster’s throughput limits—no guesswork required
“How much traffic can my cluster really handle?” is a question many OpenSearch users face before moving to production. Until now, finding your cluster’s redline—the point beyond which it can no longer maintain acceptable service levels—required trial and error, guesswork, or time-consuming manual tuning.
With redline testing in OpenSearch Benchmark, you can now dynamically scale client load based on real-time cluster performance to automatically identify your cluster’s throughput ceiling.
The challenge of guessing thresholds
OpenSearch Benchmark recently introduced support for ramping up clients and throughput during a benchmark run. However, users still needed to perform the following actions when benchmarking:
-
Estimate what amount of load would break the cluster.
-
Convert the estimate to the appropriate number of client threads and the desired target throughput.
-
Manually monitor for failures in the OpenSearch Benchmark logs or cluster dashboards. OpenSearch Benchmark recently added support for ramping up clients and throughput during a benchmark run. However, users still had to complete several manual steps when benchmarking:
-
Estimate the amount of load that could break the cluster, and then convert that estimate into the appropriate number of client threads and target throughput.
-
Monitor the benchmark logs or cluster dashboard for failures and adjust the load estimate based on the number of errors—raising it if no failures occurred or lowering it if a significant number were encountered.
-
Rerun the benchmark with different parameters and loads until the maximum sustainable threshold for the workload is reached.
-
Iterate until the breaking point and maximum steady-state workload intensities are identified.
These time-consuming tasks made it difficult to pinpoint the maximum sustainable throughput.
What we built: Redline testing
Redline testing automates the following:
- A control module to monitor request throughput and failures in real time.
- A self-adjusting load mechanism to pause or unpause clients based on observed behavior.
This enables OpenSearch Benchmark to perform the following actions:
- Ramp up active clients.
- Detect when failures begin.
- Scale back automatically, wait for recovery, and resume testing.
The result: OpenSearch Benchmark can now determine your cluster’s redline point in a single test run.
How it works
The following diagram provides a high-level overview of the actor-based execution flow in OpenSearch Benchmark. It illustrates how benchmark tasks are allocated and executed across multiple worker actors, each of which manages a group of clients responsible for sending requests to a target OpenSearch cluster, using the following components:
- BenchmarkActor: Initiates the benchmarking process.
- WorkerCoordinatorActor: Manages worker lifecycle and task distribution using an allocation matrix from the Allocator.
- Workers (Worker1 through WorkerN): Executes tasks by managing clients through the AsyncIoAdapter.
- Clients (Client1 through ClientN): Uses the
AsyncExecutorclass to perform operations against the target host in parallel.
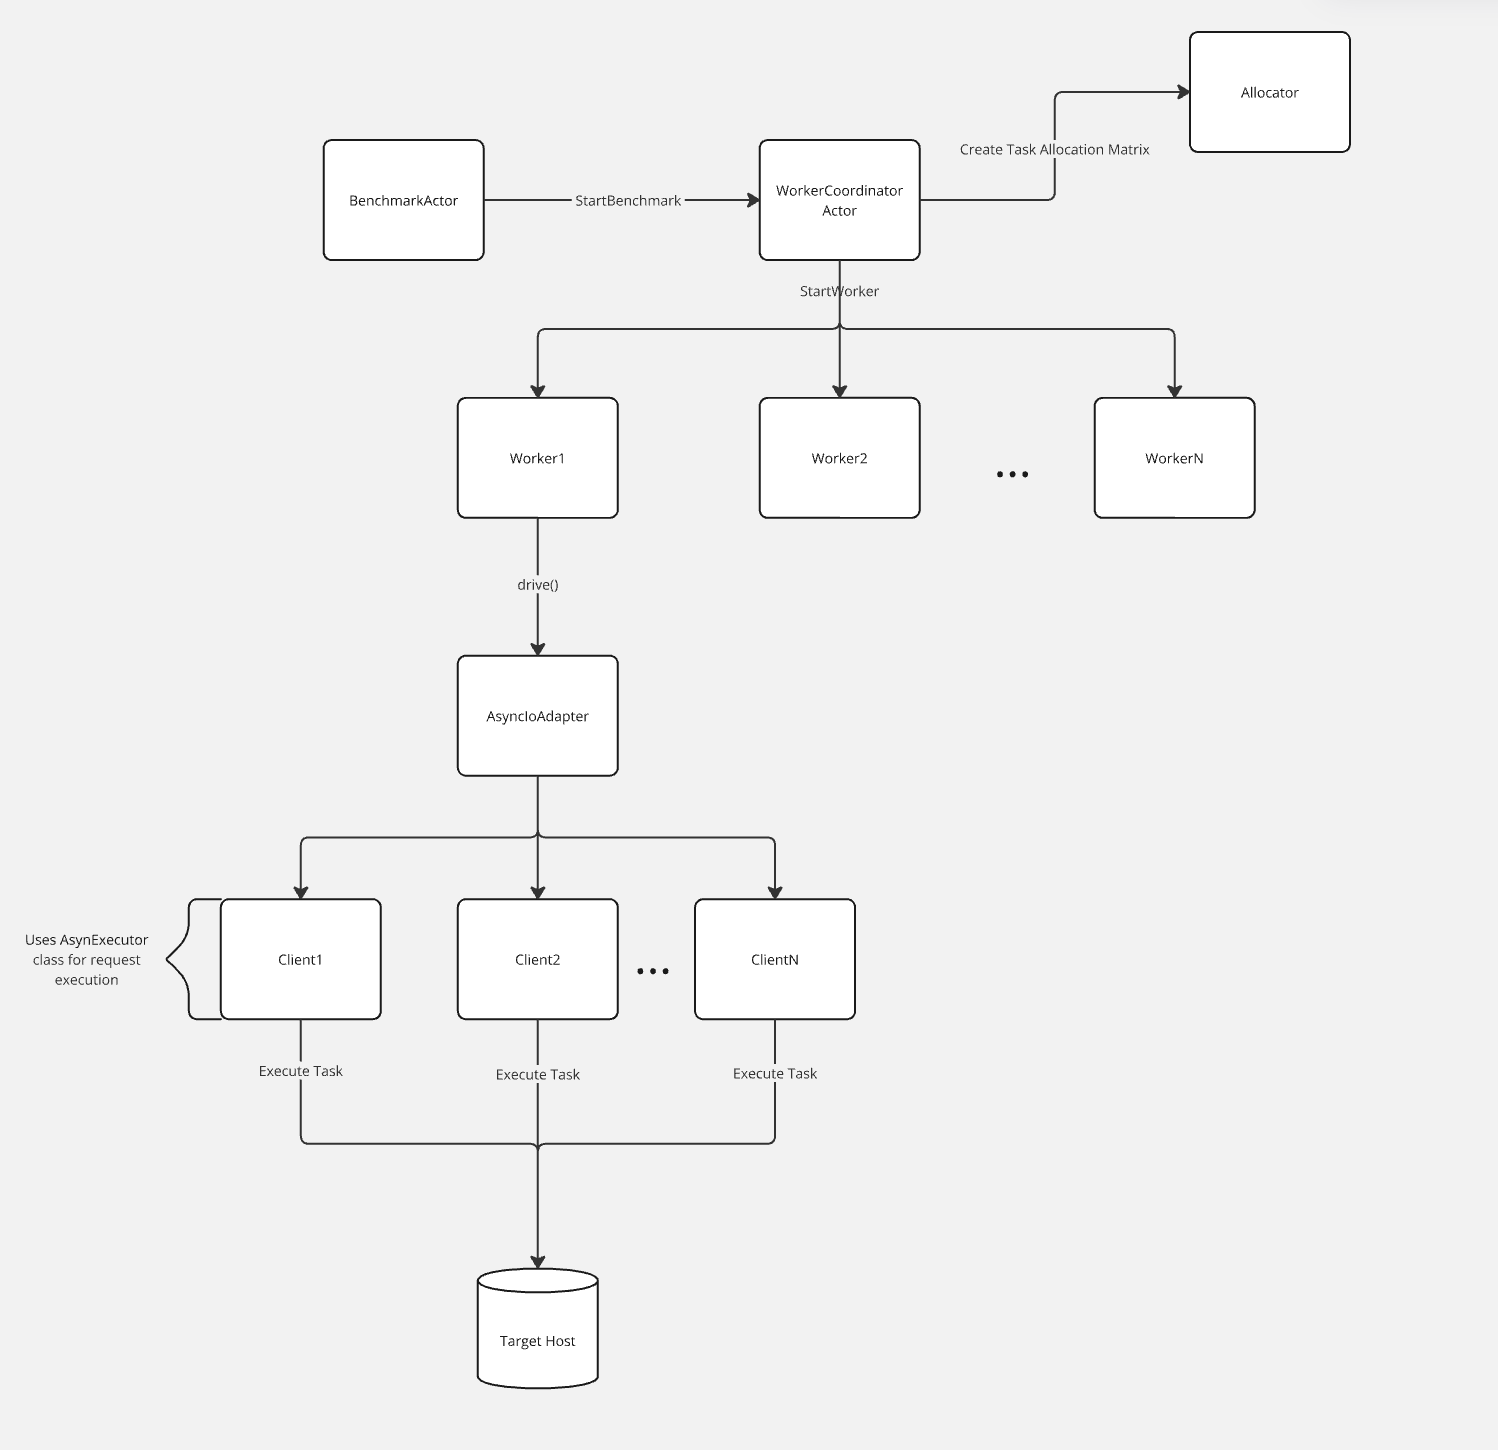
OpenSearch Benchmark uses the Actor Model, which structures concurrent, distributed systems around isolated, message-passing components.
Normally, OpenSearch Benchmark starts with a fixed number of clients, each sending requests at a constant rate for the duration of the test. With the new ramp-up feature, the tool can automatically adjust the number of clients during the test—adding clients to increase load or removing them to decrease it.
This allows you to observe how your OpenSearch cluster responds to changing load pressure, rather than a single fixed level, resulting in a more realistic and flexible benchmark that reflects real-world traffic patterns.
Timed mode and redline logic
OpenSearch Benchmark supports the following two modes for redline testing:
- Iteration mode: Runs tasks for a fixed number of iterations
- Timed mode: Runs tasks for a fixed duration
Redline testing operates only in the timed mode. It performs the following actions:
- Ramp up client load until errors occur.
- Scale down in response to failures.
- Wait for recovery and ramp up again.
How the feedback component manages clients
During a redline test, a feedback actor monitors the test for errors in real time. It tracks each worker and their associated clients, marking their status as either running or paused.
When the system is healthy, clients remain in the running state and continue sending requests.
If failures begin to accumulate, the feedback actor can pause individual clients to reduce pressure on the system.
Once stability is restored, the paused clients return to the running state.
This approach allows the benchmark to automatically throttle parts of the load when issues arise and ramp them back up when conditions improve—providing a more realistic view of how your cluster handles intermittent problems.
For more technical details, see the RFC on redline testing.
Run a workload in redline testing mode
You can get started with redline testing by creating a timed test procedure that defines the duration, target throughput, and number of clients. Once configured, you can run the benchmark with a single command—and optionally customize the maximum number of clients to match your cluster’s capacity.
Create a timed test procedure using settings similar to the following:
{
  "name": "timed-mode-test-procedure",
  "schedule": [
    {
      "operation": "keyword-terms",
      "warmup-time-period": {{ warmup_time | default(300) | tojson }},
      "time-period": {{ time_period | default(900) | tojson }},
      "target-throughput": {{ target_throughput | default(20) | tojson }},
      "clients": {{ search_clients | default(20) }}
    }
  ]
}
You can modify the default parameter values to match your workload.
Once you have a test procedure ready, you can run the benchmark test with the following command:
opensearch-benchmark execute-test \
  --pipeline=benchmark-only \
  --target-hosts=<your-opensearch-cluster> \
  --workload=<workload> \
  --test-procedure=<your-timed-mode-test-procedure> \
  --redline-test
Users can customize redline test parameters—such as the maximum number of clients, the client ramp-up rate, the percentage of clients to pause during backoff, and the amount of time to wait before resuming scale-up—using the following flags:
--redline-scale-step: Specifies the number of clients to unpause in each scaling iteration (integer value). --redline-scaledown-percentage: Specifies the percentage of clients to pause when an error occurs (float value).
--redline-post-scaledown-sleep: Specifies the number of seconds the feedback actor waits before initiating a scale-up after scaling down (integer value).--redline-max-clients: Specifies the maximum number of clients allowed during redline testing. If unset, OpenSearch Benchmark defaults to the number of clients defined in the test procedure (integer value).
OpenSearch Benchmark captures the following log information:
- During the test:
- The current number of clients
- The pause/unpause events
- The reasons for scaling back
- After the test:
- The maximum number of clients reached
- A summary of test result metrics, such as service time, throughput, and latency
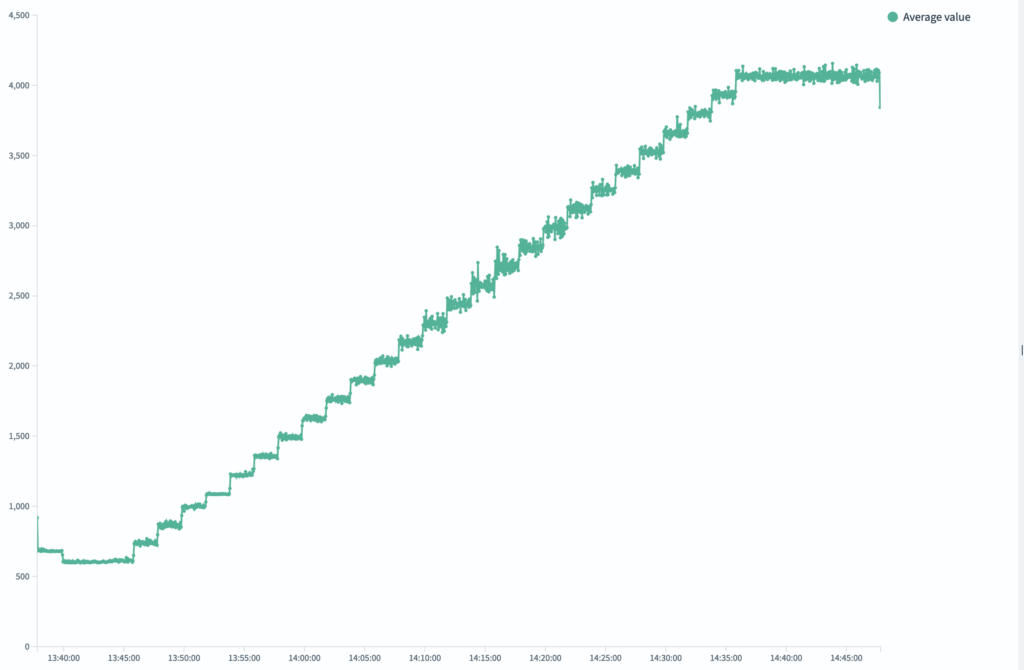
The following chart shows how redline testing in OpenSearch Benchmark incrementally increases client load during a timed test. Each step represents a controlled ramp-up, allowing the system to observe when performance begins to degrade. In the following example image, throughput steadily rises until it plateaus—indicating that the cluster’s redline has been reached. This automated feedback loop removes guesswork and enables precise load testing in a single run.
What’s next?
Upcoming improvements to redline testing may include:
- Smarter ramp-up strategies, such as binary or exponential search.
- Scaling based on latency or service time, not just request failures.
Redline testing is now available in OpenSearch Benchmark. We hope you find this feature useful and welcome your feedback on the OpenSearch forum or at the upcoming OpenSearch Benchmark community meetup!