OpenSearch Dashboards, the visualization tool for your OpenSearch data, offers the multiple data sources feature. This feature enables you to consolidate and visualize data from various OpenSearch clusters within a unified dashboard. By integrating disparate sources into a single view, the multiple data sources feature streamlines data analysis workflows, eliminates the need for complex data consolidation processes, and enhances productivity. With the ability to connect to and visualize data from multiple OpenSearch clusters, you can unlock new levels of observability, governance, and data-driven decision-making.
The multiple data sources feature is available in OpenSearch versions 2.4 and later. The feature supports authentication types (AWS Signature Version 4, basic authentication), Vega visualizations, and data management features (importing of saved objects). With OpenSearch 2.14, we have expanded multiple data sources support for nine dashboard features (index management, machine learning [ML], search relevance, anomaly detection, maps, security, notifications, Query Workbench, and trace analytics) and certain visualizations (time-series visual builder [TSVB] and region map). If you are managing an environment with multiple clusters and use one cluster more often than the others, you now have the ability to set a default cluster that can be referenced by all Dashboards features.
This blog post explains the top three scenarios in which you might want to enable one OpenSearch Dashboards instance to manage data from multiple data sources.
Scenario 1: Unified analytics across distributed data sources
For enterprises with data scattered across various clusters, users previously had to establish temporary ingestion pipelines to consolidate data into a central repository for analysis. However, with the introduction of support for multiple data sources, OpenSearch Dashboards now allows users to query and visualize data from multiple sources within a single dashboard. This feature supports a range of visualization types, like Vega, TSVB, Region Map, and index-pattern-based visualizations, providing a comprehensive and cohesive view of dispersed data.
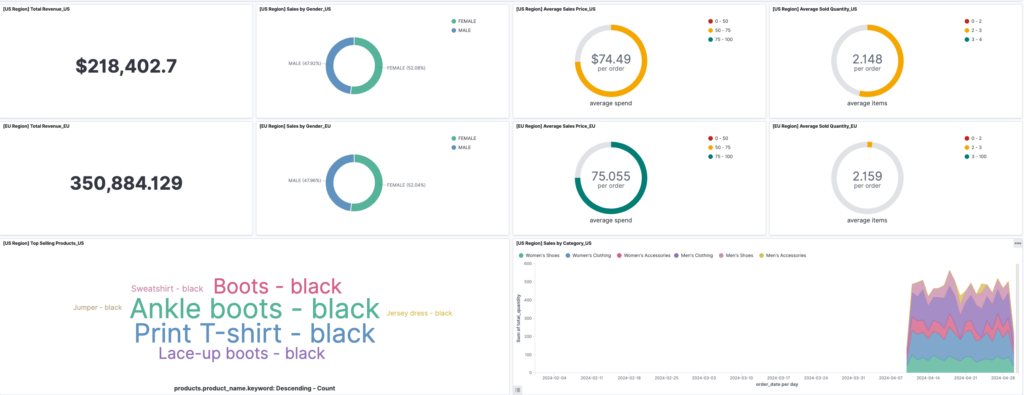
The following images show how OpenSearch Dashboards can present data from various sources in a unified dashboard view.
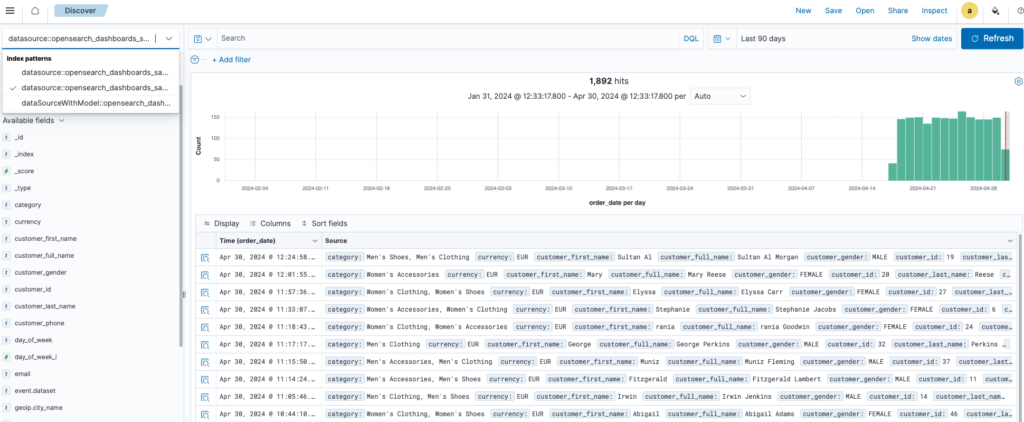
You can perform query analytics on different clusters using the data source picker.
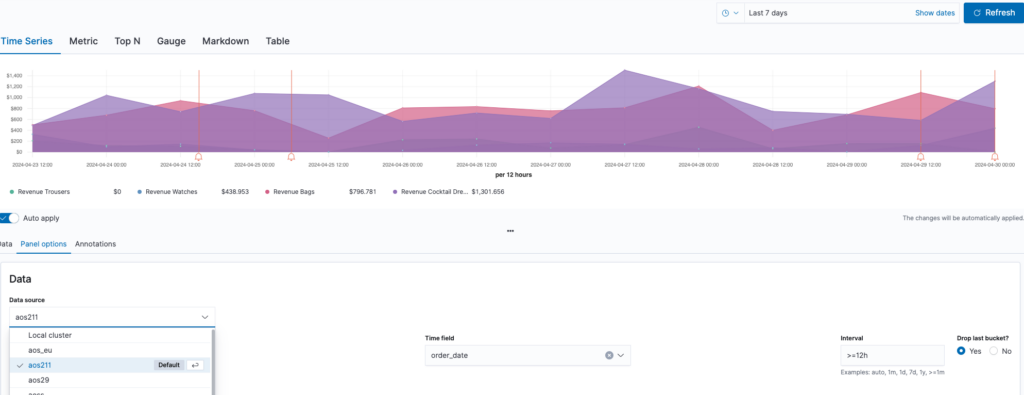
The following image shows a TSVB visualization created from disparate data sources.
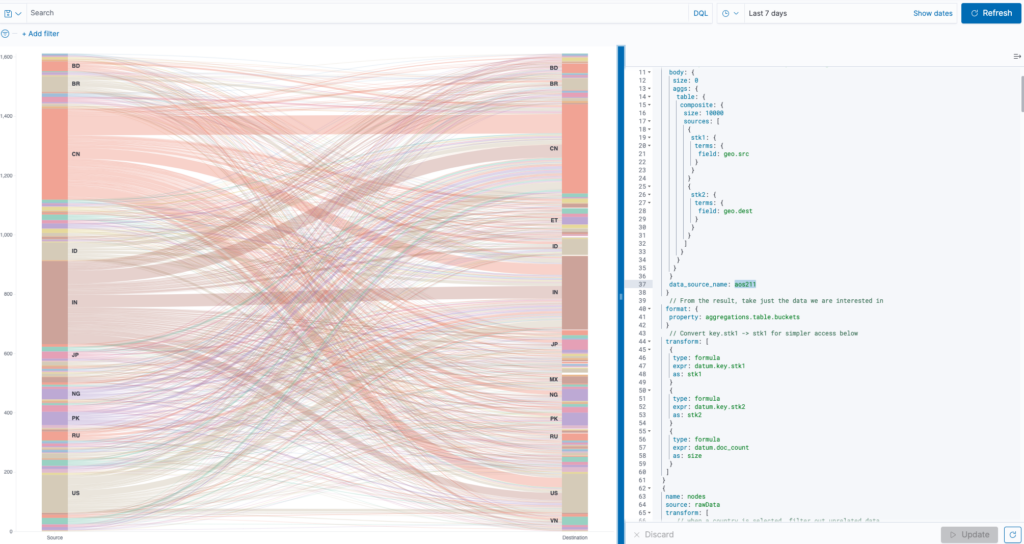
By simply specifying a new data_source_name field within the Vega specification url field, you can create a Vega visualization with data from one or more specific data sources by name. An example specification setting is shown in the following image.
The multiple data sources feature supports adding a prefix to the index pattern name, making it easier to identify the pattern during its creation.
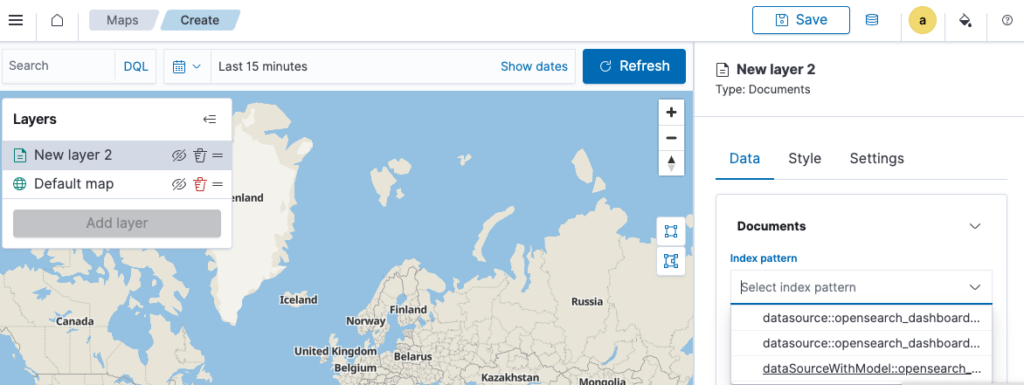
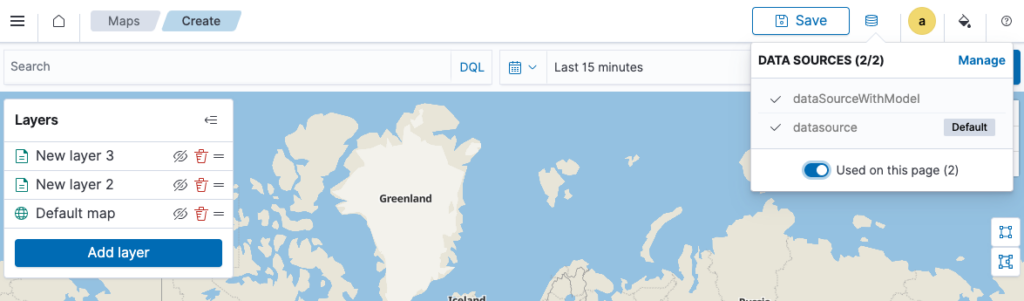
Additionally, the referenced data sources from the current map layers are indicated by clicking on the icon on the top navigation bar.
Scenario 2: Centralized data management and governance
In addition to analyzing multiple data sources in a unified dashboard, you can manage remote clusters operationally. You can manage your indexes, security policies, notifications, and ML models and then select the target data source from the unified dashboard.
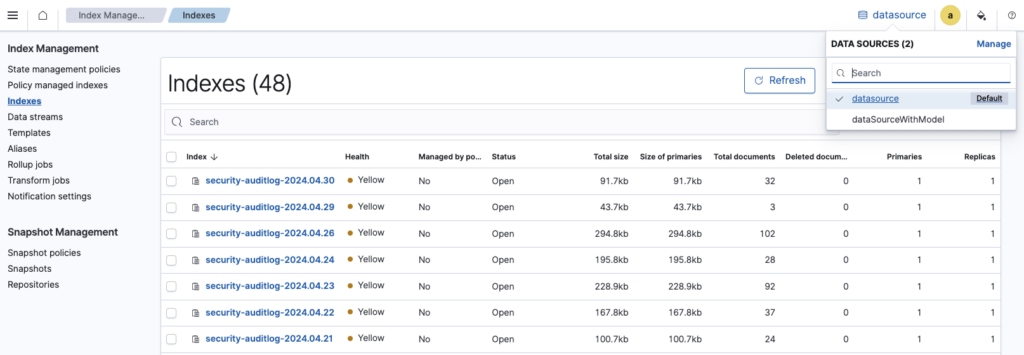
OpenSearch Dashboards allows you to perform all index operations, such as creating, reading, updating, and deleting indexes, as well as managing index mappings, templates, and aliases, across multiple data sources from a single instance.
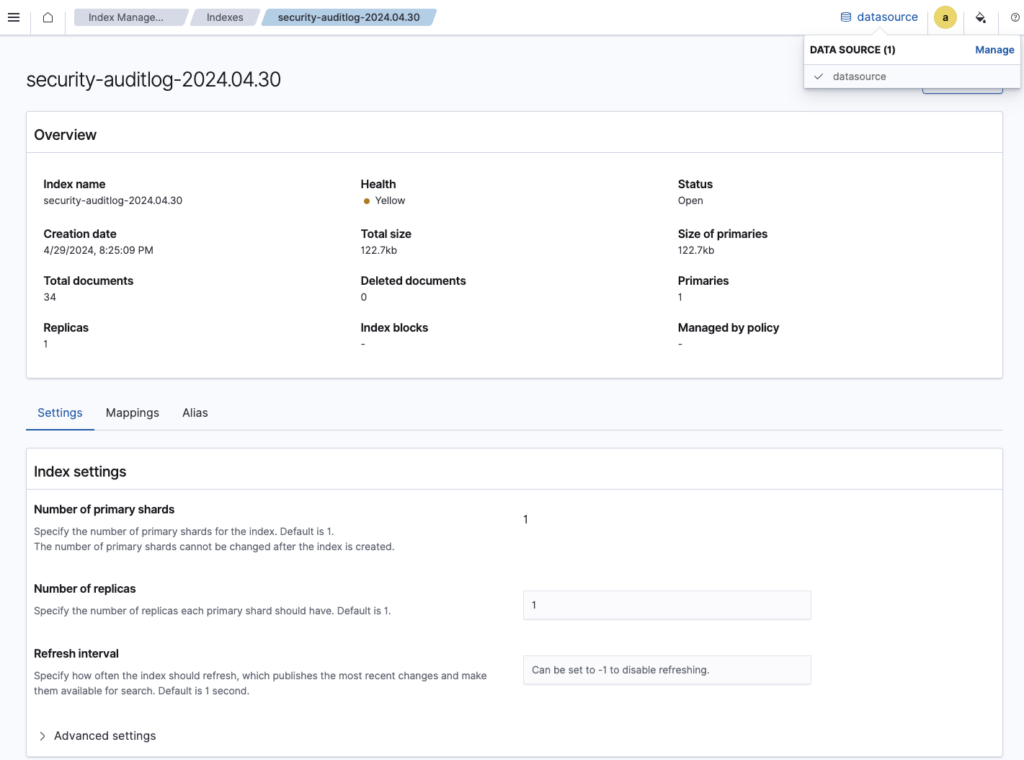
You can switch between different data sources using the upper-right navigation bar, select a specific index, and choose the desired operation. Selecting an index name will display detailed information about that index. The data source ID, which is the unique identifier (UUID), is embedded in the URL, allowing you to bookmark and share specific pages directly.
The following images show the data source picker in the upper-right corner in Index State Management.
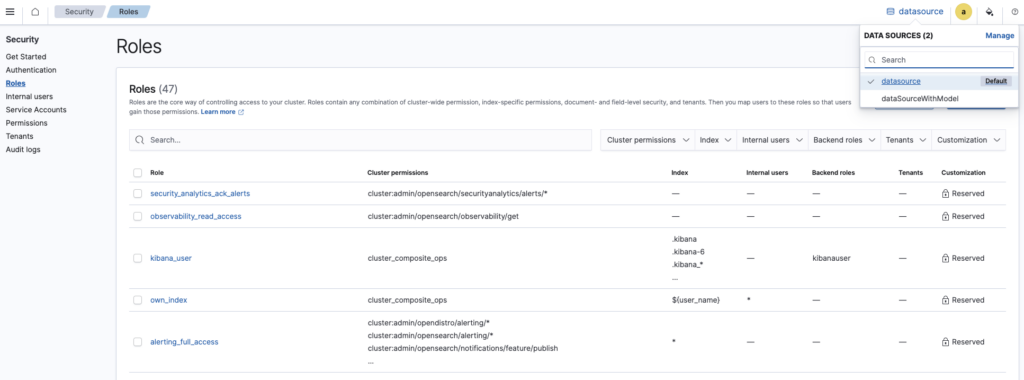
OpenSearch Dashboards supports managing security across multiple data sources. Administrators can centrally manage roles and internal users for different clusters by selecting the desired cluster from the DATA SOURCES dropdown menu, as shown in the following image.
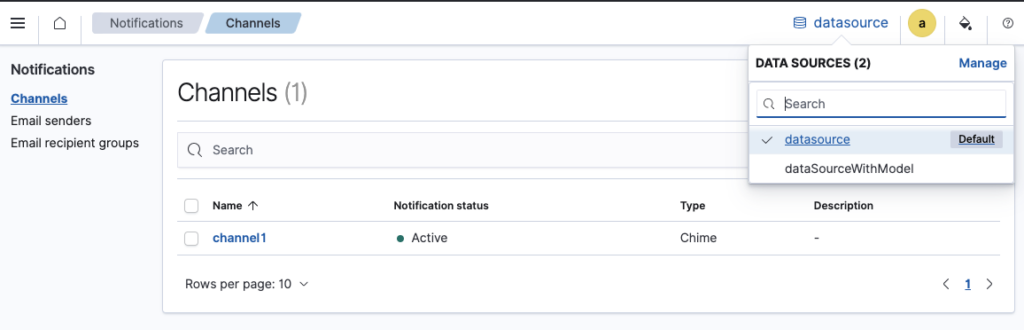
You can also manage notification channels, as shown in the following image.
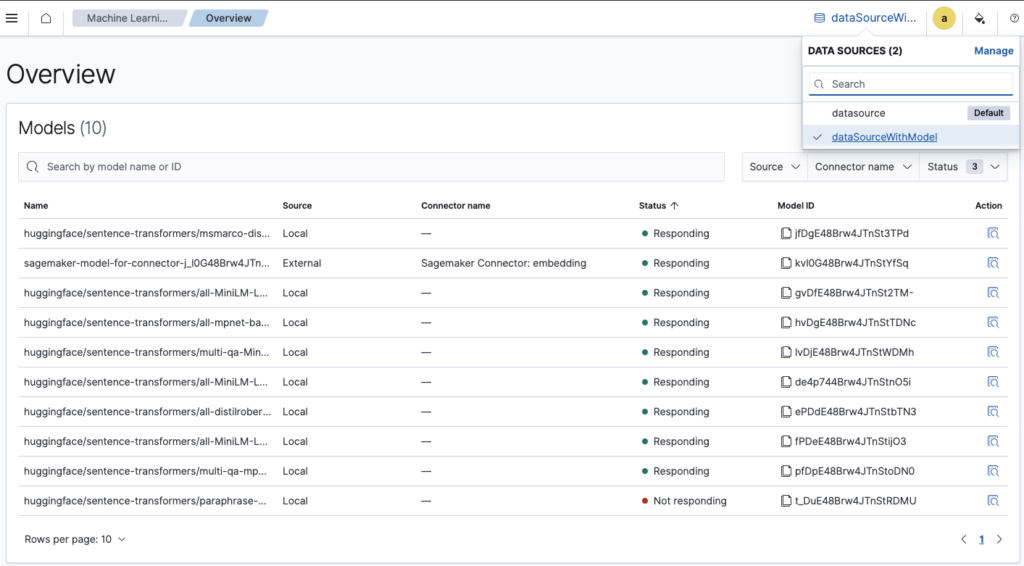
Users can manage remote ML models, as shown in the following image. The pretrained models are deployed to the selected cluster through the Dev Tools console.
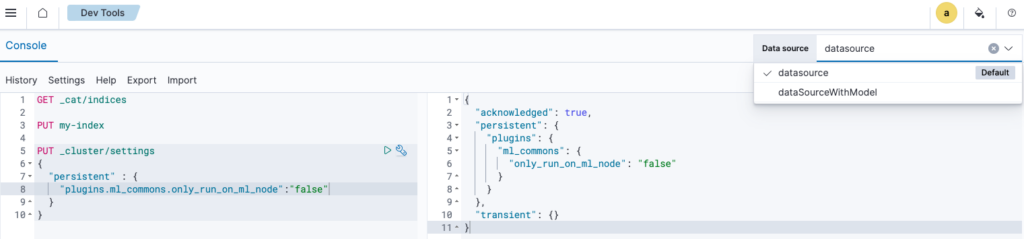
The Dev Tools console, shown in the following image, is integrated with the multiple data sources feature. You can select the target data source and execute commands to query the backend data directly from a central location.
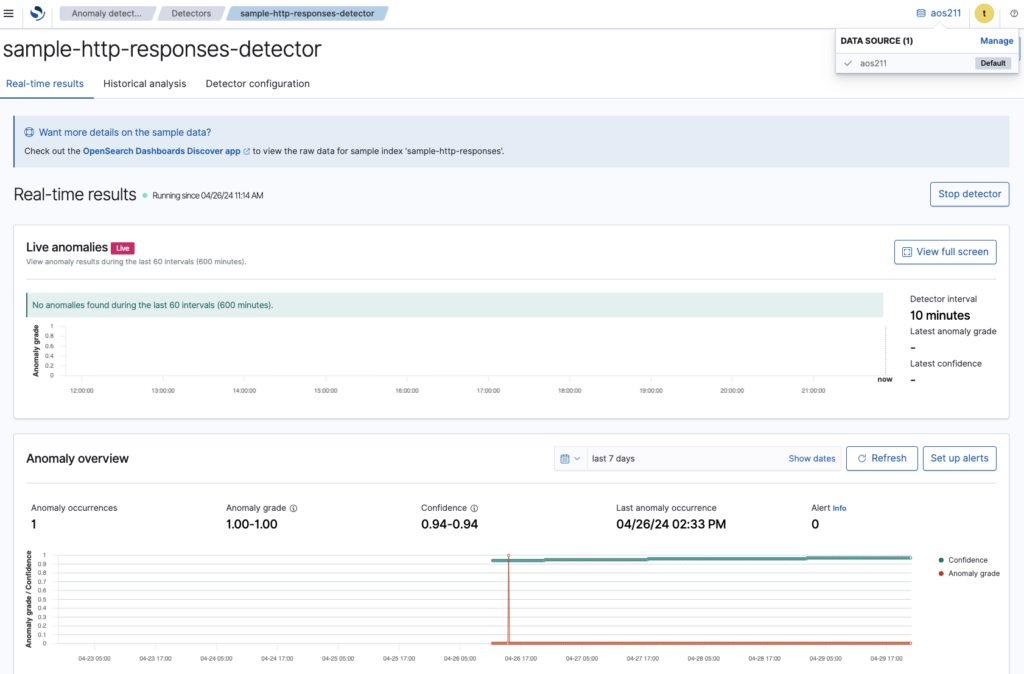
The multiple data sources feature enables OpenSearch Dashboards to provide a centralized interface for creating, viewing, and modifying anomaly detectors from various OpenSearch clusters, streamlining the management process, as shown in the following image.
Scenario 3: Comparing search query results across clusters
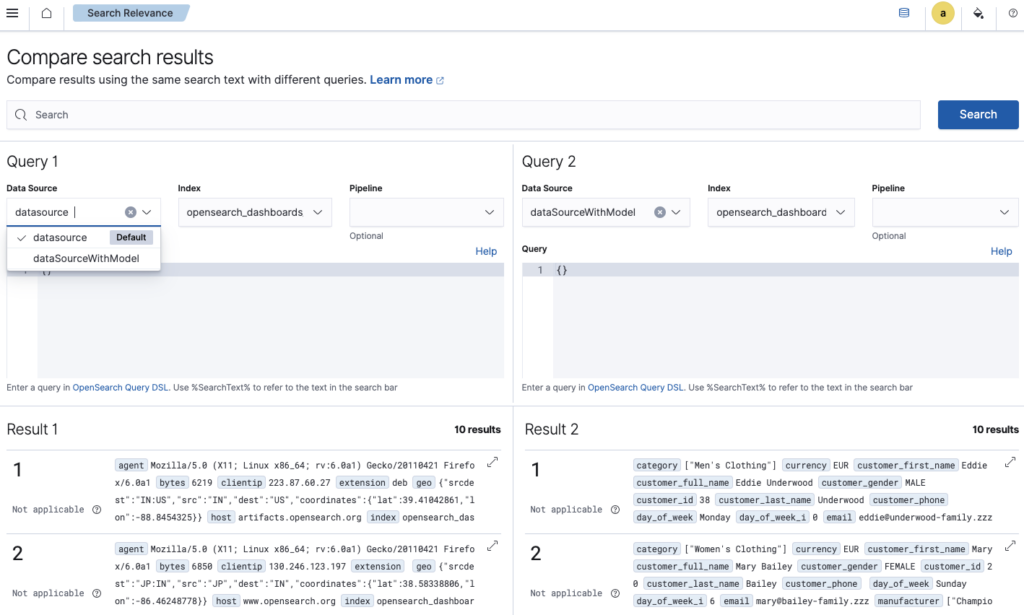
For users with multiple OpenSearch clusters handling search traffic, the multiple data sources feature allows OpenSearch Dashboards to compare search results across these clusters within a single instance by using the data source picker in the Compare search results application.
Summary
The multiple data sources feature in OpenSearch Dashboards represents a significant advancement in data analysis and management. By consolidating access to distributed data sources within a single interface, it enables users to gain comprehensive insights, streamline operations, and make informed decisions more efficiently. As organizations face challenges in managing and analyzing data across disparate systems, this feature positions OpenSearch Dashboards as a powerful solution for centralized data observability, governance, and exploration. With the ability to unify data from multiple clusters, users can unlock new levels of productivity, collaboration, and data-driven decision-making across their data ecosystem.
If you have additional scenarios you’d like us to cover, let us know.
Special thanks to Ramakrishna Chilaka, Prabhat Sharma, Derek Ho, Junqiu Lei, Jackie Han, Riya Saxena, Sumukh Hanumantha Swamy, Lin Wang, Ella Zhu, Emma Jin, Huy Nguyen, and Zhongnan Su for their work in building multiple data sources support for OpenSearch Dashboards.