
Starting with OpenSearch 3.3, Piped Processing Language (PPL) includes new and improved capabilities that simplify log analytics and observability workflows. These updates make it easier to troubleshoot applications, monitor performance, and analyze security events.
In this blog post, we’ll explore the new PPL commands and functions through practical examples of common log analytics use cases. You’ll learn how these enhancements help you combine multiple data sources, process unstructured log data, and perform time-series analysis. We’ll also highlight significant performance improvements in the 3.3 release, including the integration of Apache Calcite as the query engine.
New commands and functions
OpenSearch 3.3 substantially expands PPL functionality with 9 new commands and 15 new functions. Additionally, it refines the syntax of existing commands, making them easier to use and creating a more intuitive experience across various analytical scenarios.
The following scenarios highlight how the new commands and functions can help you analyze your data.
Combining datasets within a single query
This release enhances PPL data manipulation with new commands that support more flexible data combination and field operations. The append command merges results from multiple queries into a single dataset, making it easier to combine data from different sources or time ranges. The join command combines two datasets, where the left side can be an index or the output of piped commands, and the right side can be either an index or a subsearch.
The following example uses the join command to combine web log data with geographical IP data, allowing you to identify which countries generate the most traffic:
PPL> source = web_logs
  | join type=inner client_ip [source=ip_geodata]
  | stats count() as total_requests by country
The CLI returns the following results:
┏━━━━━━━━━━┳━━━━━━━━━━━━━━┓
┃ country  ┃total_requests┃
┡━━━━━━━━━━╇━━━━━━━━━━━━━━┩
│ USA      │ 5            │
├──────────┼──────────────┤
│ Canada   │ 3            │
├──────────┼──────────────┤
│ UK       │ 1            │
└──────────┴──────────────┘
Time-series analysis
PPL adds streamlined temporal and distribution analysis with the new timechart, bin, and eventstats commands. The timechart command aggregates data over time intervals with flexible span controls and automatically handles gap filling and result ordering for time-series workflows. It formats results with time as the primary axis and supports grouping by additional fields. The bin command groups numeric values into ranges, making it easier to analyze distributions and understand data spread and frequency patterns. The eventstats command generates summary statistics from event fields while preserving the original events.
These commands make it easier to analyze temporal patterns and data distributions directly within PPL queries, helping you identify trends and outliers without additional processing. The earliest and latest functions retrieve timestamp-based values, allowing you to find the first or most recent occurrence of values within groups for time-series analysis.
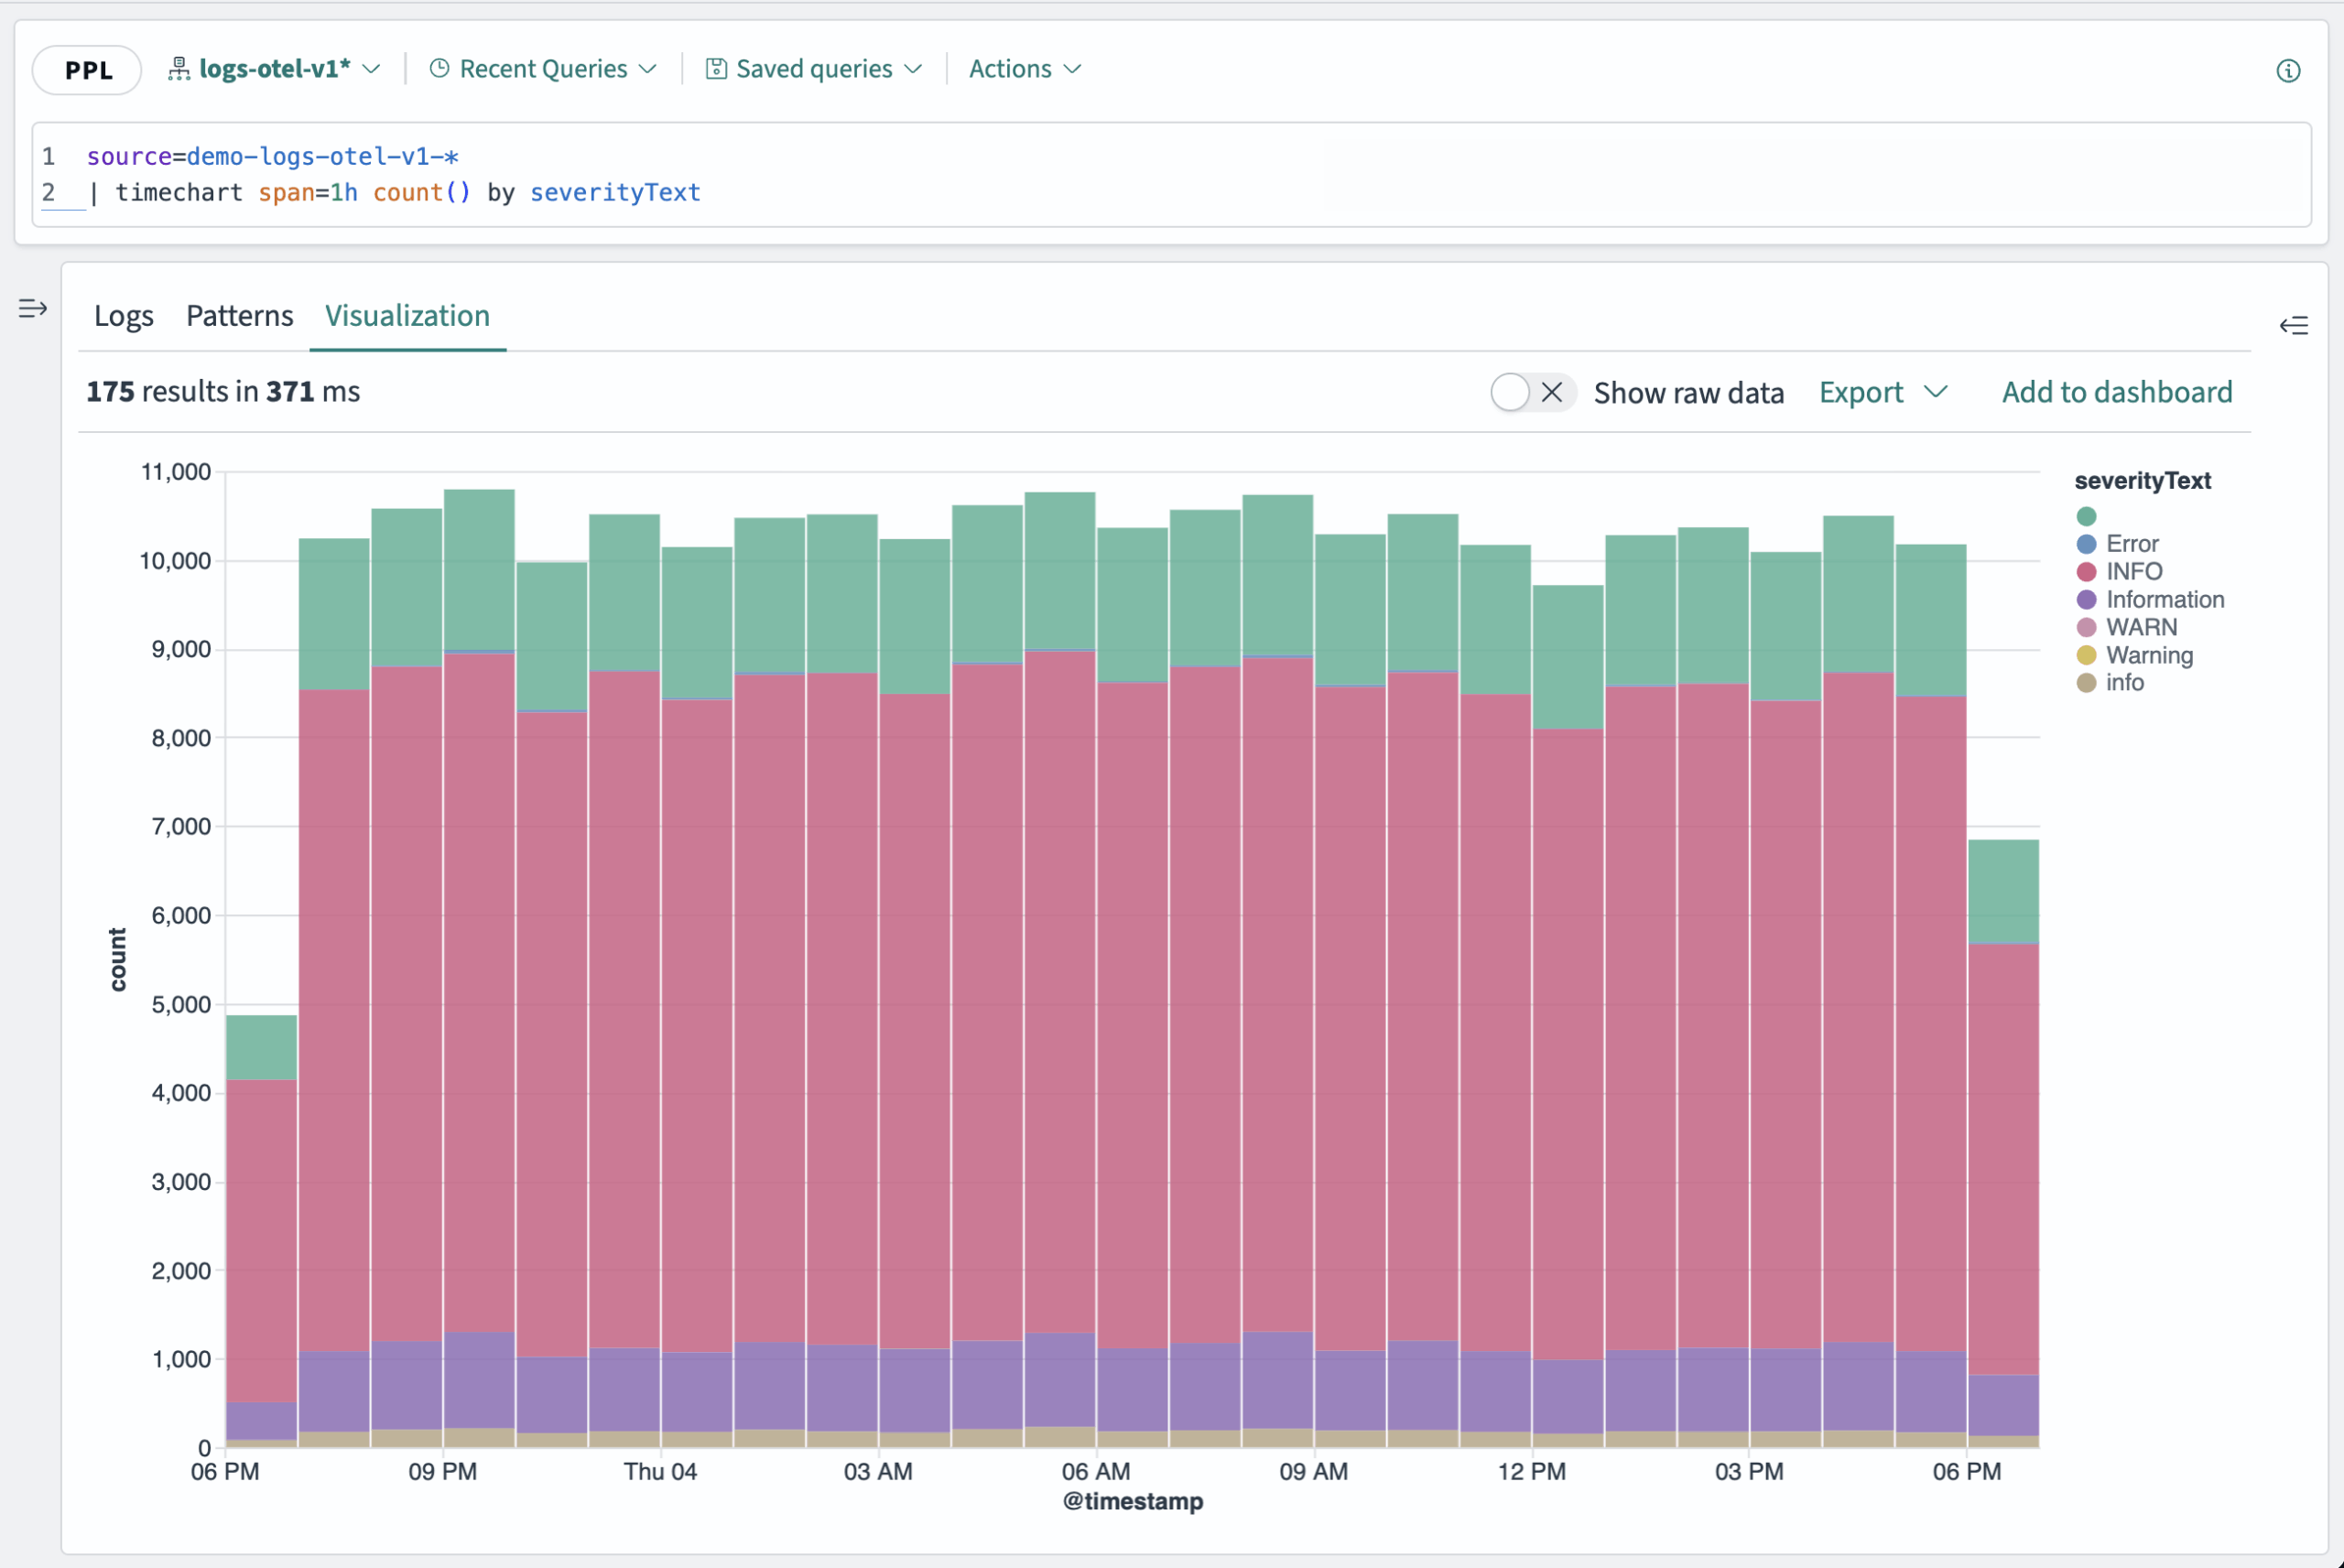
The following example groups log data into 1-hour intervals and counts the number of logs for each severity level within these intervals using the timechart command:
PPL> source=demo-logs-otel-v1-*
    | timechart span=1h count() by severityText
When running this query in OpenSearch Dashboards, the visualization shows log distribution over time by severity level, as illustrated in the following image.
Unstructured log processing at query time
PPL adds text processing capabilities with the regex, rex, and spath commands. These commands let you filter, extract, and parse unstructured text directly in queries, without preprocessing. The regex command filters log entries using patterns, rex extracts structured fields from raw text with regular expressions, and spath extracts fields from JSON, including nested objects and arrays. Together, they allow you to work with new log formats immediately, without reindexing, so you can analyze previously unstructured data right away.
The following example extracts structured information (loglevel, action, userid, and sourceip) from the log message using the rex command:
PPL> source=app_logs
    | rex field=message '\[(?<loglevel>\w+)\] (?<action>.*) for userId=(?<userid>\d+).*IP=(?<sourceip>[\d\.]+)'
    | head 5
    | fields loglevel, action, userid, sourceip
The CLI returns the following results:
┏━━━━━━━━━┳━━━━━━━━━━━━━━━━━━━━━━━━━━━┳━━━━━━━━┳━━━━━━━━━━━━━━━┓
┃ loglevel┃ action                    ┃ userid ┃ sourceip      ┃
┡━━━━━━━━━╇━━━━━━━━━━━━━━━━━━━━━━━━━━━╇━━━━━━━━╇━━━━━━━━━━━━━━━┩
│ ERROR   │User authentication failed │ 12345  │ 192.168.1.100 │
├─────────┼───────────────────────────┼────────┼───────────────┤
│ ERROR   │User authentication failed │ 12346  │ 192.168.1.101 │
├─────────┼───────────────────────────┼────────┼───────────────┤
│ INFO    │ Successful login          │ 12347  │ 192.168.1.102 │
├─────────┼───────────────────────────┼────────┼───────────────┤
│ ERROR   │User authentication failed │ 12345  │ 192.168.1.100 │
├─────────┼───────────────────────────┼────────┼───────────────┤
│ INFO    │ Password reset requested  │ 12346  │ 192.168.1.101 │
└─────────┴───────────────────────────┴────────┴───────────────┘
Complex data type support
With these latest updates, you can perform complex data transformations at search time rather than index time. The existing PPL functions handle primitive data types such as strings, numbers, and timestamps. Support has now been extended to complex data types with multi-value aggregation functions like list and values. These functions collect multiple values into structured arrays during aggregation, with list preserving duplicates and values returning only unique values. The mvjoin function combines multi-value fields into single strings using specified delimiters, making it easier to manipulate arrays directly within queries.
The following example analyzes user journeys across pages, identifying common navigation patterns by using the values function:
PPL> source=user_activity
    | stats
        values(page_url) as navigation_path,
        max(duration) as max_duration,
        avg(duration) as avg_duration
        by session_id
    | eval path_length = array_length(navigation_path)
    | where path_length > 3
    | sort max_duration desc
The CLI returns the following results:
┏━━━━━━━━━━┳━━━━━━━━━━━━━━━━━━━━━━━━━━━━━━━━━━━━━━━━━━━━━━━━━━━━━━━━━━━┳━━━━━━━━━━━━┳━━━━━━━━━━━━┳━━━━━━━━━━━┓
┃session_id┃ navigation_path                                           ┃max_duration┃avg_duration┃path_length┃
┡━━━━━━━━━━╇━━━━━━━━━━━━━━━━━━━━━━━━━━━━━━━━━━━━━━━━━━━━━━━━━━━━━━━━━━━╇━━━━━━━━━━━━╇━━━━━━━━━━━━╇━━━━━━━━━━━┩
│sess_005  │ ["/home","/products","/product/789","/cart","/checkout"]  │ 300        │ 186        │ 5         │
├──────────┼───────────────────────────────────────────────────────────┼────────────┼────────────┼───────────┤
│sess_002  │ ["/home","/search","/product/123","/cart"]                │ 300        │ 142.5      │ 4         │
├──────────┼───────────────────────────────────────────────────────────┼────────────┼────────────┼───────────┤
│sess_001  │ ["/home","/products","/product/456","/cart","/checkout"]  │ 240        │ 156        │ 5         │
├──────────┼───────────────────────────────────────────────────────────┼────────────┼────────────┼───────────┤
│sess_003  │ ["/home","/blog","/blog/post-1","/blog/post-2","/contact"]│ 240        │ 129        │ 5         │
└──────────┴───────────────────────────────────────────────────────────┴────────────┴────────────┴───────────┘
Performance enhancements
Historically, OpenSearch PPL used a custom query optimizer. In version 3.0, we introduced an experimental query optimizer based on Apache Calcite. Starting with OpenSearch 3.3, Apache Calcite is the default optimizer, providing advanced capabilities including both rule-based and cost-based optimizations.
To evaluate PPL performance, we built a benchmarking infrastructure using the PPL Big5 datasets. These datasets enable standardized performance testing across a variety of analytical scenarios and workload patterns. Automated nightly benchmarks ensure consistent quality and help detect any regressions, while public dashboards give users visibility into query performance. You can explore the nightly Big5 PPL benchmarks on the OpenSearch Performance Benchmarks page.
With Calcite, PPL achieves significant performance improvements over previous versions. Most PPL commands and function executions are now pushed down to the OpenSearch query domain-specific language (DSL), reducing heavy post-processing. Additional improvements include composite aggregations, enhanced date histogram support, better memory management for large result sets, and improved handling of high-cardinality fields. For example, the Big5 PPL date_histogram_hourly_agg query is now 160x faster, dropping from 2.5 seconds to 15 milliseconds. These enhancements benefit common observability use cases such as log analysis and time-series exploration. Complete benchmark results and performance metrics are available on the nightly benchmark dashboard.
Get started with the CLI tool
You can explore new PPL features today without upgrading your existing OpenSearch domain. Using the OpenSearch CLI, you can test these features on older version domains, allowing you to verify functionality before performing a full domain upgrade.
Here’s how to get started:
- Install the latest version of the CLI tool: Follow the installation steps in the OpenSearch SQL CLI README, which includes the new PPL capabilities.
- Connect to your OpenSearch cluster (you can connect to a local or remote cluster):
opensearchsql -e https://your-cluster-endpoint:your-port -u username:password
Upon connection, the CLI displays information about your cluster version, SQL/PPL version, and default settings:
____ _____ __ / __ \____ ___ ____ / ___/___ ____ ___________/ /_ / / / / __ \/ _ \/ __ \\__ \/ _ \/ __ `/ ___/ ___/ __ \ / /_/ / /_/ / __/ / / /__/ / __/ /_/ / / / /__/ / / / \____/ .___/\___/_/ /_/____/\___/\__,_/_/ \___/_/ /_/ /_/ OpenSearch: v3.1.0 Endpoint: https://your-cluster-endpoint:your-port User: admin SQL: v3.3.0.0 Language: PPL Format: TABLE - Start exploring new PPL commands:
PPL> source=user_activity | where duration > 200 | head 3
The CLI returns the following results:
Executing: source=user_activity | where duration > 200 | head 3
Fetched 3 rows with a total of 3 hits
┏━━━━━━━━━━┳━━━━━━━━━━━━━━┳━━━━━━━━━━━━┳━━━━━━━━━━━━━━━━━━━━━┳━━━━━━━━━┓
┃ duration ┃ page_url     ┃ session_id ┃ @timestamp          ┃ user_id ┃
┡━━━━━━━━━━╇━━━━━━━━━━━━━━╇━━━━━━━━━━━━╇━━━━━━━━━━━━━━━━━━━━━╇━━━━━━━━━┩
│ 240      │ /product/456 │ sess_001   │ 2025-10-08 10:05:00 │ user123 │
├──────────┼──────────────┼────────────┼─────────────────────┼─────────┤
│ 240      │ /product/456 │ sess_001   │ 2025-10-08 10:05:00 │ user123 │
├──────────┼──────────────┼────────────┼─────────────────────┼─────────┤
│ 300      │ /product/123 │ sess_002   │ 2025-10-08 10:18:00 │ user456 │
└──────────┴──────────────┴────────────┴─────────────────────┴─────────┘
Get involved with PPL
The future of PPL depends on community involvement and feedback. We encourage you to try the new features using the CLI tool and share your experiences with the OpenSearch community. Whether you’re exploring new use cases or identifying areas for improvement, your input helps guide the development of observability capabilities. To make reporting easier, we’ve provided a bug report template.
For more information, check out the following resources: