In OpenSearch version 1.3, we added cluster metrics monitors to the Alerting plugin. Cluster metrics monitors allow you to execute popular CAT and cluster API calls against the local cluster and generate alerts based on the metrics reported by those APIs. Cluster metrics monitors support calling the following APIs:
- _cluster/health
- _cluster/stats
- _cluster/settings
- _nodes/stats
- _cat/indices – new with v2.9.0!
- _cat/pending_tasks
- _cat/recovery
- _cat/shards – new with v2.9.0!
- _cat/snapshots
- _cat/tasks
In this blog post, we’ll walk through two common use cases for this monitor type: monitoring CPU utilization and monitoring JVM memory pressure. Additionally, we’ll present use cases for the newly supported APIs _cat/indices and _cat/shards.
Monitoring cluster CPU utilization
By creating a cluster metrics monitor that calls the _cluster/stats API, you can receive alerts when the CPU utilization of the cluster reaches a certain threshold. To generate an alert when the CPU utilization reaches or exceeds 60%, follow these steps:
- From the top menu, select OpenSearch Plugins > Alerting.
- On the Monitors tab, select Create monitor.
- Select the Per cluster metrics monitor option. For demonstration purposes, you’ll configure this monitor to run every minute by leaving the default values under Schedule.
- Under Query > Request type, select Cluster stats. In the response preview, you can see that the current CPU utilization for this cluster is 0%.
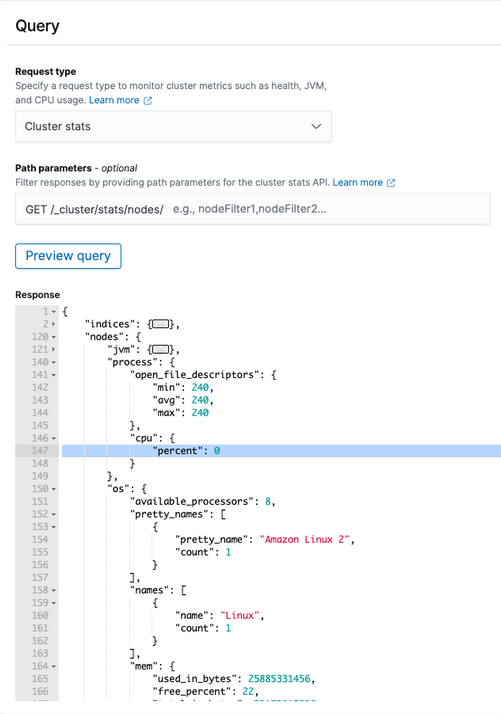
- Configure a trigger condition that compares the CPU percentage to your desired threshold:
ctx.results[0].nodes.process.cpu.percent >= 60In this example, you can see that the trigger condition response is false because the CPU utilization for the cluster is currently 0%. 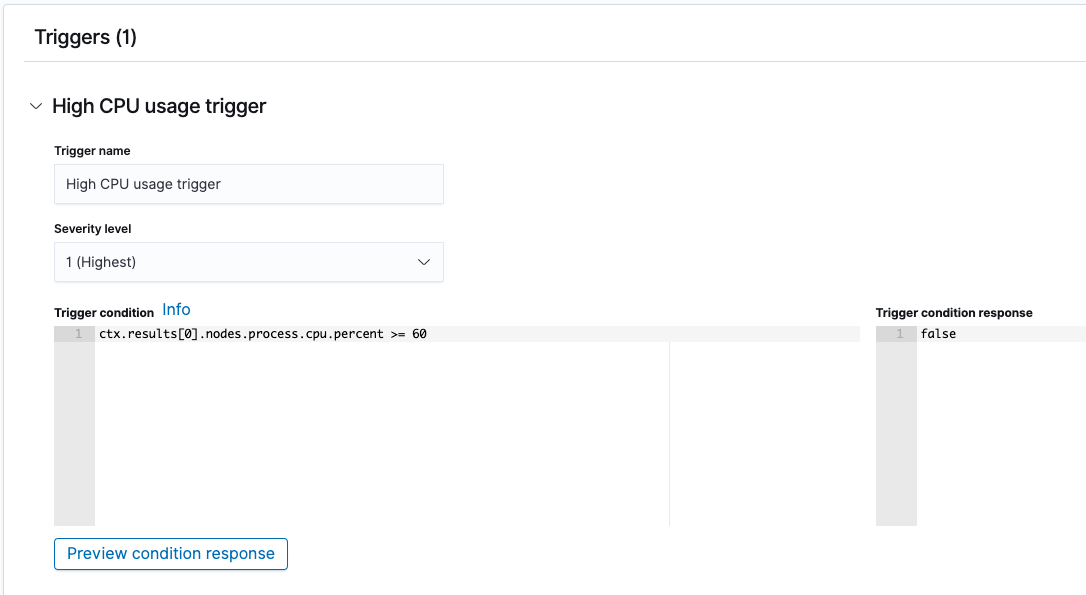
- Configure notification actions as desired. This example uses a dummy channel for demonstration purposes. As you can see in the example, you can include
ctx.results.0.nodes.process.cpu.percentto print the CPU utilization in the notification message:
 The current CPU usage for the cluster is {{ctx.results.0.nodes.process.cpu.percent}}%`.

 Monitor {{ctx.monitor.name}} just entered alert status. Please investigate the issue.
 - Trigger: {{ctx.trigger.name}}
 - Severity: {{ctx.trigger.severity}}
 - Period start: {{ctx.periodStart}}
- Period end: {{ctx.periodEnd}}- Select Create to create your monitor!
Monitoring cluster JVM memory pressure
You can also use the _cluster/stats API to receive alerts when the JVM memory pressure of the cluster reaches a certain threshold. Let’s say you want to generate an alert when the JVM memory pressure reaches or exceeds 75%. This example requires a little more understanding of configurable trigger conditions because the _cluster/stats API doesn’t return the percentage of the heap that’s used; it returns heap_used_in_bytes and heap_max_in_bytes.
- From the top menu, select OpenSearch Plugins > Alerting.
- On the Monitors tab, select Create monitor.
- Select the Per cluster metrics monitor option. For demonstration purposes, you’ll configure this monitor to run every minute by leaving the default values under Schedule.
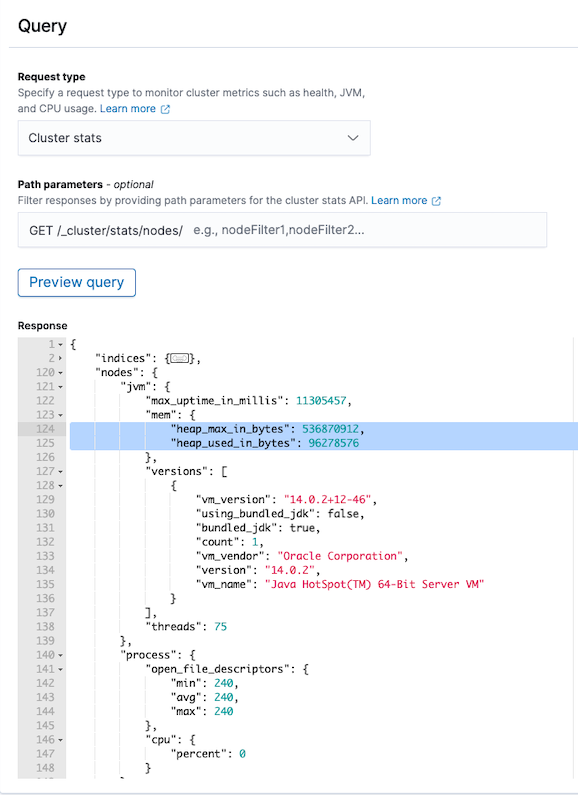
- Under Query > Request type, select Cluster stats. In the response preview, you can see that the current
heap_max_in_bytesis536870912and the currentheap_used_in_bytesis96278576, which is about 17.93% of the max.
- Configure a trigger condition that calculates the JVM memory pressure percentage and compares it to the desired threshold:
ctx.results[0].nodes.jvm.mem.heap_used_in_bytes / ctx.results[0].nodes.jvm.mem.heap_max_in_bytes >= 0.75- Configure notification actions as desired. This example uses a dummy channel for demonstration purposes.
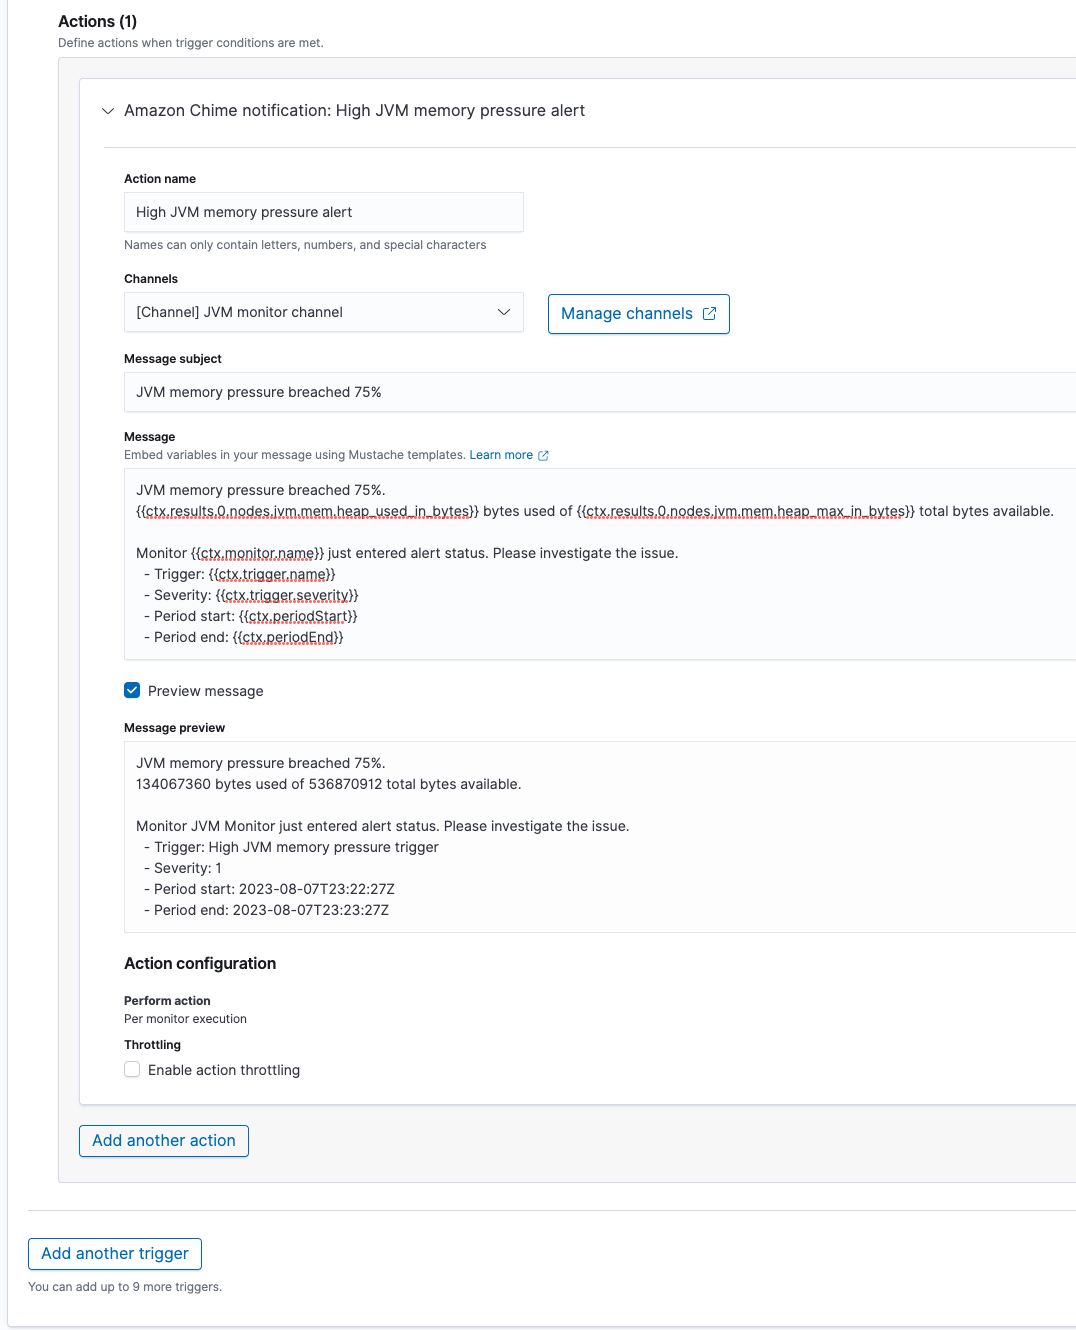 Mustache templates do not currently support performing calculations, but you can print the current
 heap_used_in_bytesandheap_max_in_bytesin the message:
 JVM memory pressure breached 75%.
 {{ctx.results.0.nodes.jvm.mem.heap_used_in_bytes}} bytes used of {{ctx.results.0.nodes.jvm.mem.heap_max_in_bytes}} total bytes available.

 Monitor {{ctx.monitor.name}} just entered alert status. Please investigate the issue.
 - Trigger: {{ctx.trigger.name}}
 - Severity: {{ctx.trigger.severity}}
 - Period start: {{ctx.periodStart}}
- Period end: {{ctx.periodEnd}}- Select Create to create your monitor!
Monitoring _cat/indices and _cat/shards responses
With the release of OpenSearch version 2.9, cluster metrics monitors now support calling the _cat/indices and _cat/shards APIs. The output from those APIs consists of a list of indexes and a list of shards, respectively. The following are some examples of trigger conditions that iterate through the list returned by the API to check whether any entry matches the desired condition.
_cat/indices
This example trigger condition generates an alert when the API response contains a red index.
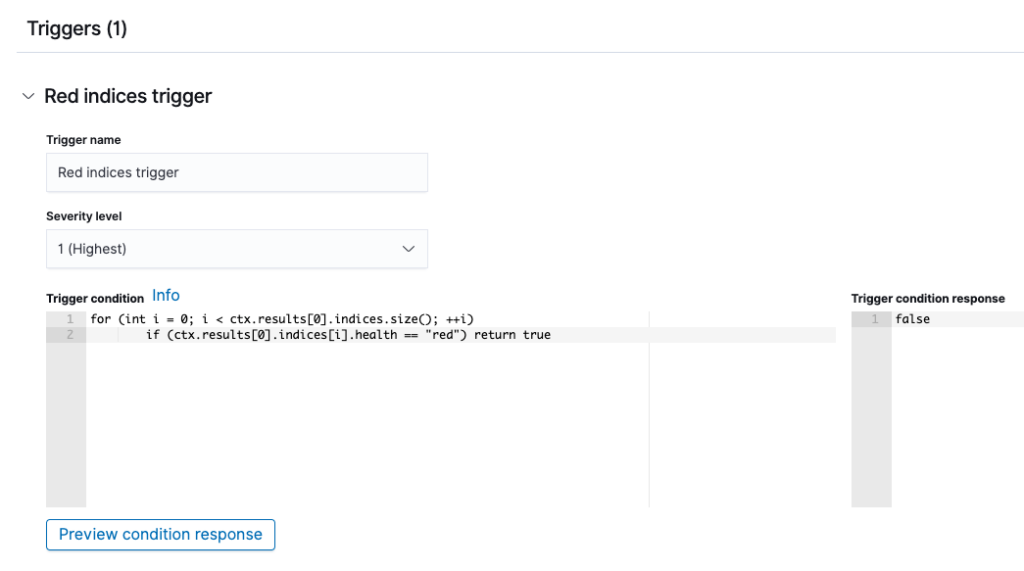
The trigger condition is configured as follows:
for (int i = 0; i < ctx.results[0].indices.size(); ++i)
  if (ctx.results[0].indices[i].health == "red") return true
Under Action, you can set up a message that will be sent when the trigger condition is met.
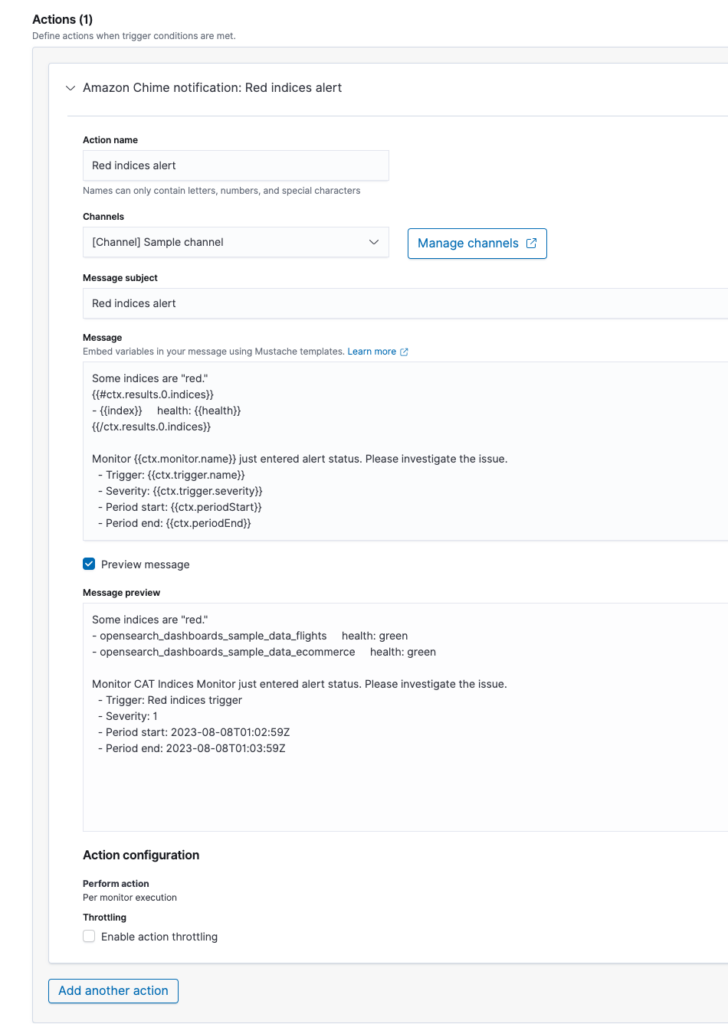
You can use the following Mustache template to print each entry in the list of indexes returned by the API call, along with information from each entry:
Some indices are "red."
{{#ctx.results.0.indices}}
- {{index}}     health: {{health}}
{{/ctx.results.0.indices}}

Monitor {{ctx.monitor.name}} just entered alert status. Please investigate the issue.
  - Trigger: {{ctx.trigger.name}}
  - Severity: {{ctx.trigger.severity}}
  - Period start: {{ctx.periodStart}}
  - Period end: {{ctx.periodEnd}}
Note that Mustache templates do not currently support conditional statements, so the template cannot be configured to print only indexes with a red health value. Instead, all of the returned indexes will be printed.
_cat/shards
This example trigger condition generates an alert when the API response contains an UNASSIGNED shard.
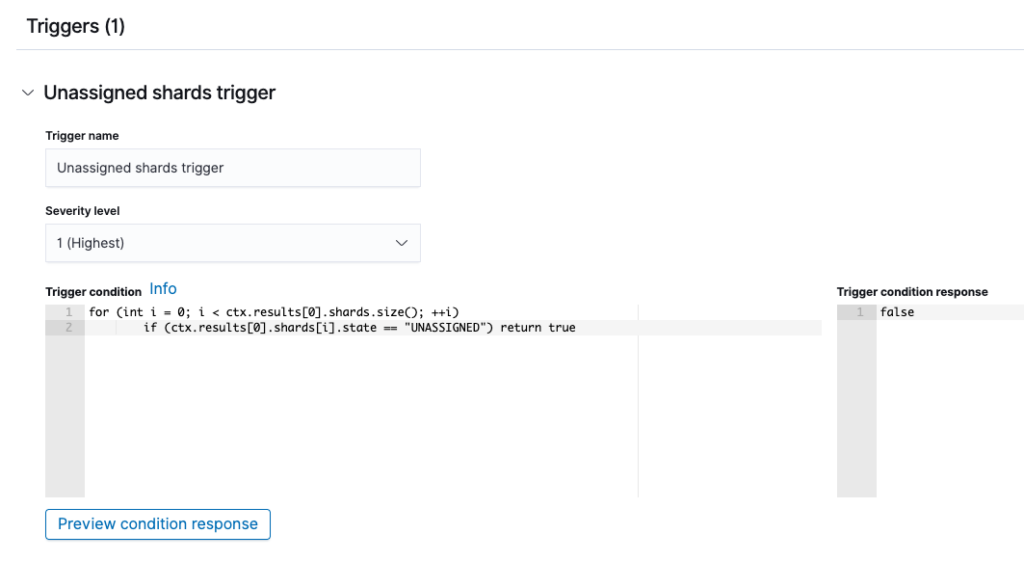
The trigger condition is configured as follows:
for (int i = 0; i < ctx.results[0].shards.size(); ++i)
  if (ctx.results[0].shards[i].state == "UNASSIGNED") return true
Under Action, you can set up a message that will be sent when the trigger condition is met.
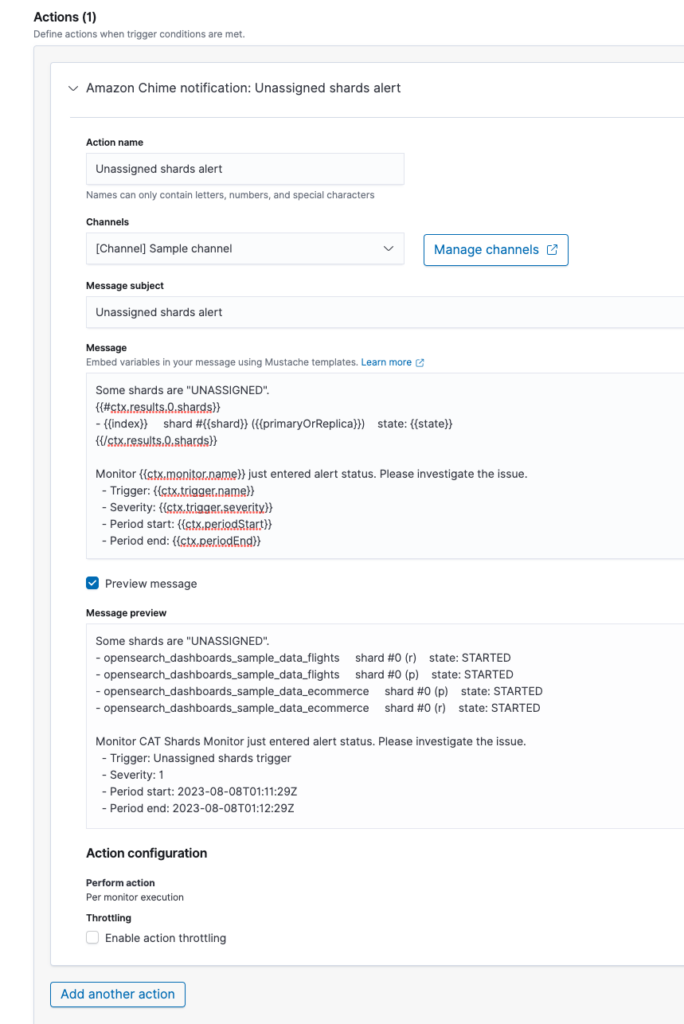
You can use the following Mustache template to print each entry in the list of shards returned by the API call, along with information from each entry:
Some shards are "UNASSIGNED."
{{#ctx.results.0.shards}}
- {{index}}     shard #{{shard}} ({{primaryOrReplica}}) state: {{state}}
{{/ctx.results.0.shards}}

Monitor {{ctx.monitor.name}} just entered alert status. Please investigate the issue.
  - Trigger: {{ctx.trigger.name}}
  - Severity: {{ctx.trigger.severity}}
  - Period start: {{ctx.periodStart}}
  - Period end: {{ctx.periodEnd}}
Note that Mustache templates do not currently support conditional statements, so the template cannot be configured to print only shards with an UNASSIGNED state value. Instead, all of the returned indexes will be printed.
Next steps
To learn more about cluster metrics monitors and the Alerting plugin, visit the cluster metrics monitors documentation.
If you have any feedback or would like to request an enhancement to cluster metrics monitors, create an issue in our GitHub repository!