
Streamline development and discovery with agent-powered search and observability
The latest version of OpenSearch includes an array of agent-powered tools to help you build, deploy, and deliver results faster. Whether you’re working to develop a production-ready search application or launch a complete open-source observability stack, OpenSearch 3.6 lets you do it in minutes. New capabilities supported in OpenSearch 3.6 include:
- Automate search application development with agent-guided workflows
- Launch a full-stack observability solution with one command
- Automate search relevance tuning with a natural-language interface
- Deploy real-time Application Performance Monitoring and root cause analysis for distributed applications
Read on for a look at these and other advancements in OpenSearch 3.6 and visit the release notes for a comprehensive view of what’s new.
Search Modernization
Build a complete search application in minutes, with no OpenSearch expertise required
OpenSearch Launchpad lets you reduce the complex work of building search solutions from hours or days to minutes through a guided, AI-powered experience. Traditionally, developing search applications demands deep expertise across several domains: selecting the right retrieval strategy, provisioning infrastructure, configuring machine learning (ML) models and pipelines, and creating a usable interface — all before validating your design. OpenSearch Launchpad eliminates this barrier through an intelligent agent that analyzes your sample document, gathers your preferences through conversation, and automatically provisions a complete local setup with optimal architecture and a working UI. Launchpad can handle every technical decision — from semantic encoding to cluster configuration — allowing you to focus on creating differentiated search experiences.
Automate search quality with agent-powered relevance tuning
Introduced as an experimental tool in the 3.6 release, OpenSearch Relevance Agent allows you to transform search relevance tuning from an intensive, expert-driven process into an automated workflow accessible to any developer. Through a sophisticated multi-agent system integrated into OpenSearch Dashboards, Relevance Agent can continuously analyze user behavior signals, generate data-driven hypotheses, and validate improvements through rigorous offline evaluation, all via natural language conversation. The tool applies three specialized sub-agents (User Behavior Analysis, Hypothesis Generator, and Evaluator) as it orchestrates the entire search improvement cycle, from diagnosing relevance gaps to executing DSL-level optimizations like refining search fields and tuning boost functions, while maintaining human-in-the-loop control and reducing optimization cycles from weeks to hours.
OpenSearch Relevance Agent is supported by the new OpenSearch Agent Server, an experimental multi-agent orchestration platform that enables developers to build specialized AI agents that work together with OpenSearch and OpenSearch Dashboards.
Simplify agent creation and standardize agent input
OpenSearch 3.6 streamlines how you build AI agents. An experimental unified agent registration API collapses four manual steps — creating a connector, registering a model, configuring an agent, and mapping parameters — into a single API call that handles connector and model creation automatically from a simple model block. The experimental conversational_v2 agent type introduces a standardized input interface supporting plain text, multimodal content blocks (images, video, documents), and full message-based conversation history, with no custom connector configuration required. Responses follow a standardized output format that includes token usage metrics — a standard that will be extended to all agent types in future releases.
Build more robust agentic search applications
OpenSearch 3.6 includes several agentic search enhancements, including:
- Alias support– Reference index aliases along with specific index names for more flexible query configurations.
- Embedding model configuration– Configure embedding model IDs directly through the agentic query translator processor to enable neural queries during execution.
- Fallback query– Configure a backup query when primary agentic queries fail or return no results
- Reranking– Reorder retrieved results using reranking models for improved relevance and precision.
- Agentic memory– Retain context from previous interactions for conversational, context-aware search experiences.
Improve vector search performance and maximize storage efficiency with 1-bit Scalar Quantization
OpenSearch 3.6 establishes 1-bit Scalar Quantization (SQ) across both Faiss and Lucene engines, optimizing storage resources for users who require maximum storage efficiency without sacrificing performance. This update establishes 1-bit scalar quantization with Faiss as the default for 32x compression — delivering 24% better recall and 15% lower latency compared to existing binary methods. For Lucene, 1-bit SQ brings 32x compression for the first time, enabling both approximate and exact k-NN search directly on quantized vectors. This is particularly effective for metadata-heavy use cases, allowing rapid, low-memory scoring even when complex filters are applied.
Decrease latency 40% with Faiss quantization optimizations
OpenSearch 3.6 introduces optimizations for Faiss quantization indices, significantly reducing search overhead by leveraging quantized flat vectors directly from graph files. Previously, using FP32 flat vectors introduced a “quantization tax” — an additional computational step required to quantize vectors during the search process. By utilizing the pre-quantized vectors already stored within the graph files, the system eliminates this redundant step, resulting in a 40% reduction in latency for quantized index searches.
Reduce storage with metadata compression for vector indices
This release introduces Zstandard (zstd) compression alongside vectors to deliver significant storage optimizations. By targeting metadata compression, this enhancement reduces the overall disk footprint of auxiliary data, so you can store more metadata-rich vectors on the same hardware without compromising the high-speed access required for search and retrieval.
Cut vector search latency in half with prefetch
Further enhancing throughput, this release introduces prefetch functionality for both ANN (Approximate Nearest Neighbor) and exact search use cases. Prefetching proactively loads the specific vectors required for distance computation into memory before they are needed by the CPU. This improves CPU utilization by minimizing idle cycles spent waiting for data from disk or slower memory tiers, delivering up to 2x search latency improvements for memory-constrained environments.
Streamline relevance tuning with Search Relevance Workbench improvements
Search Relevance Workbench gains a number of ease-of-use enhancements in OpenSearch 3.6. You can now run experiments against multiple data sources, and your experiments are easier to organize with the addition of optional name and description fields. Create query sets directly in the UI using plain text, key-value, or NDJSON formats, eliminating the need for exporting and editing query sets externally, with new flyouts and tooltips to enhance navigation. Three new metrics help you better evaluate quality in different search scenarios: Recall@K, Mean Reciprocal Rank (MRR), and Discounted Cumulative Gain (DCG@K), along with improved handling for non-binary ratings with existing binary evaluations like Precision@K.
Observability and Analytics
Deploy full-stack observability with one command
The OpenSearch Observability Stack is an open-source, OpenTelemetry-native observability platform for monitoring microservices, web applications, and AI agents. It bundles OpenTelemetry Collector, Data Prepper, OpenSearch, Prometheus, and OpenSearch Dashboards into a single pre-configured deployment that can be launched with one command via docker compose or an interactive installer. The stack provides distributed tracing with auto-generated service maps and RED metrics, log analytics, Prometheus-compatible metrics with PromQL support, and first-class AI agent observability including execution graph visualization, LLM call tracking, and token usage monitoring using OpenTelemetry GenAI semantic conventions. The stack provides example services, including a multi-agent travel planner, to help users explore capabilities immediately.
The OpenSearch Observability Stack also includes a Claude Code plugin that lets developers query and investigate traces, logs, and metrics using natural language directly from their terminal or IDE, with pre-built skills for PPL queries, PromQL metrics, cross-signal correlation, and monitoring.
Track and analyze distributed applications with Application Performance Monitoring
OpenSearch 3.6 introduces Application Performance Monitoring (APM), a new observability feature for real-time monitoring of distributed applications. APM combines auto-generated service topology maps with RED metrics (Rate, Errors, Duration) powered by OpenTelemetry and Data Prepper pipelines. Key capabilities include a centralized services catalog with per-operation and dependency performance breakdowns, and in-context correlations to drill down from service metrics into related traces and logs for root cause analysis, all accessible within an Observability workspace in OpenSearch Dashboards. An interactive application topology map auto-generates a directed graph from trace data, displaying services as health-coded nodes with directional edges showing communication patterns.
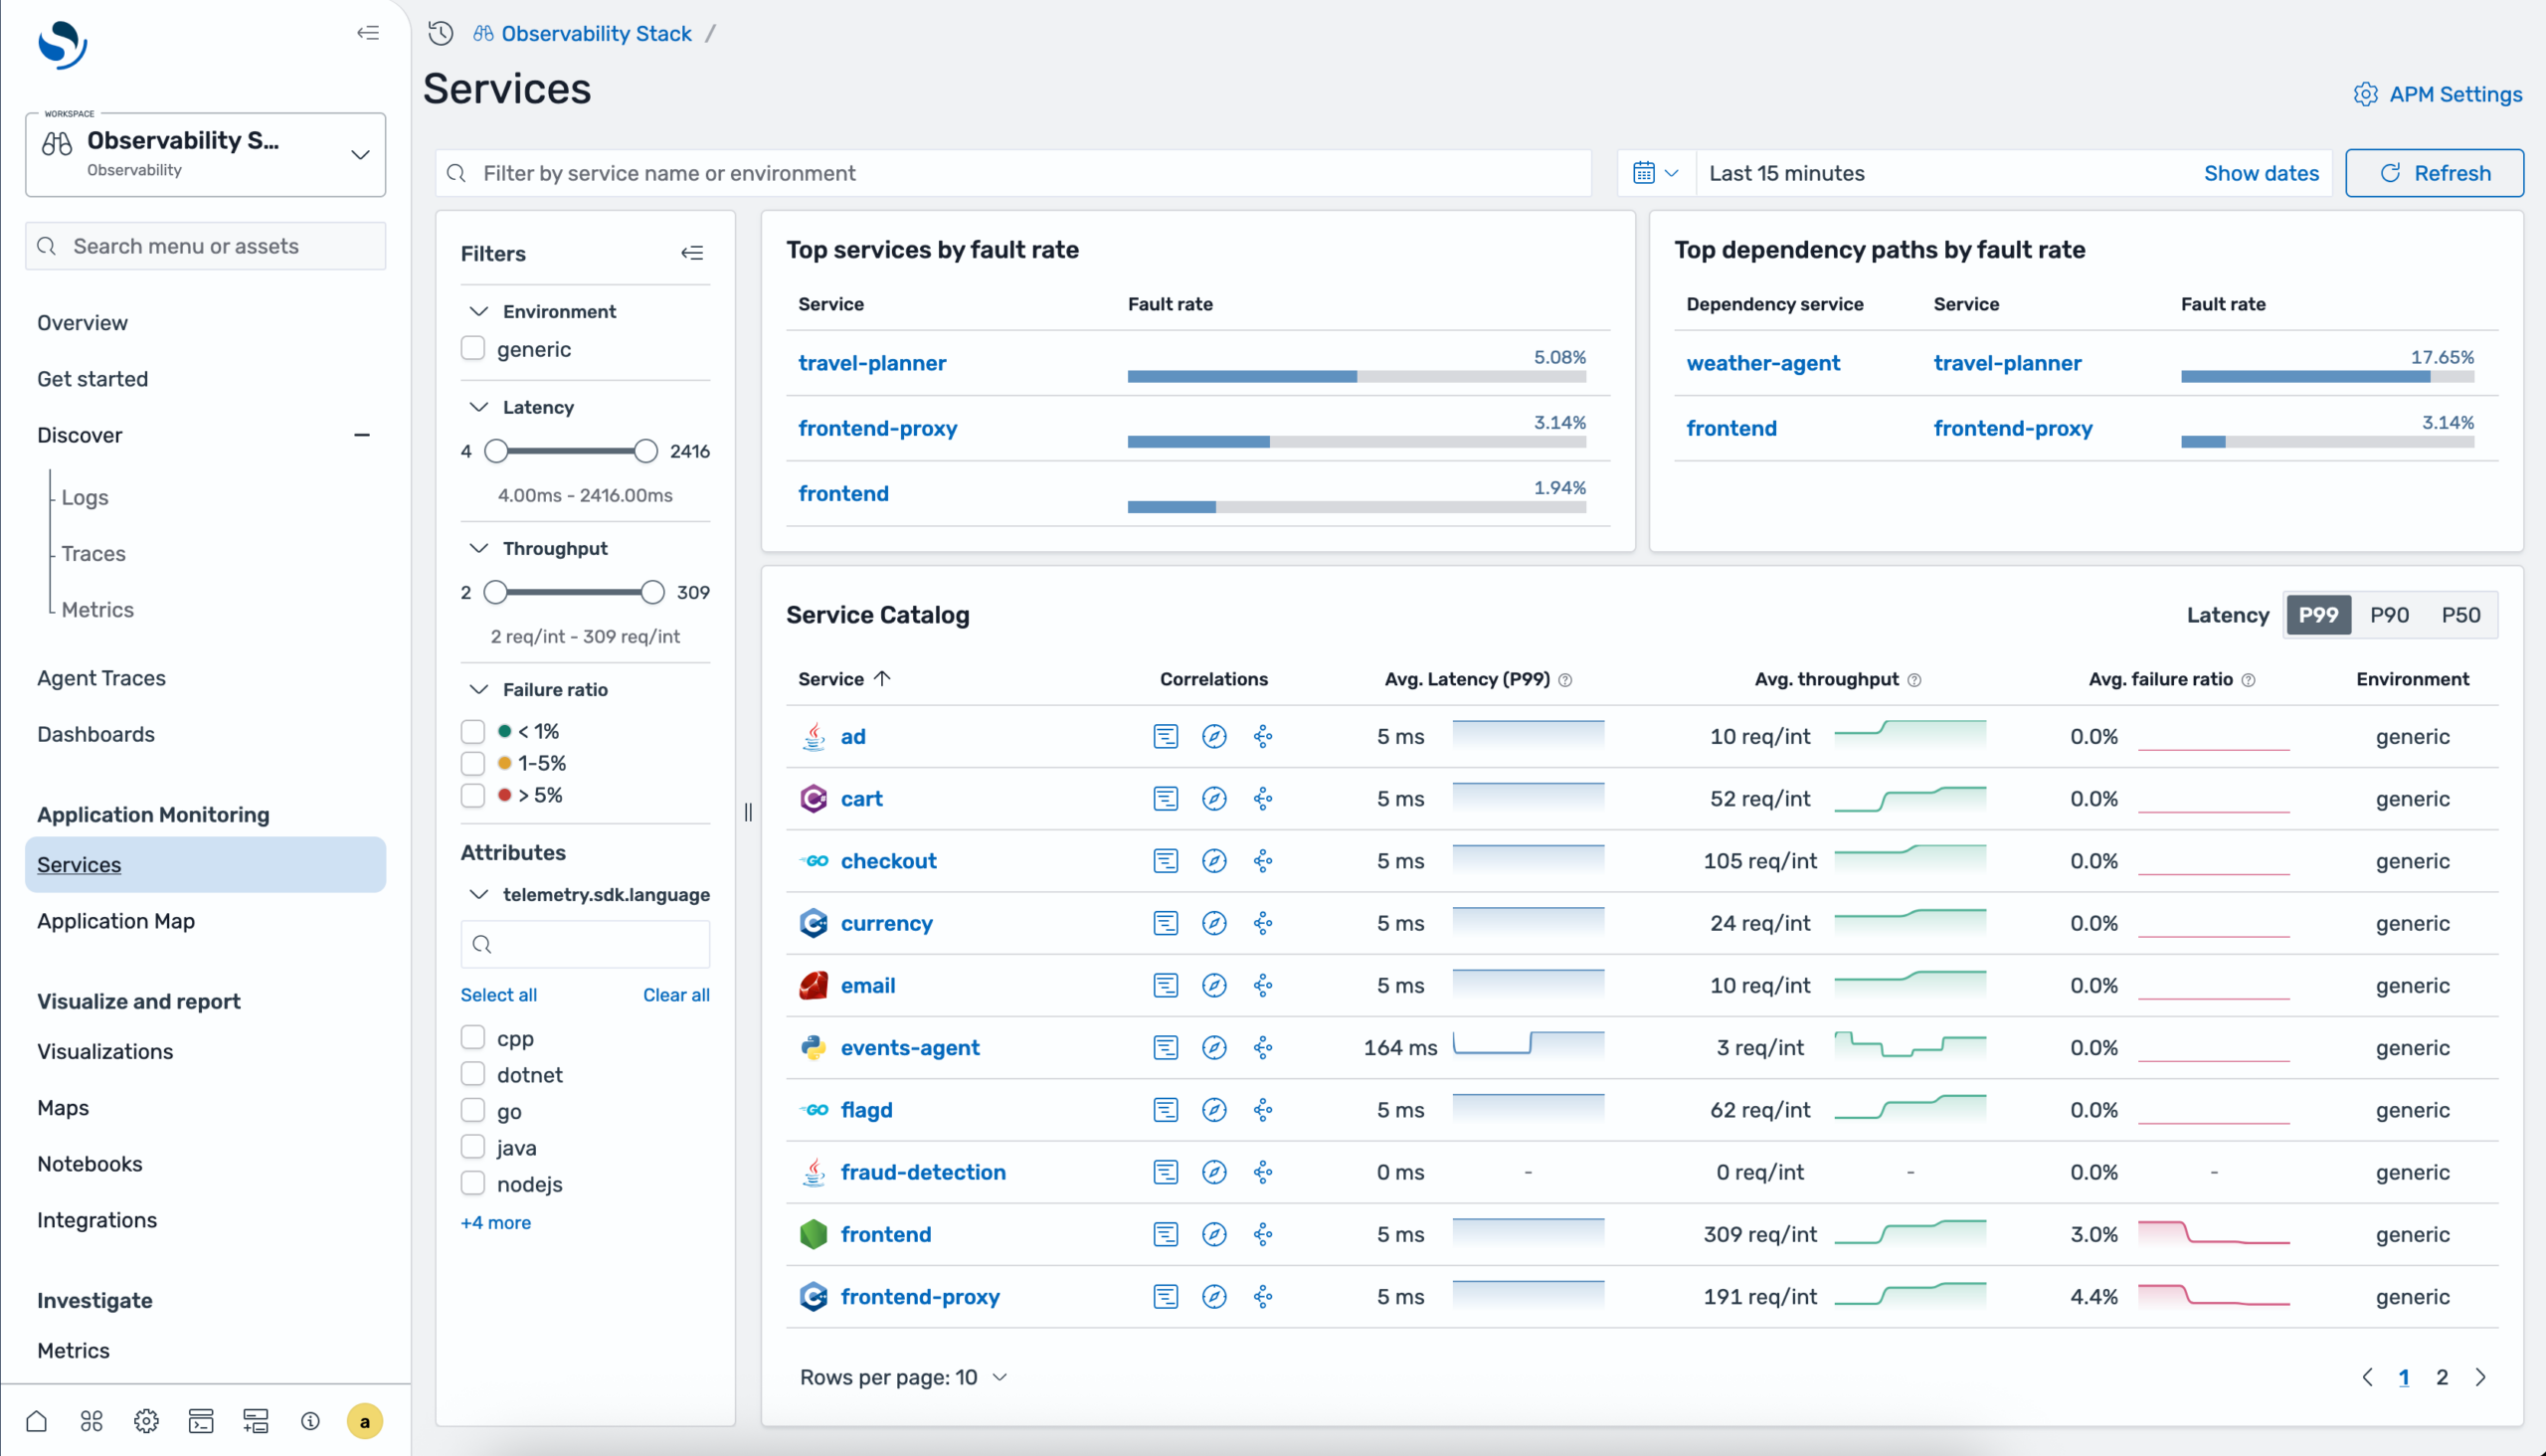 Application monitoring services catalog showing service list with RED metrics
You can group services by resource attributes like sdk language or teams, filter by error or fault rate thresholds, and select any node to view detailed time-series charts for requests, latency, and errors, with direct navigation to related traces and logs for root cause investigation.
Monitor generative AI applications with Agent Traces
OpenSearch 3.6 introduces Agent Traces for monitoring generative AI applications. Trace agent invocations, LLM calls, tool executions, and retrieval operations across your AI stack using OpenTelemetry-based instrumentation. A Python SDK provides decorators, enrichment functions, and auto-instrumentation for a variety of providers including OpenAI, Anthropic, Amazon Bedrock, LangChain, and LlamaIndex, with built-in support for frameworks like Strands Agents, LangGraph, and CrewAI. In OpenSearch Dashboards, the Agent Traces plugin renders execution flows as interactive DAG graphs, hierarchical trace trees, and Gantt-style timelines with synchronized views, token usage tracking, and span-level details to help you debug and optimize AI agents in production.
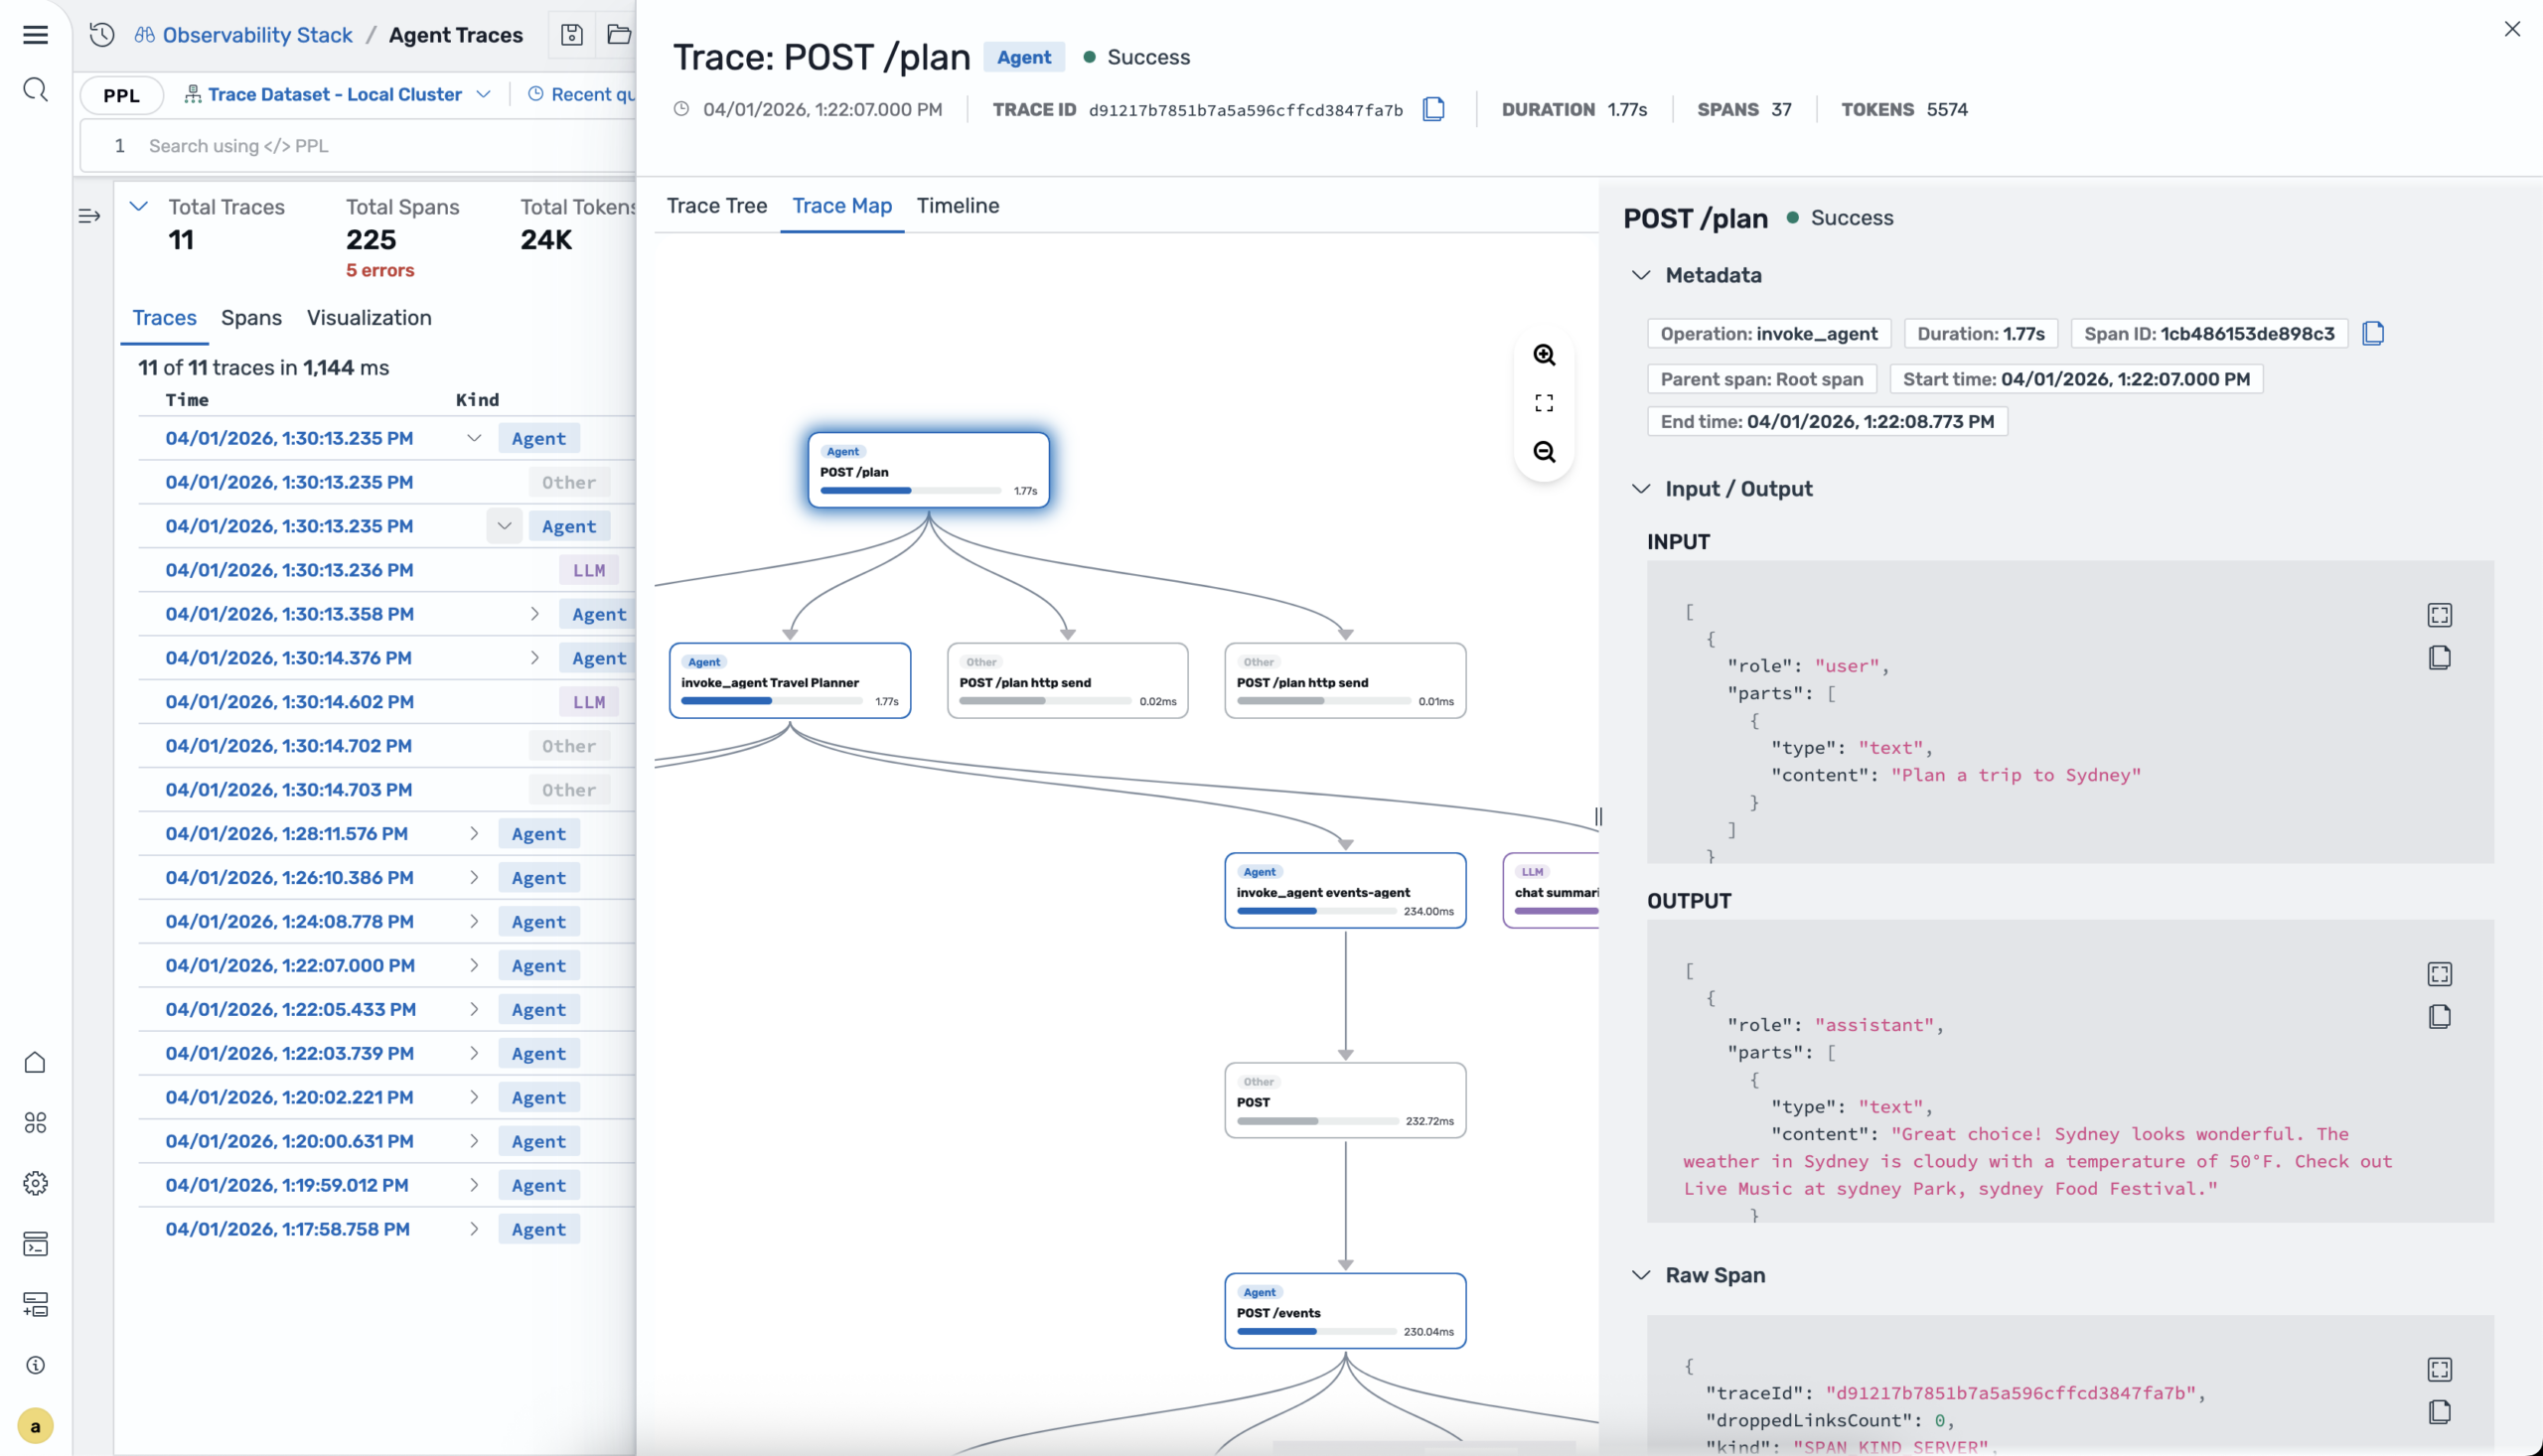 Agent trace map showing path of an agent and its subsequent API and LLM calls
Power up your queries with new and enhanced PPL commands
OpenSearch 3.6 delivers a range of updates for more powerful PPL query capabilities, including:
- External integrations– A new unified query library allows third-party tools such as Apache Spark, CLI tools, and customer applications to parse SQL and PPL queries into Calcite logical plans without depending on the OpenSearch plugin runtime. A new grammar bundle serves version-aware ANTLR metadata, enabling downstream client-side autocomplete without server calls. These libraries enable downstream client-side autocomplete based on OpenSearch version without server calls.
- Highlighting support– Search result highlighting lets you return matches in a top-level highlights array alongside datarows via a new highlight API parameter with configurable pre_tags and post_tags. The implementation supports a simple array format and the OpenSearch Dashboards workflows.
- Auto-extract mode for spath– Automatically discover and extract fields from JSON and structured data without explicit field names, simplifying analysis for semi-structured log data. The command also integrates with appendcol, appendpipe, and multisearch for flexible data enrichment pipelines.
- graphlookup command– You can now perform recursive graph traversal using breadth-first search, with multiple traversal modes. It’s now usable as a top-level command without requiring a preceding source command when the starting nodes are already known.
- Query cancellation & timeout– Cancel in-flight queries via Tasks API and configure automatic timeouts to prevent runaway queries from exhausting cluster resources, enhancing system stability.
Scalability and Resiliency
Enhance query debugging with user- and team-based access control
A new search.insights.top_queries.filter_by_mode unlocks self-service query debugging without requiring admin privileges, while maintaining data privacy in multi-tenant environments. The new setting determines query insights visibility based on user identity or team membership. In username mode, users see only their own queries; in backend_roles mode, users see queries from anyone sharing at least one backend role. Filtering applies across in-memory and historical data, and administrators with the all_access role always retain full visibility.
Improve query insights with automated recommendations
A new query insights recommendation engine can analyze your top N queries, identify problems and propose solutions. The engine inspects query structure and index metadata to detect anti-patterns, then generates specific recommendations with confidence scores and estimated impacts to latency, CPU, memory, and correctness dimensions. Recommendations are generated asynchronously off the search path with no impact to query performance, and custom rules are supported for your specific workloads.
Observe short-lived queries with cache layer
Query insights now supports a finished queries cache layer for the Live Queries API, enabling retrieval of recently completed queries alongside active ones — ideal for observing short-lived queries that would otherwise be missed. The API introduces two new query parameters: wlmGroupId for filtering by Workload Management group and use_finished_cache for including recently completed queries. The cache follows a dynamic lifecycle model, activating on demand and automatically deactivating after a configurable idle period to conserve resources. The restructured response model now provides a hierarchical view with top-level summary, coordinator task, and detailed shard task breakdowns, with ID continuity and linkage to Top Queries data for correlation across real-time and historical insights.
Access remote storage for top N queries
Query insights now allows you to move top N queries data to remote blob store repositories through a remote repository exporter. This provides a cost-effective, long-term storage option independent of the existing local index exporter. Exported data is written as JSON files organized by timestamp, with data retention managed by your bucket configuration rather than OpenSearch. The remote exporter currently supports Amazon S3 repositories; refer to the documentation for setup.
Add visualizations to top N queries
The top N queries page now features a Stats & Visualizations panel that displays P90 and P99 percentile stats by metrics, letting you explore query distribution attributes through an interactive pie chart and table. A new Performance Analysis section displays line chart and heatmap views with min, max, and average metric values to help you spot trends and anomalies over time. Together, these visualizations make it easier to identify performance bottlenecks, understand how queries are distributed, and take action to optimize performance.
Getting started
OpenSearch 3.6 is ready for download in your choice of distributions or for exploration on OpenSearch Playground with no download required. For more information, check out the release notes, documentation release notes, and updated documentation. Many thanks to the hundreds of contributors whose efforts made this release a reality. We look forward to hearing how the latest tools are helping you drive more powerful and performant applications on our community forum, project GitHub, or Slack instance.