
In search engines and machine learning, data normalization is essential for making fair and accurate comparisons between different features or scores.
Hybrid queries use multiple normalization techniques to prepare final results. The two main types are score-based normalization and rank-based combination. In score-based normalization, the default method—min-max normalization—doesn’t handle outliers well. (Outliers are data points that significantly differ from the rest of a dataset. In techniques like min-max scaling and z-score normalization, outliers can greatly impact results.)
In this blog post, we’ll introduce z-score normalization, a technique added in OpenSearch 3.0-beta1. We’ll explore what it is, why it matters, and how OpenSearch uses it.
What is z-score normalization?
Z-score normalization, also known as standardization, is a method of scaling data using mean and standard deviation. The formula for calculating the z-score is:
Z = (X – μ) / σ,
where:
- X is the original value.
- μ is the population mean.
- σ is the standard deviation of the population.
When to use z-score normalization
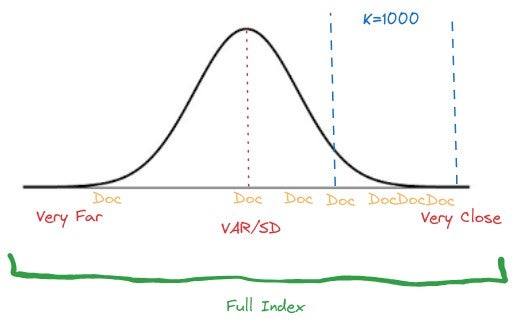
Your index’s structure can help you decide which normalization technique to use, as each has its own advantages. If your documents are highly similar and a typical query returns top-k results that are closely clustered together within the index (as shown in the following graph), min-max normalization may be the better choice.
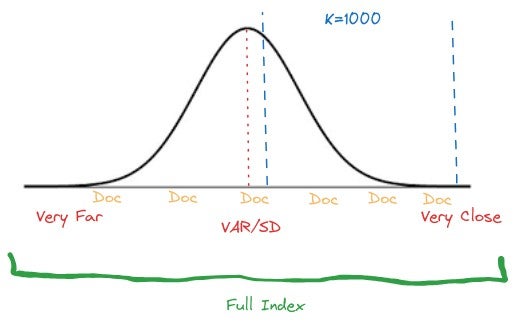
However, z-score normalization is a better choice if the results are more evenly distributed and follow a pattern similar to a normal distribution, as shown in the following graph.
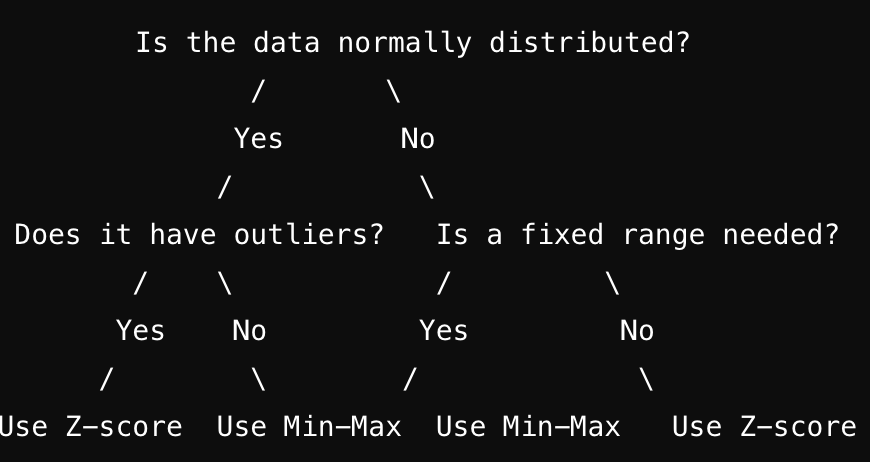
The basic process for choosing between min-max and z-score normalization is outlined in the following diagram.
How to use z-score normalization
To use z-score normalization, create a search pipeline and specify z_score as the technique:
PUT /_search/pipeline/z_score-pipeline
{
    "description": "Zscore processor for hybrid search",
    "phase_results_processors": [
        {
            "normalization-processor": {
                "normalization": {
                    "technique": "z_score"
                }
            }
        }
    ]
}
Next, create a hybrid query and apply the pipeline to the query:
POST my_index/_search?search_pipeline=z_score-pipeline
{
   "query": {
     "hybrid": [
         {}, // First Query
         {}, // Second Query
         ... // Other Queries
     ]
   }
}
Benchmarking z-score normalization for the development environment
Benchmark experiments were conducted using an OpenSearch cluster consisting of a single r6g.8xlarge instance as the coordinator node along with three r6g.8xlarge instances as data nodes with one shard. To assess z-score normalization performance comprehensively, we measured two key metrics across five distinct datasets. For more information about the datasets used, see Datasets.
Sample queries and passages
The following table provides sample queries and passages for each dataset.
| Dataset | Sample query | Sample passage |
|---|---|---|
| SciDocs | CFD Analysis of Convective Heat Transfer Coefficient on External Surfaces of Buildings | This paper provides an overview of the application of CFD in building performance simulation for the outdoor environment, focused on four topics... |
| FiQA | “Business day” and “due date” for bills | I don't believe Saturday is a business day either. When I deposit a check at a bank's drive-in after 4pm Friday, the receipt tells me it will credit as if I deposited on Monday. If a business' computer doesn't adjust their billing to have a weekday due date ... |
| NQ | what is non controlling interest on balance sheet | In accounting, minority interest (or non-controlling interest) is the portion of a subsidiary corporation's stock that is not owned by the parent corporation. The magnitude of the minority interest in the subsidiary company is generally less than 50% of outstanding shares, or the corporation would generally cease to be a subsidiary of the parent |
| ArguAna | Poaching is becoming more advanced A stronger, militarised approach is needed as poaching is becoming … | Tougher protection of Africa\u2019s nature reserves will only result in more bloodshed. Every time the military upgrade their weaponry, tactics and logistic, the poachers improve their own methods to counter ... |
| Touche-2020 | Is a college education worth it? | The resolution used by Pro *assumes* that Australia isn't already a 'significant' country - however, in actual reality, it is. Firstly we should clarify what significance means: 1.a the state or quality of being significant1.b of consequence or.. |
Search relevance was quantified using the industry-standard normalized discounted cumulative gain at rank 10 (NDCG@10). We also tracked system performance using search latency measurements. This setup provided a strong foundation for evaluating both search quality and operational efficiency.
NDCG@10
The following table compares NDCG@10 scores for hybrid search using min-max normalization and z-score normalization, showing the percent difference in search relevance across five datasets.
| Dataset | Hybrid (min-max) | Hybrid (z-score) | Percent difference |
|---|---|---|---|
| SciDocs | 0.1591 | 0.1633 | +2.45% |
| FiQA | 0.2747 | 0.2768 | +0.77% |
| NQ | 0.3665 | 0.374 | +2.05% |
| ArguAna | 0.4507 | 0.467 | +3.62% |
| Touche-2020 | 0.841 | 0.8542 | +1.54% |
| Average | 2.08% |
Search latency
The following table presents search latency measurements in milliseconds at different percentiles (p50, p90, and p99) for hybrid search using min-max and z-score normalization. The Percent difference columns indicate the relative performance impact of these methods.
| p50 | p90 | p99 | |||||||
|---|---|---|---|---|---|---|---|---|---|
| Hybrid (min-max) | Hybrid (z-score) | Percent difference | Hybrid (min-max) | Hybrid (z-score) | Percent difference | Hybrid (min-max) | Hybrid (z-score) | Percent difference | |
| SciDocs | 76.25 | 77.5 | 1.64% | 99 | 100.5 | 1.52% | 129.54 | 133.04 | 2.70% |
| FIQA | 80 | 81 | 1.25% | 104.5 | 105 | 0.48% | 123.236 | 124 | 0.62% |
| NQ | 117 | 117 | 0% | 140 | 140 | 0% | 166.74 | 165.24 | -0.90% |
| ArguAna | 349 | 349 | 0% | 382 | 382 | 0% | 417.975 | 418.475 | 0.12% |
| Touche-2020 | 77 | 77.5 | 0.64% | 100 | 100.5 | 0.50% | 140 | 140 | 0% |
| Average: | 0.70% | Average: | 0.50% | Average: | 0.50% | ||||
Conclusions
Our benchmark experiments highlight the following advantages and trade-offs of using z-score normalization instead of min-max normalization in hybrid search:
-
Search quality (measured using NDCG@10 across four datasets):
- Z-score normalization shows a modest improvement in search quality, with an average increase of 2.08% in NDCG@10 scores.
- This suggests that z-score normalization may provide slightly better search result relevance compared to the default min-max normalization.
-
Latency impact:
- Z-score normalization shows a small increase in latency across different percentiles, as shown in the following table.
Latency percentile Percent difference p50 0.70% p90 0.50% p99 0.50% - The positive percentages indicate that z-score normalization has slightly higher latency compared to min-max normalization, but the differences are minimal (less than 1% on average).
-
Trade-offs:
- There’s a slight trade-off between search quality and latency. Z-score normalization offers an improvement in search relevance (2.08% increase in NDCG@10) at the cost of a marginal increase in latency (0.50% to 0.72% across different percentiles).
-
Overall assessment:
- Z-score normalization provides a modest improvement in search quality with a negligible impact on latency.
- The choice between z-score and min-max normalization may depend on your use case. If search relevance is a priority, z-score normalization may be the better option, especially if your system can tolerate a small latency increase.
Benchmarking z-score normalization for the production environment
Benchmark experiments were conducted using an OpenSearch cluster consisting of a single r6g.8xlarge instance as the coordinator node along with 3 r6g.8xlarge instances as data nodes with 12 shards.
NDCG@mean
The following table compares NDCG@mean scores for hybrid search using min-max normalization and z-score normalization, showing the percent difference in search relevance across five datasets.
| Dataset | Hybrid (min-max) | Hybrid (z-score) | Percent difference |
|---|---|---|---|
| FiQA | 0.3105 | 0.3120 | +0.48% |
| NQ | 0.4563 | 0.4540 | -0.50% |
| ArguAna | 0.4713 | 0.4700 | -0.28% |
| Touche-2020 | 0.3788 | 0.3719 | -1.82% |
| Average | -0.53% |
P@mean
The following table compares precision at mean (P@mean) scores for hybrid search using min-max normalization and z-score normalization, showing the percent difference in search relevance across four datasets.
| Dataset | Hybrid (min-max) | Hybrid (z-score) | Percent difference |
|---|---|---|---|
| FiQA | 0.0921 | 0.0925 | +0.43% |
| NQ | 0.0943 | 0.0935 | -0.85% |
| ArguAna | 0.0878 | 0.0878 | 0% |
| Touche-2020 | 0.2364 | 0.2318 | -1.95% |
| Average | -0.59% |
Conclusions
Our production experiments highlight the following aspects of z-score normalization compared to min-max normalization in hybrid search approaches:
Search quality:
- Z-score normalization shows a slight decline in search quality, with an average decrease of 0.53% in NDCG@mean scores.
- P@mean results show a similar trend, with a 0.59% average decrease across datasets.
- Only the FIQA dataset demonstrated consistent improvements (+0.48% NDCG@mean, +0.43% P@mean).
- The largest decline was observed in the Touche-2020 dataset (-1.82% NDCG@mean, -1.95% P@mean).
Trade-offs:
- Production metrics indicate consistent but minor degradation in search relevance.
- Dataset size appears to influence performance, with larger datasets showing more pronounced decreases.
- The FIQA dataset demonstrates that z-score normalization can outperform min-max normalization in specific scenarios.
- Performance impact varies significantly across different datasets.
Overall assessment:
- Z-score normalization performs marginally below min-max normalization in production settings.
- Results suggest dataset characteristics significantly influence normalization effectiveness.
- Implementation decisions should prioritize specific use case requirements and dataset characteristics.
These findings indicate that while z-score normalization remains a viable option, min-max normalization demonstrates more reliable performance in production scenarios. The choice between methods should be based on thorough testing with specific datasets and use cases.
What’s next?
We’re continuing to enhance OpenSearch’s hybrid search capabilities beyond z-score normalization by implementing custom normalization functions. These will enable you to define your own normalization logic and allow fine-tuning of search result rankings. This enhancement will provide you more control over search result ranking while ensuring reliable and consistent hybrid search outcomes. For more information, see this issue.
References
- Normalization
- Hybrid Search 2.0: The Pursuit of Better Search
- [RFC] Z-Score Normalization Technique for Normalization Processor