
OpenSearch 3.5 is available for download, with significant upgrades for observability workloads and search use cases, new tools to build more powerful agentic applications, and a number of enhancements to help you optimize operations. New features for this release include:
- Expanded Prometheus support for deeper insights into metric data
- Enhanced search optimization through Search Relevance Workbench
- Agentic memory support for self-learning applications
- Increased control over query performance and efficiency
Read on for highlights from the latest version, and visit the release notes for a complete roundup of what’s new in OpenSearch 3.5.
Build powerful vector search and GenAI applications
Create smarter agentic applications with conversation memory
Agentic conversation memory gives your AI agents persistent, structured memory directly in OpenSearch. It captures conversation context, intermediate tool reasoning, and final responses in one place so agents can deliver more coherent follow-up answers. Your team can keep sessions continuous across requests, switch memory contexts when needed, and troubleshoot behavior with clearer traceability. Built-in validation helps surface misconfigurations early for safer rollout of production workloads.
Improve agent performance with hook-based context management
Context management empowers OpenSearch agents to dynamically optimize context before sending requests to large language models (LLMs). This avoids context window overflow, reduces token usage, and enhances long-running agents by intelligently managing conversation history and tool interactions. Context managers support automatic truncation, summarization, and sliding window strategies. The hook-based system can be activated at different agent execution stages, giving you flexibility to tailor configurations to specific use cases.
Boost vector search throughput without sacrificing results
This release brings performance improvements and enhanced capabilities to OpenSearch’s vector search engine, with efficient filters and a bulk SIMD implementation for faster FP16 vector operations, enhancements to the Lucene engine’s ef_search parameter, improved field exclusion in source indexing, and better handling of nested k-NN queries. The bulk SIMD implementation with memory-optimized search delivers 58% throughput improvement for FP16 vectors in multi-segment scenarios while maintaining 94% recall and achieves 28% performance gains in single-segment scenarios.
Build more powerful connections with external REST APIs
OpenSearch 3.5 enhances OpenSearch’s ML Commons connector framework with support for custom-named actions and additional HTTP methods (PUT and DELETE), enabling more flexible and powerful connector configurations for integration with external REST APIs. A new, optional name field in the connector action definitions lets you uniquely identify actions, enabling multiple actions of the same type within a single connector. For example, a connector can now define separate write, search, update, and delete operations all using the EXECUTE action type. Combined with extended HTTP method support, this enables comprehensive CRUD operations through a single connector configuration.
Bring real-time conversational AI directly to frontend applications
Added as an experimental feature in 3.5, support for the Agent-User Interaction (AG-UI) protocol standardizes how AI agents connect to user-facing applications in the ML Commons agent framework. This brings real-time conversational AI directly into user interfaces through event-based streaming interactions, unlocking responsive, interactive experiences in OpenSearch Dashboards and other frontend applications. As an example, this functionality lets you build applications like end-to-end, context-aware chatbots fully within the OpenSearch platform.
Drive deeper insights from telemetry signals
Explore and chart Prometheus metric data with a new Discover experience
Prometheus has become the de facto standard for metrics collection in cloud-native environments, widely adopted across Kubernetes deployments and modern infrastructure stacks. OpenSearch 3.5 expands support for Prometheus with a new Discover experience in OpenSearch Dashboards, enabling you to query and visualize metric data from Prometheus data sources directly alongside your logs and traces, as shown in the following image—eliminating the need to context-switch between multiple tools for a unified observability view. The release introduces autocomplete for Prometheus Query Language (PromQL) to facilitate faster development of complex queries as well as support for gauge metric types for easier monitoring of fluctuating values like CPU utilization or memory usage. Whether you’re using self-hosted Prometheus or Amazon Managed Service for Prometheus, this integration represents an important step toward comprehensive log, metric, and trace support natively within OpenSearch, streamlining your observability workflows within a single platform. To interact with metric data in Discover, refer to the documentation for configuration details.
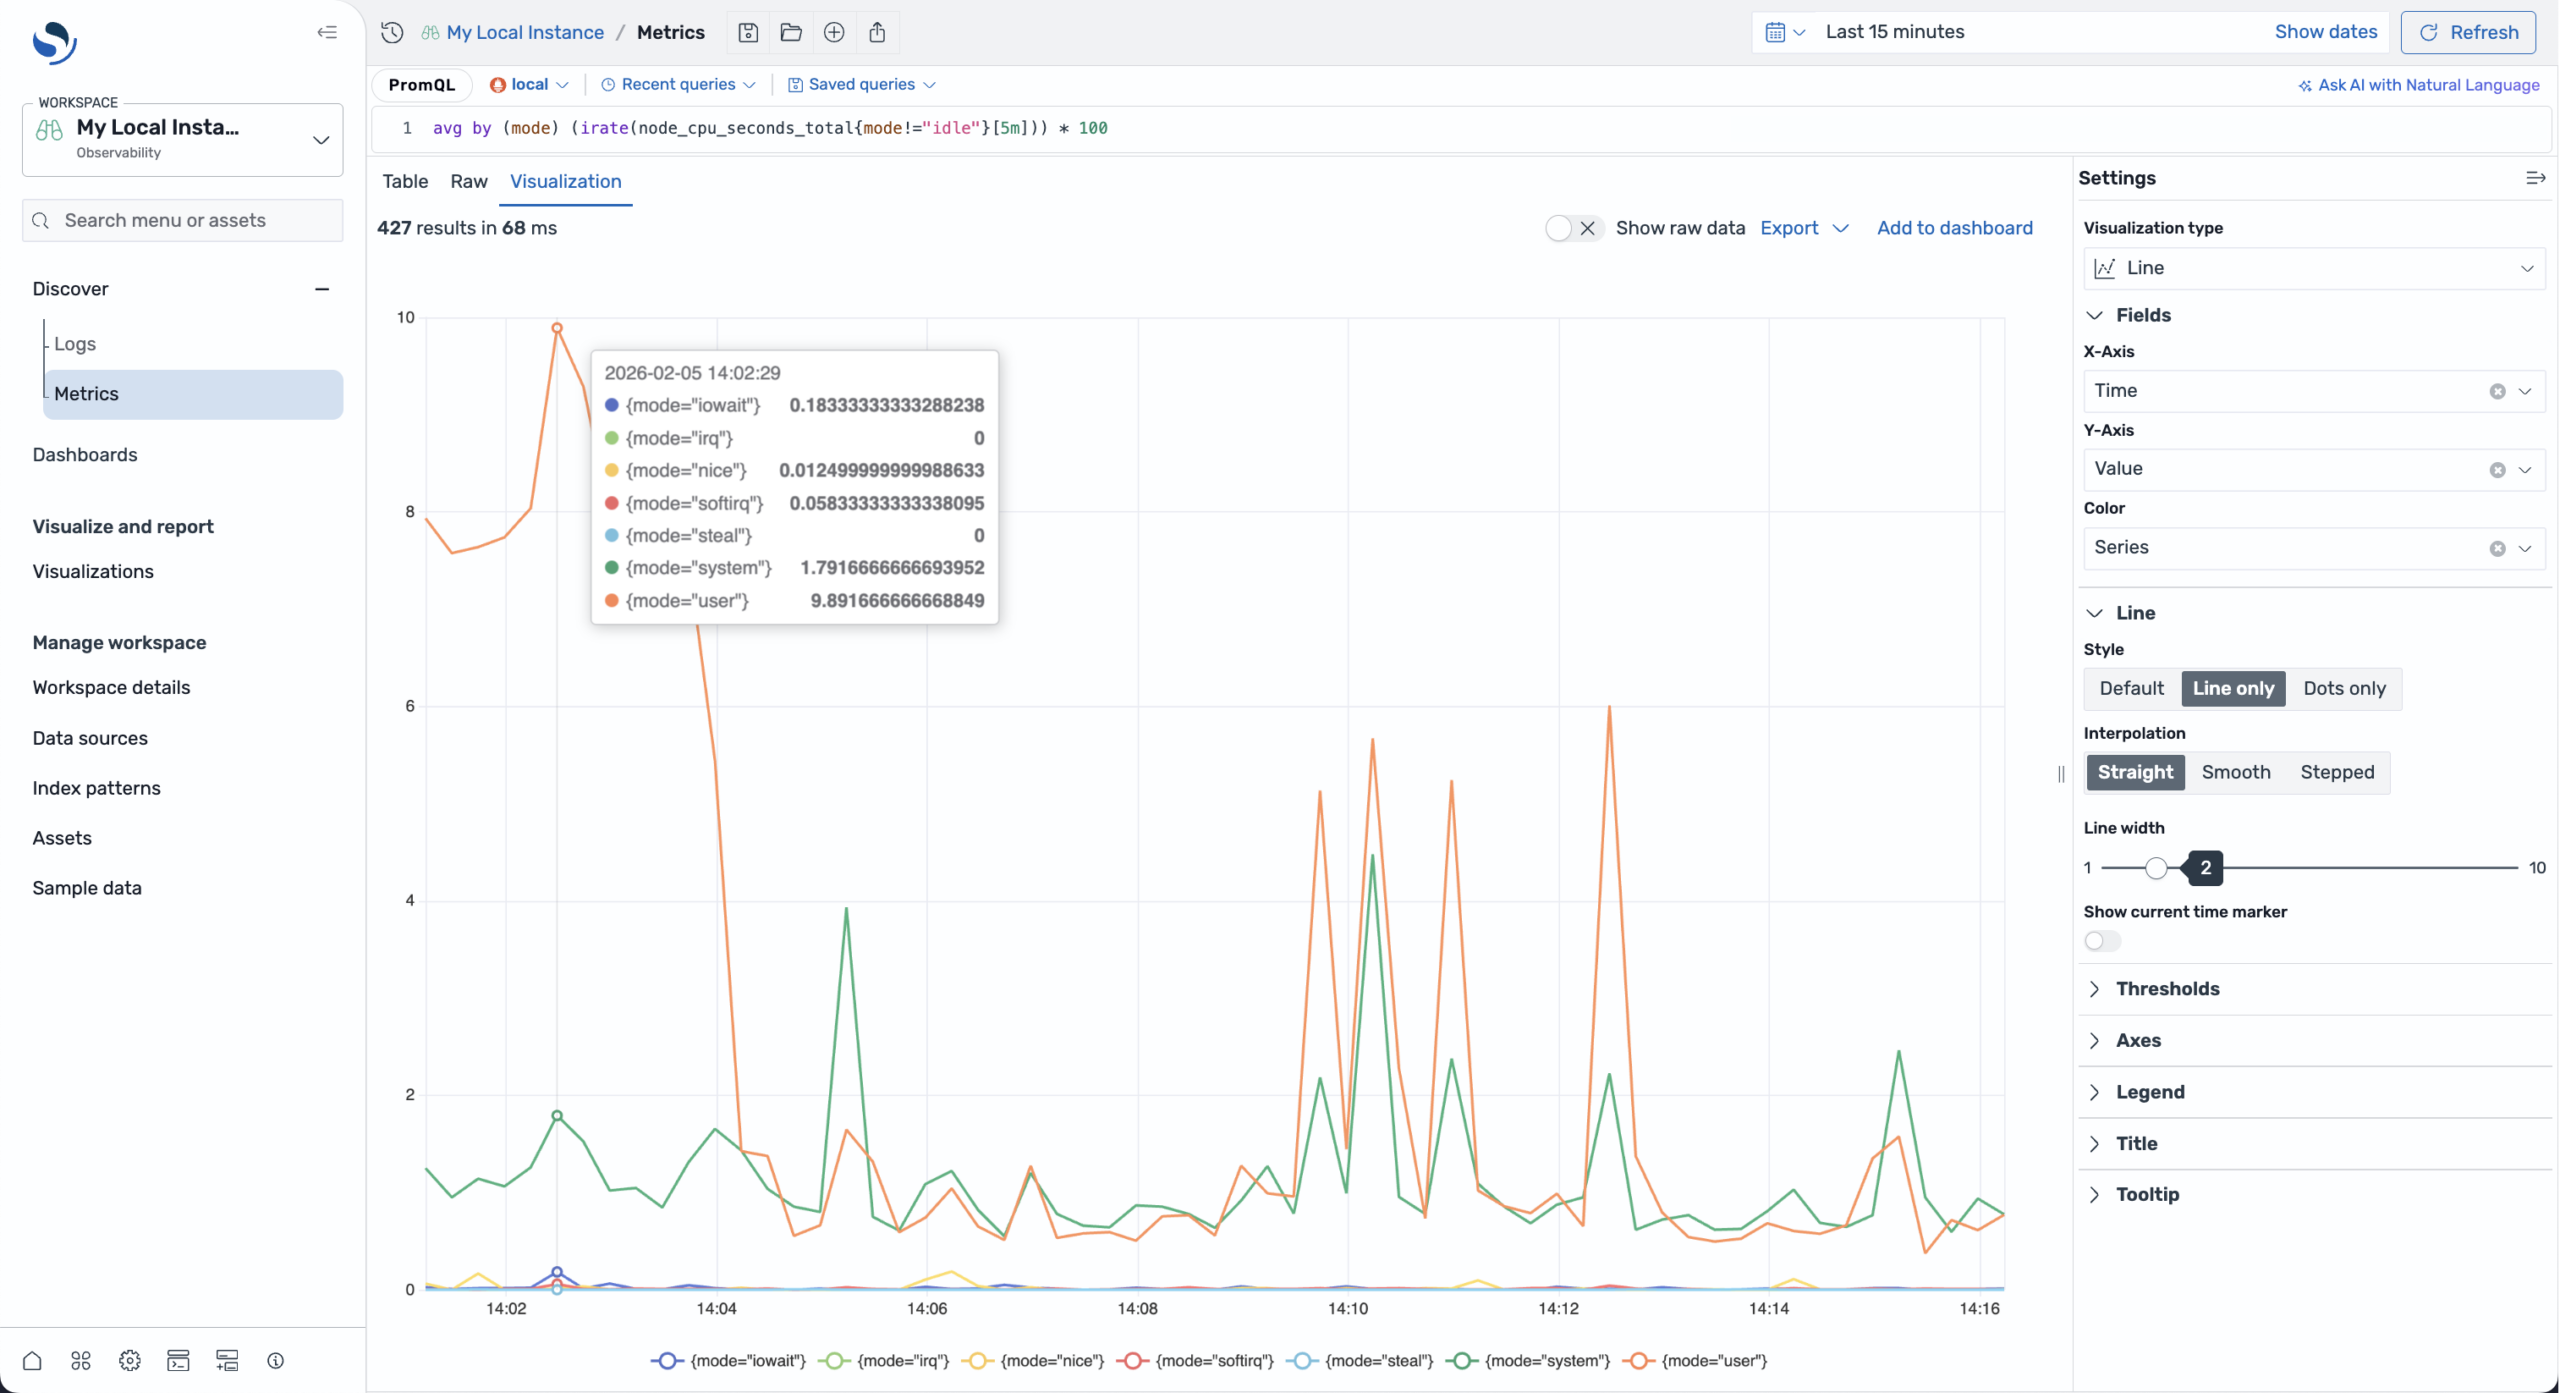 A multi-series line chart showing CPU utilization metrics from a local Prometheus instance.
Query and transform your data with sophisticated PPL tools
The release adds a number of new Piped Processing Language (PPL) functions and commands, giving you more ways to transform observability data into valuable discoveries. The mvcombine command lets you consolidate multivalue fields for simpler analysis when multiple field values share a common value. With the mvzip function, you can combine values from two multivalue fields and stitch them together. The mvfind function lets you search a multivalue array and return the index position of the first match of a specified value, while mvmap iterates over each value of a multivalue array, applies a given expression, and returns a new array containing the transformed results. Additionally, a new addtotals command shows the total of all columns of each row as a new column and gives the option to show the total of all rows of each column as a new row, and a new streamstats command performs cumulative statistical calculations as events are processed rather than computing final aggregates after a dataset is scanned.
Tune your search for increased relevance and better results
Optimize search results with LLM-powered evaluation
Search Relevance Workbench brings exciting new functionality that makes tuning for relevance easier and more powerful. You can now boost your testing with the introduction of LLM-as-judge. Use LLMs to automatically evaluate search results with customizable prompts and scale up your relevance testing when you’re ready to progress beyond manual judgments.
Take advantage of time-saving search relevance tools
Search Relevance Workbench also gains several enhancements for ease of use. Now you can reuse your search configurations with a simple query comparison UI for streamlined comparisons between different approaches. A new description field for search configurations makes it easier to document what each configuration does, and new search endpoints come with smart filtering options to help you find what you’re looking for faster. There’s also support for scheduled nightly or weekly evaluations to help you baseline search quality and new sample datasets and dashboards for User Behavior Insights, as shown in the following image.
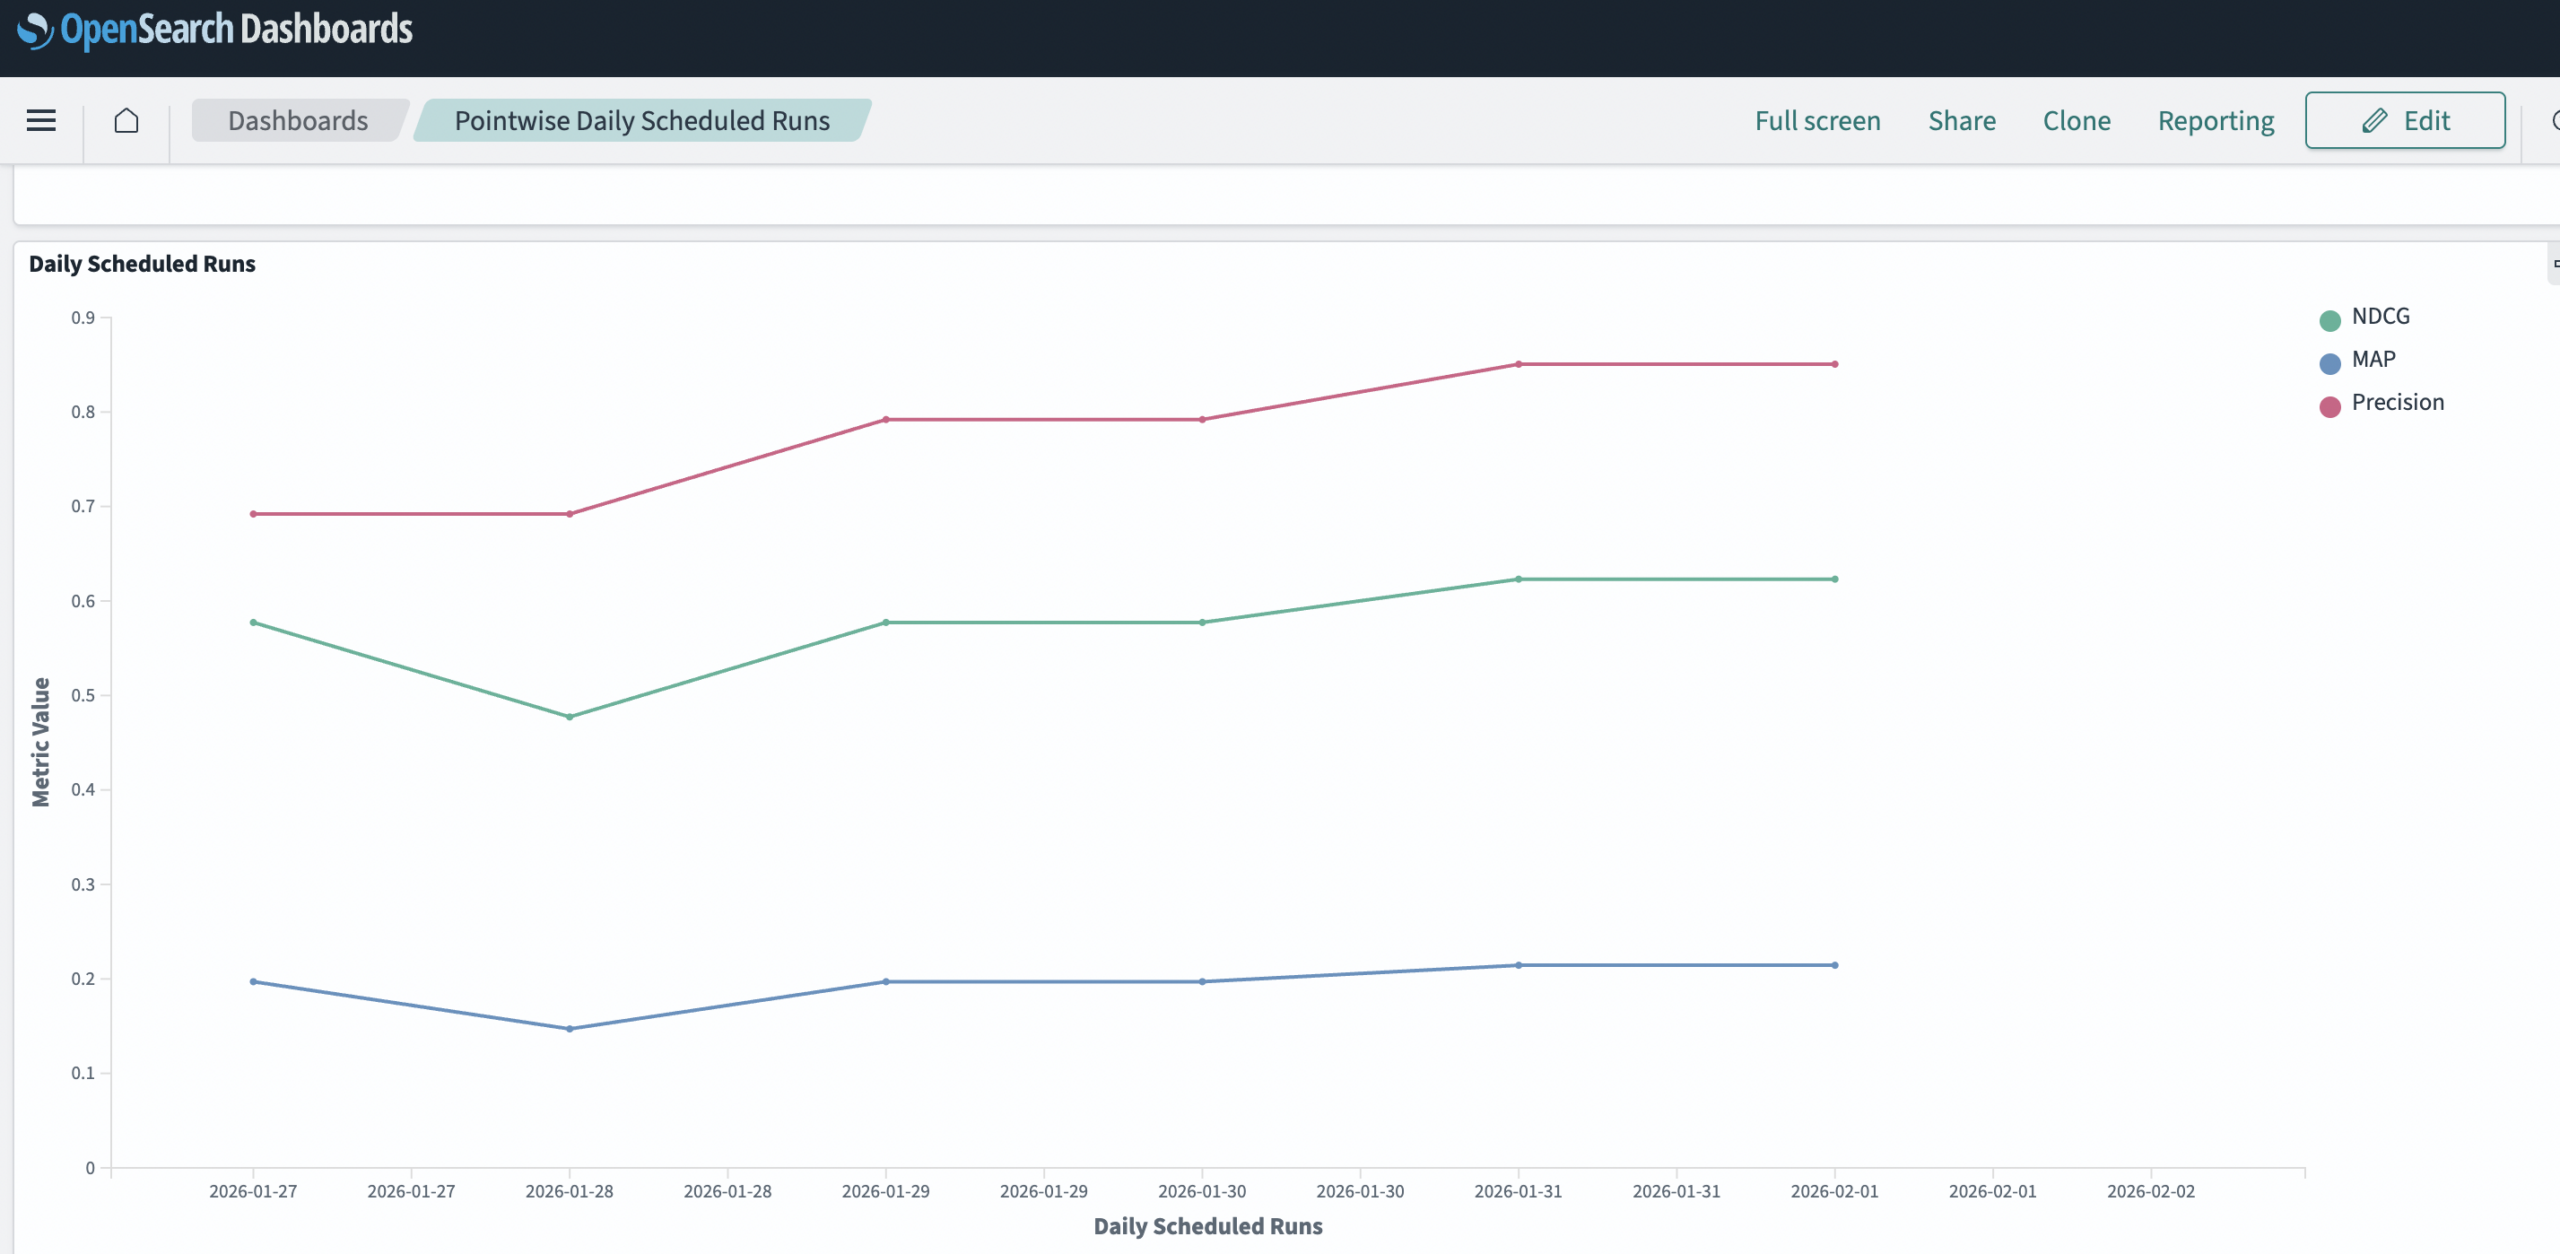 Daily scheduled Search Relevance Workbench experiments with results measured by Mean Average Precision (mAP), Normalized Discounted Cumulative Gain (NDCG), and precision search quality metrics.
Optimize query performance and efficiency
Learn what’s behind costly queries
Query insights now includes automatic username and user role capture for every query in the top N results, unlocking visibility into query ownership in shared environments for better operational intelligence. New username and user_roles fields appear alongside latency, CPU, and memory metrics in every query record. This context lets you identify which teams or roles are generating resource-intensive queries, make informed decisions about query optimization and resource allocation, and quickly connect with the right people when anomalous behavior is detected.
Secure query insights configurations for isolated deployments
New wrapper REST API endpoints give you more control over query insights configurations in multi-tenant environments. The new /_insights/settings endpoints provide narrow, purpose-specific access to query insights cluster settings, including metric configurations (latency, CPU, memory), grouping parameters, and exporter settings. This lets your admins implement fine-grained access control without exposing broader cluster configuration capabilities and enhance security for production deployments.
Optimize storage for complex queries
A new approach to storing query source fields significantly improves storage efficiency while maintaining data integrity. Query sources are now stored as strings in the local index instead of as complex objects, enabling reliable query insights collection regardless of query complexity and length. Benchmarks using production-scale workloads have shown a 58% reduction for average queries and a 49% reduction for large queries, and configurable truncation offers further storage optimization when full query sources aren’t needed.
Explore relationships between query performance and workload management policies
Workload management group assignments are now directly integrated into the query insights dashboard. A new workload management group column in the top queries table supports filtering and sorting, allowing you to quickly correlate query performance with resource allocation policies in a single view.
Infrastructure and architecture updates
Deprecating Node.js 20 and updating to 22; replacing Webpack 4 with Rspack
OpenSearch Dashboards will deprecate support for Node.js 20 in version 3.5.0 because version 20 reaches end-of-life as of April 2026 (refer to this notice from nodejs.org). Similarly, the project has replaced Webpack 4 with Rspack, a fast Rust-based JavaScript bundler with a webpack-compatible API, as discussed in this public RFC on GitHub. There were no breaking changes related to customer-facing APIs observed during the upgrade process.
Experimental HTTP/3 support
OpenSearch 3.5 introduces experimental support for the HTTP/3 protocol on the server side. Among other benefits, HTTP/3 uses the QUIC transport protocol over UDP, offering significant benefits in terms of network performance and resiliency compared to the TCP protocol employed by HTTP/2. To learn how to activate server-side HTTP/3, refer to the network settings documentation.
Getting started
OpenSearch 3.5 is available in a number of distributions on our downloads page, and you can explore OpenSearch’s visualization tools on OpenSearch Playground. For more information, check out the release notes, documentation release notes, and updated documentation. Please share your feedback on our community forum, and we invite you to connect with other OpenSearch users on the project’s Slack instance.