Data Prepper offers great capabilities for ingesting traces and logs into OpenSearch. Until now, that leaves out the third pillar of observability: metrics. Data Prepper 1.4.0 introduces support for metrics received via OpenTelemetry. This feature aligns nicely with the OpenTelemetry traces support in Data Prepper.
Why Ingest Metrics in OpenSearch?
At a first glance, OpenSearch offers great support for storing and analyzing any structured observability data. It provides powerful search and aggregation capabilities. Excellent visualizations support users in generating insights. The integration of Vega visualizations into the OpenSearch Dashboards lift the metrics use-case to a whole new level. It allows for even more powerful and interactive visualizations of the ingested metrics. OpenSearch already comes with monitoring plugins for alerting and anomaly detection, that nicely extends to metrics.
However, OpenSearch was not built as a time series database. Storing metrics will be a lot less efficient with regard to resource consumption in comparison to specialized solutions. You will need to configure index rollups or retention using index policies if you want to store metrics for longer periods of time.
OpenSearch can shine on special use-cases: high-cardinality data sets. Metrics at least consists of a name, a timestamp and a value. Additionally, attributes can be attached that describe the nature or origin of the metrics better. In time series databases, the number of different values of such attributes is called cardinality. Many of those specialized solutions become much less efficient if faced with high-cardinality attributes. This can cause higher storage volumes and higher response times. OpenSearch is much less affected by the cardinality.
Let’s say you count the number of your service request by a service key you issued to your customers. Depending on the number of service keys, you might get a high-cardinality metric. With a growing number of customers, the performance of your time series database might get worse and worse. This effect will be almost negligible in OpenSearch.
In summary, storing metrics in OpenSearch allows you to create powerful visualizations and use anomaly detection and alerting. You will be able to augment logs and traces by a careful selection of metrics to enhance your overall observability. You need to be mindful of the overall event rate, though. But you do not need to plan ahead for cardinality.
Solution Architecture
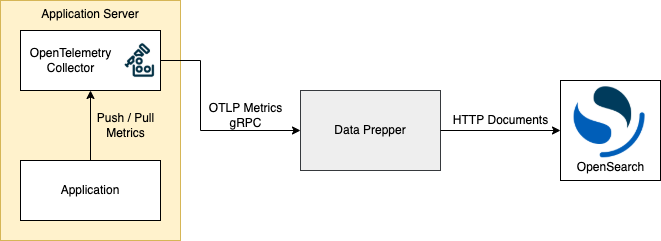
Data Prepper now supports metrics ingestion into OpenSearch using the OpenTelemetry protocol. There are many implementations capable of sending metrics using this protocol. The OpenTelemetry Collector was chosen as an agent for metrics acquisition in the following diagram. It can pull several metrics endpoints or act as a receiver for others. Metrics are sent to Data Prepper using the gRPC-based OpenTelemetry protocol. Data Prepper receives the metrics, dissects and maps their data points, and saves each data point as an individual OpenSearch document. The diagram outlines the basic architecture for metrics ingestion using OpenTelemetry collector, Data Prepper, and OpenSearch.
The OpenTelemetry metrics data model is described in great detail in its specification. Very briefly, metrics are divided into 5 different types:
- Sum
- Gauge
- Histogram
- ExponentialHistogram
- Summary
Each metric type has a specific data point format. For example, sums and gauges use single value data points, while histograms and summaries used nested arrays to represent buckets of data.
Correlation between different metrics as well as traces and logs is provided by attributes and trace/span ids. In OpenTelemetry the correlation to traces or spans is achieved with exemplars. Exemplars are a collection of data samples, that contributed to the calculation of an aggregated metric. Let’s say you are reporting the average response time of your application every 30 seconds. OpenTelemetry lets you add the response time of a number of requests during that period, that were used to calculate the average. One such entry called an exemplar would contain the trace and span id of the request.
Support for ExponentialHistograms and exemplars at the data points is not yet included in Data Prepper 1.4 but will follow in a future version.
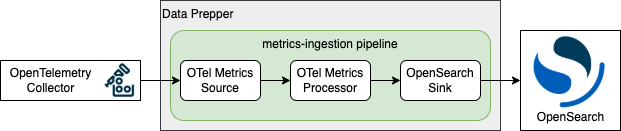
The Data Prepper OpenTelemetry metrics support consists of two plugins:
- The OTel Metrics source to deserialize the gRPC data,
- The OTel Metrics processor to preprocess the data points with regard to the metrics type.
The following diagram shows a prototypical pipeline:
Configuration
Setting up the OpenTelemetry metrics support is straight-forward. You just need to configure the source and processor plugins:
metrics-pipeline:
  source:
    otel_metrics_source:
  processor:
    - otel_metrics_raw_processor:
  sink:
    - opensearch:
      hosts: [ "https://opensearch.local:9200" ]
      username: username
      password: password
      index: metrics-otel-v1-%{yyyy.MM.dd}
The metric source supports the same configuration as the OpenTelemetry trace source.
Outlook
You can start analysing your metrics data in OpenSearch with the simple configuration outlined above. Data Prepper supports the full feature set of OpenTelemetry metrics, except for ExponentialHistograms and exemplars, both of which will be added soon. The generated documents allow for easy visualizations as well as advanced use-cases in OpenSearch. Enhance your observability with anomaly detection and alerts based on your custom metrics.