This post was imported from the Open Distro For Elasticsearch blog, a predecessor project of OpenSearch. Information reflected in this post may not be current or accurate.
The Open Distro for Elasticsearch Performance Analyzer captures Elasticsearch and JVM activity, as well as lower-level resource usage (e.g. disk, network, CPU and memory) of these activities. Based on this instrumentation, Performance Analyzer computes and exposes diagnostic metrics, with the goal of enabling Elasticsearch users and administrators to measure and understand bottlenecks in their Elasticsearch clusters. The Open Distro for Elasticsearch PerfTop client provides real-time visualization of these diagnostic metrics to surface bottlenecks to Elasticsearch users and operators.
Today, we are open sourcing the Root Cause Analysis framework for Open Distro for Elasticsearch. This new framework conducts real-time analysis of Performance Analyzer metrics to surface performance and reliability problems for Elasticsearch instances. The source code can be found here. We are excited to continue building out the Root Cause Analysis framework as a part of Open Distro for Elasticsearch, and invite developers in the larger search community to join in and collaborate with us on development, design, and testing. The feature includes a rich mix of distributed data flow graph processing, gRPC for networking, basic statistics for metric evaluation, systems work, and UI.
We believe this framework can significantly improve operations, administration, and provisioning of Elasticsearch clusters and help development teams to tune their workloads to reduce errors.
Model
We define a root cause as a function of one or more symptoms. A symptom is an operation applied to one or more metrics and/or other symptoms. Root causes may also be a function of other root causes. Note that these operations may involve aggregations; for example, a symptom could consume a time average of a metric. In addition, for confidence, a root cause could be a computation over a sufficiently long window of time. This definition does not allow for cycles in the dependency graph between metrics and root causes. The following equations show an example of these relationships:
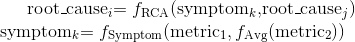
Note that any of the functions above can take metadata as inputs, such as thresholds.
Root causes can span the entire stack, from the infrastructure layers (e.g. the OS, host, virtualization layers, and the network) to the Java Virtual Machine to the Elasticsearch engine. Root causes also include problems related to the input workload to Elasticsearch.
System Design
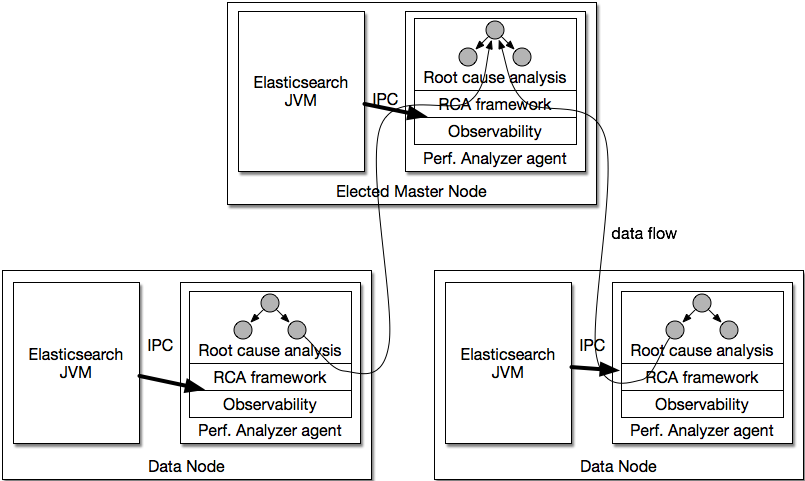
Based on the recursive model definition above, we build an acyclic data flow graph that takes metric streams generated by the Performance Analyzer plugin as input. Nodes of the data flow graph include computations such as metrics output (source nodes), aggregations, symptoms, and root causes (sink nodes). The data flow graph across all root causes would span all nodes of an Elasticsearch cluster (including master nodes).
Edges of the graph transfer the output of a parent node to all child nodes.The framework treats this output as an opaque stream since the data format between nodes is a contract between each pair of nodes. The framework explicitly requires nodes to send timestamps—this is necessary for a node to diagnose issues with a parent node and handle staleness in data (e.g. data delivered late). Message delivery is ordered and provides at most once semantics (i.e. messages could be dropped to keep up with stream rate); small message loss isn’t a significant issue for root cause analysis because such algorithms rely significantly on statistical data. The following figure shows the above equations as a data flow graph (sources and sinks are shaded):

The framework is also fault tolerant for Elasticsearch, JVM, and infrastructure performance and reliability problems. It exposes an API to query the current (or recent) set of diagnoses across some nodes or the entire cluster. The output could be used by diagnostic tools (e.g. the Performance Analyzer PerfTop) or automated control plane actions.
All RCAs must be registered with the framework. This allows the framework to de-duplicate computations and optimize the streaming runtime. It exposes root causes and their context for applications to consume. Note that the framework resides in the agent process, so it is isolated from failures and performance problems in the Elasticsearch JVM. The architecture is shown below.
The framework is designed to be fast and compute root causes in parallel. It executes each graph node in topological order as defined in the analysis graph. Nodes with no dependency are executed in parallel. If a host depends on a remote data stream for RCA computation, it subscribes to the data stream on startup. Subsequently, the output of every RCA execution on the upstream host is streamed to the downstream subscriber.
Summary
In this blog post, we introduced the real-time root cause analysis feature in Open Distro for Elasticsearch. It runs asynchronously as a side-car agent and has very low overhead, which makes it suitable to run within the cluster without impacting cluster performance. We covered the basic concepts used in the framework and the system architecture, which makes root cause analysis process seamless.
We’re planning to build out functionality around identifying JVM bottlenecks and handling complex root causes for performance. We are excited for the future of real-time root cause analysis for Elasticsearch and welcome you to come join in and contribute with us in building the root cause analysis framework in Open Distro for Elasticsearch.