Application performance can mean the difference between retaining or losing a customer, between peak productivity or falling behind. When apps perform poorly, you need to know right away. OpenSearch provides a comprehensive toolkit for building complete and secure performance monitoring solutions to maintain smooth operations for your critical systems and infrastructure.
Identify the causes of poor performance

Network latency from poor server performance, congestion, or interference

Datacenter outages arising from human error, software updates, or hardware failures

Programming errors like poorly tuned queries, software bugs, or inefficient memory management
See what you can accomplish through performance monitoring with OpenSearch
Get real-time monitoring and problem detection
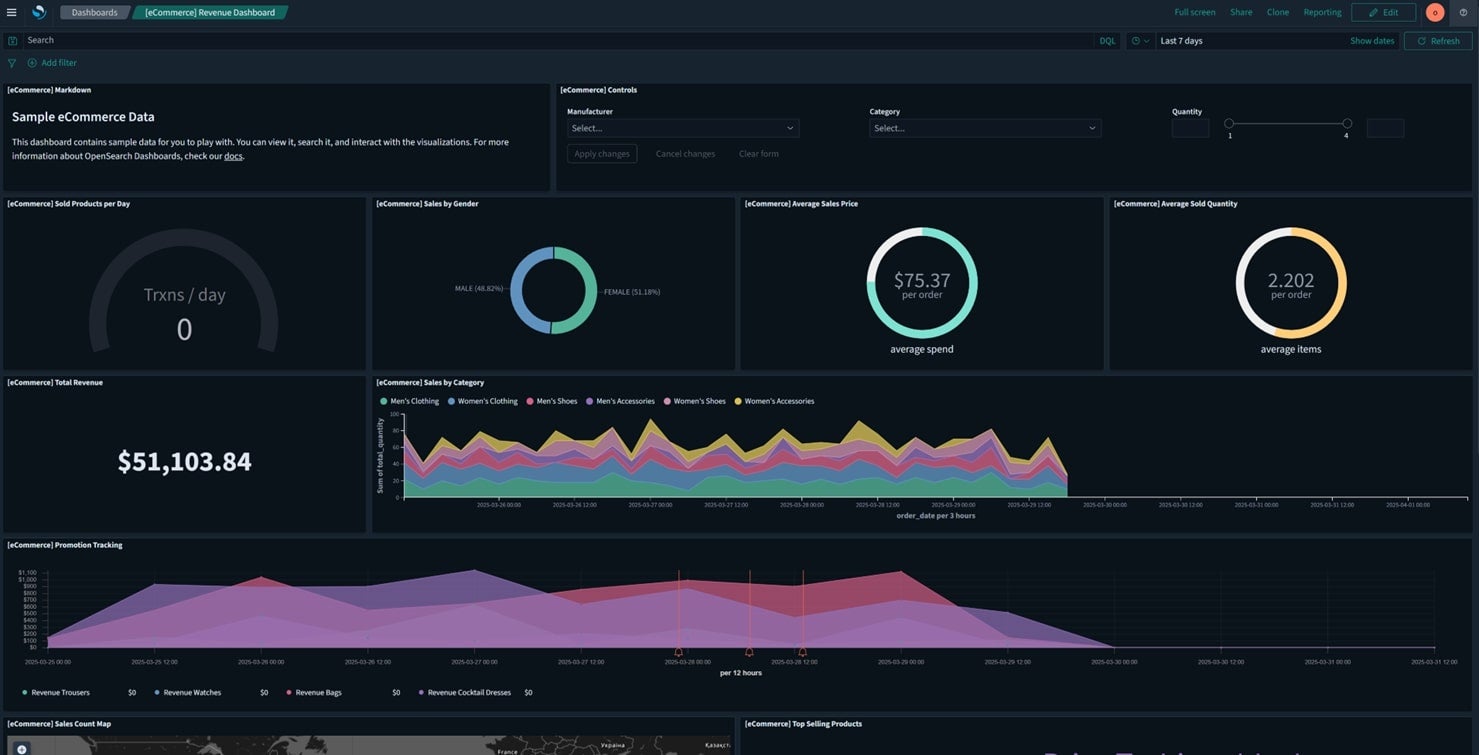
De-silo monitoring data, proactively detect issues, and enable efficient root cause analysis to manage performance problems before they become breakdowns. OpenSearch’s real-time data ingestion capabilities, Performance Analyzer, and customizable dashboards put up-to-date monitoring information at your fingertips.
Explore performance monitoring with OpenSearch
Optimize customer experiences and internal operations through greater observability at any scale
OpenSearch lets you build robust, efficient performance monitoring solutions to improve reliability, streamline operational efficiency, and drive better outcomes.

Informed decision-making
Make data-driven decisions around resource allocation and strategic planning through comprehensive performance data and insights.

Reduced operational costs
Significantly reduce the time and resources required for manual troubleshooting and maintenance by automating detection and resolution for performance issues.

Improved reliability and uptime
Proactively monitor performance metrics over time and rapidly detect and address issues to keep your organization’s critical infrastructure reliable and available.

Scalability and future-proofing
Seamlessly expand your performance monitoring capabilities through OpenSearch’s scalable and flexible architecture as your infrastructure and data volume grow.

Enhanced operational efficiency
Quickly identify and resolve performance bottlenecks through OpenSearch’s advanced discovery and analytics capabilities to optimize your teams’ systems and workflows.
Custom solutions powered by intelligent, scalable, highly adaptable features
Real-time data ingestion and indexing
Real-time data ingestion capabilities enable continuous collection and indexing for performance-related metrics, logs, and events from an array
of sources, making sure that your monitoring data is always up to date.
Anomaly detection and alerting
Machine learning capabilities including the Anomaly Detection plugin identify performance issues and generate alerts to help you address problems before they escalate.
Flexible querying
and visualization
Our advanced query language and domain-specific language (DSL) let you create complex queries and visualizations to analyze performance data and unlock features like ad-hoc search, dashboarding, and custom reporting.
Integration with existing toolsets
Seamlessly integrate OpenSearch with a wide range
of monitoring and observability tools so you can maintain continuity with your existing investments and workflows.
Scalable and distributed architecture
OpenSearch’s distributed and highly scalable nature allows organizations to ingest, store, and analyze large volumes of data without compromising system performance.
At-a-glance visibility into app performance
The Trace Analytics plugin delivers instant visibility into application performance using OpenTelemetry (OTel) protocol data. By standardizing telemetry collection across cloud-native software, it simplifies monitoring and ensures consistent insights.
Tracing and correlation
Gain at-a-glance visibility into application performance based on OpenTelemetry (OTel) protocol data that standardizes data collection from cloud-native software.
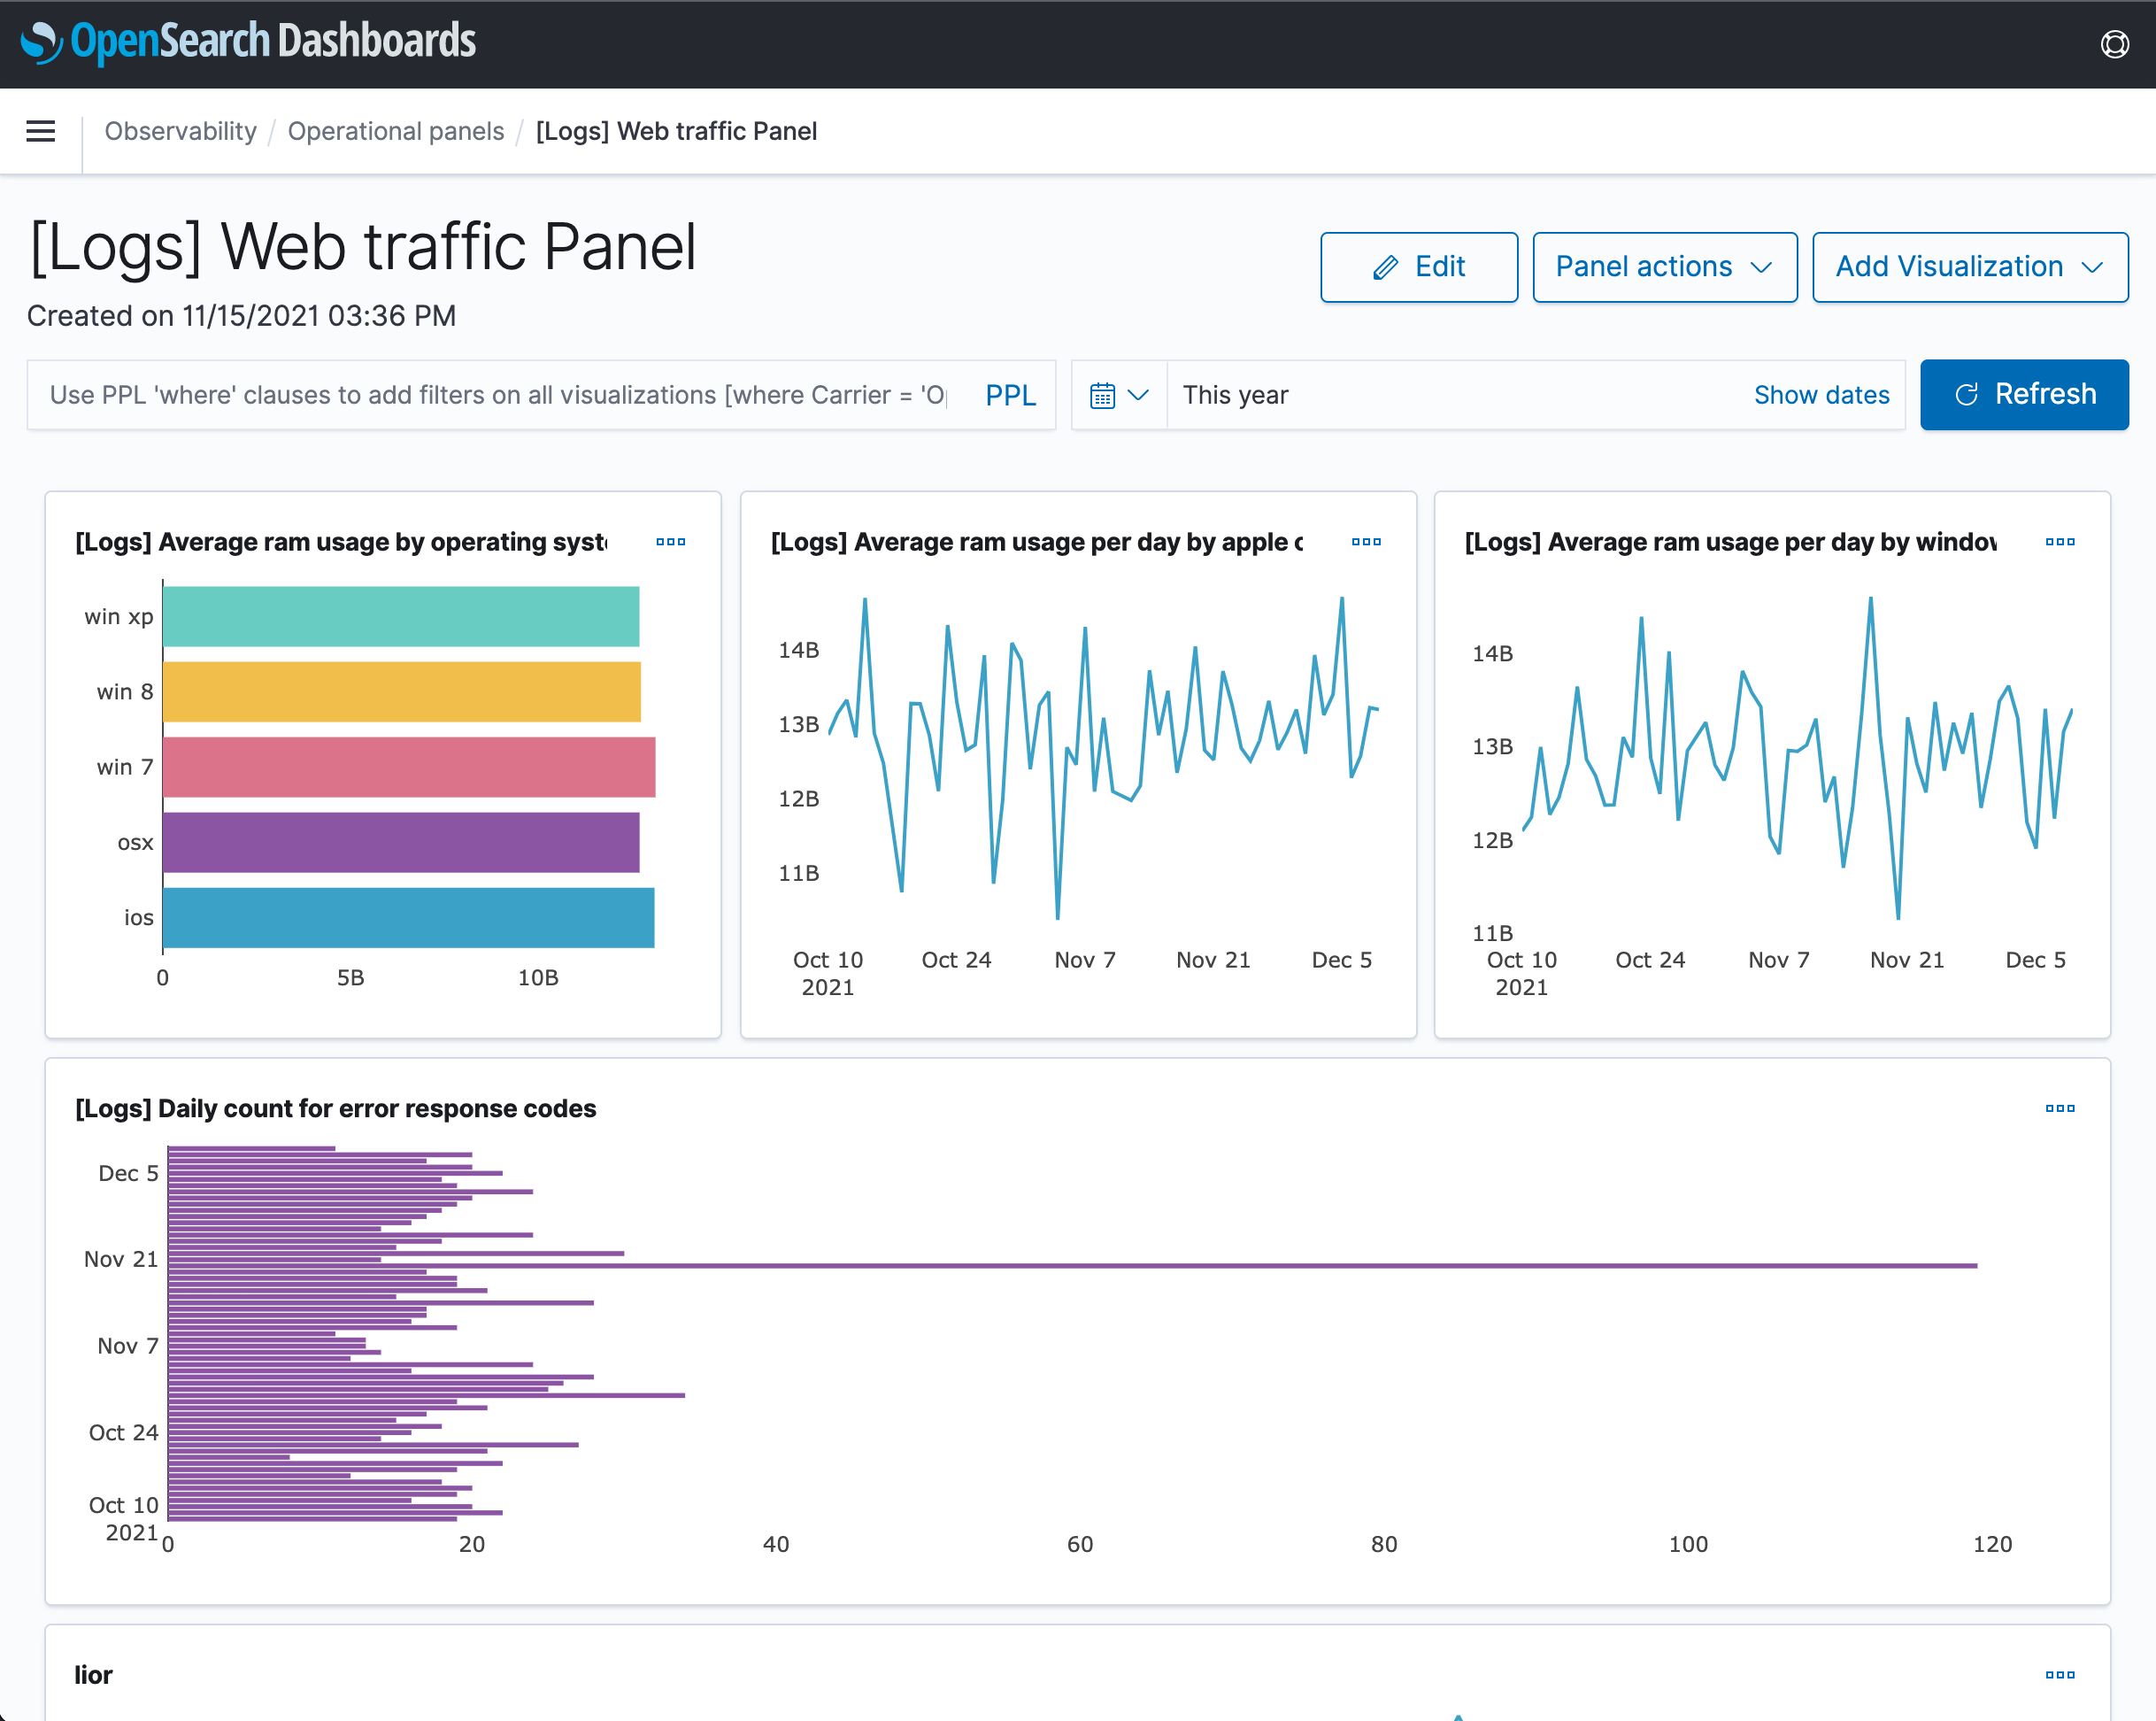
OpenSearch Dashboards Playground
Experiment with OpenSearch’s performance monitoring capabilities with sample datasets and visualizations in our free demo environment.
Come try it out