OpenSearch Dashboards’ visualization toolset provides a flexible, fully integrated solution for exploring, querying, analyzing, and understanding your data in real time. Out-of-the-box components for discovery, trace analytics, alerting, and more provide comprehensive visibility to complement powerful OpenSearch Observability capabilities.
By visualizing your data in custom dashboards and interactive charts, you can translate complex, high-volume, or numerical data into a visual representation that’s more straightforward to process. The result is a high-level view of key metrics, easier data exploration, and more intelligent insights.
A full-featured visual environment to power better analysis
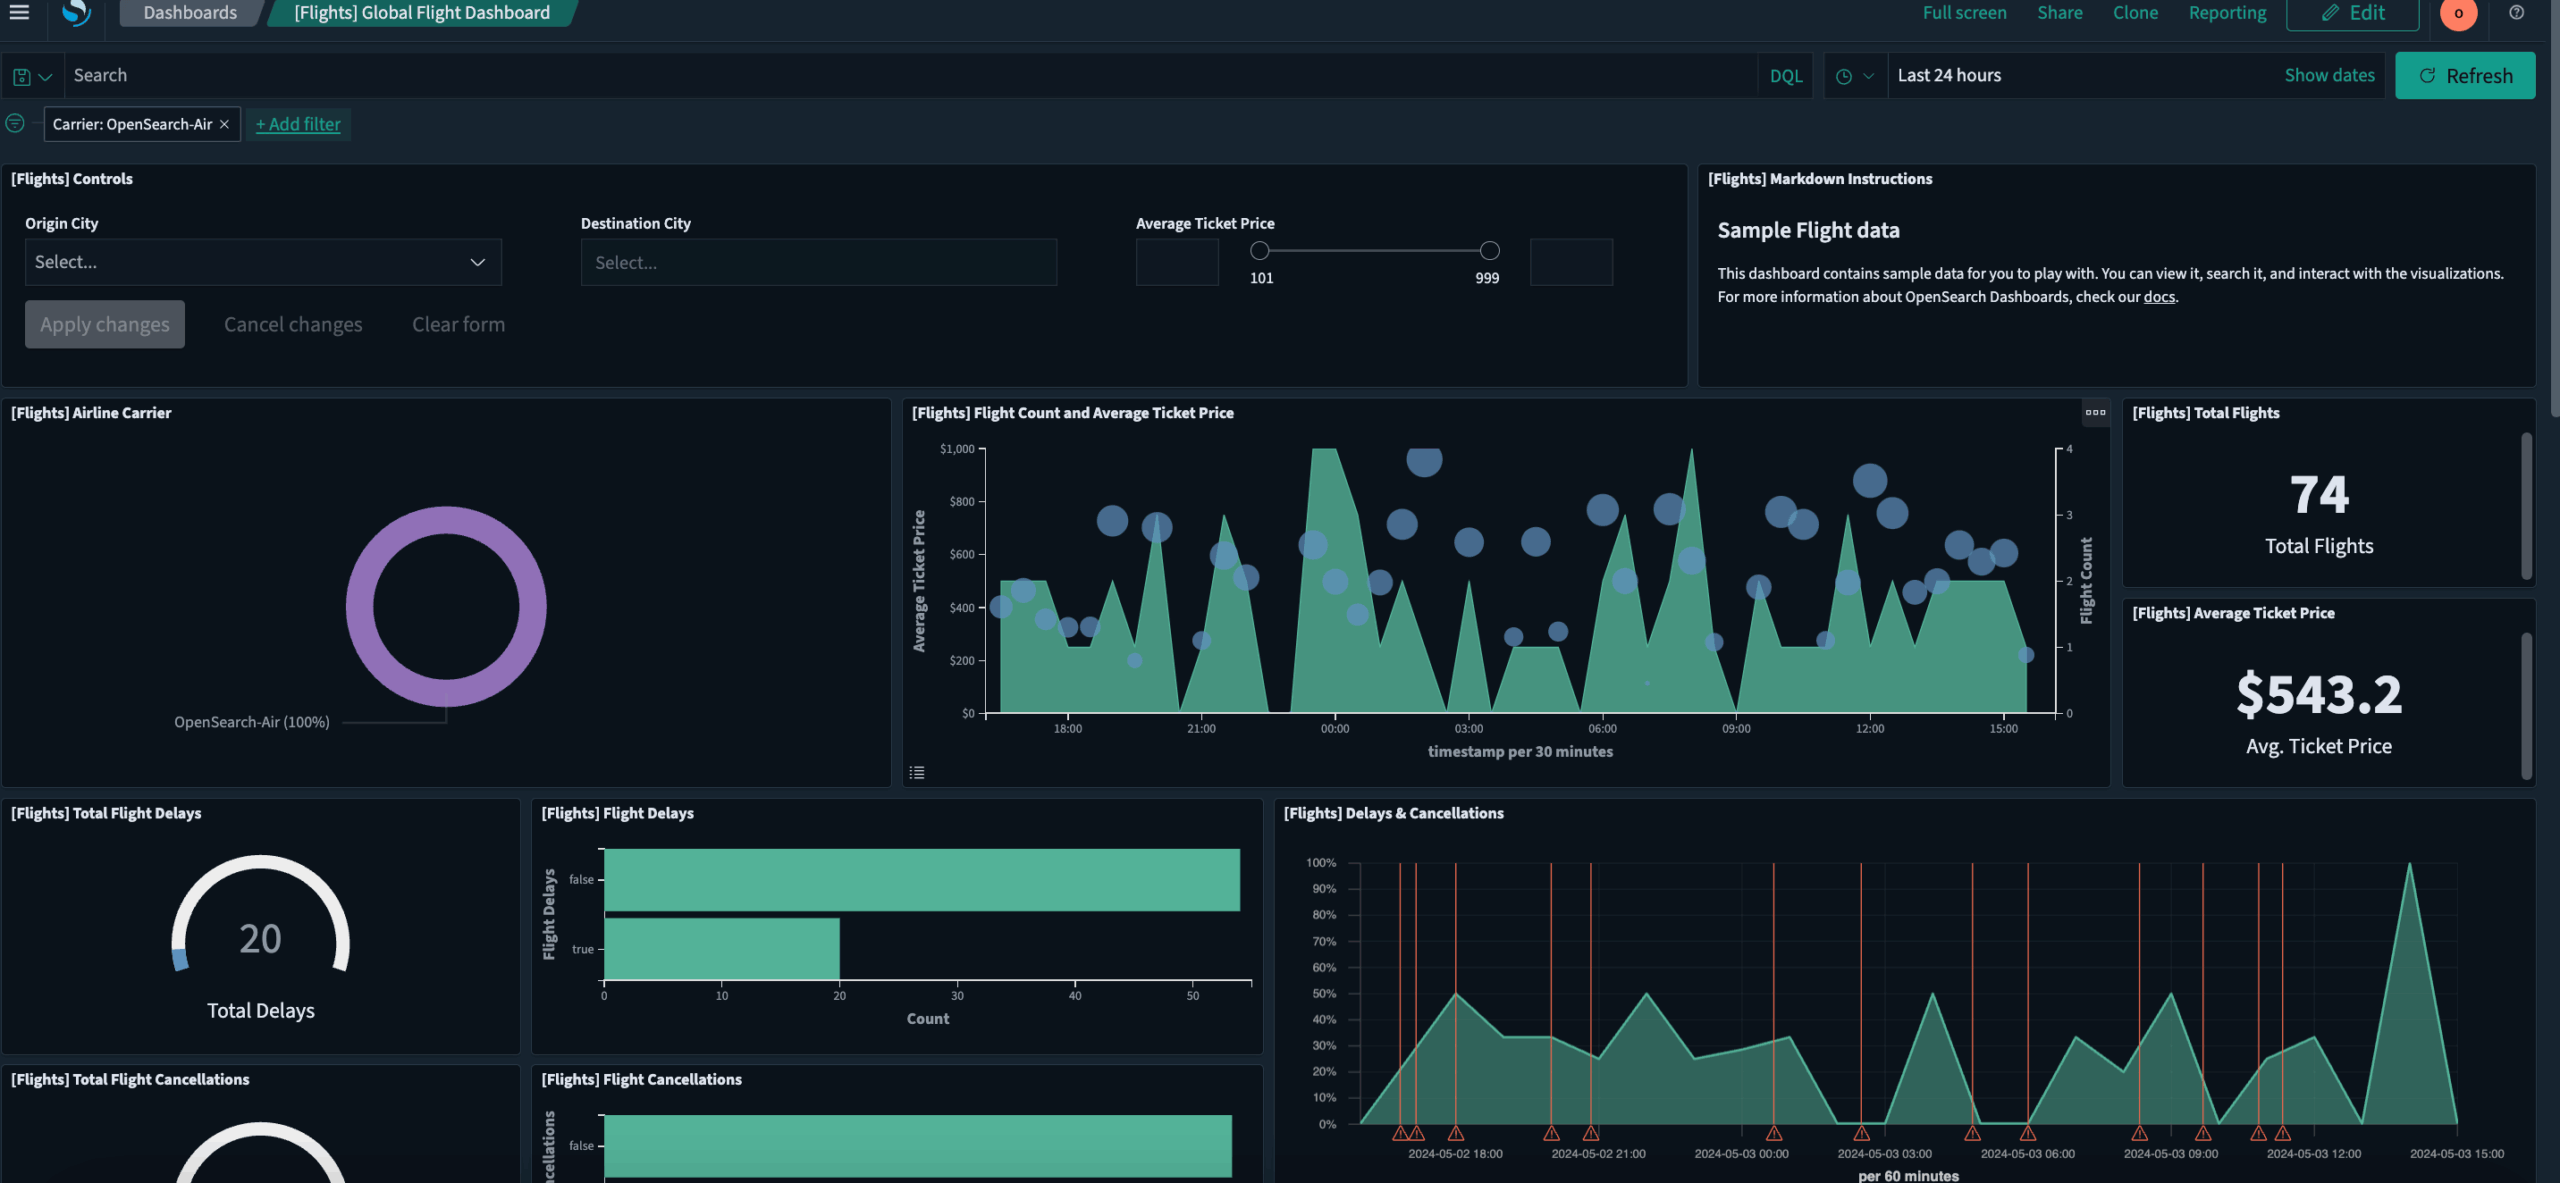
Custom visualizations and dashboards
Give developers and analysts the freedom to customize, integrate, and extend visual analytics through a fully open source platform.
AI-powered OpenSearch Assistant
Create AI-powered assistants for OpenSearch Dashboards without the need for specialized query tools or skills.
Developer tools
Set up your environment, run queries, explore data, and troubleshoot issues through one interface.
Trace analytics
Gain at-a-glance visibility into application performance based on OpenTelemetry (OTel) protocol data through the Trace Analytics plugin.
Dashboards Query Language
Run more advanced, custom searches against your data using the OpenSearch Dashboards Query Language (DQL).
Search telemetry
Analyze search request performance by success or failure using telemetry data stored in the .kibana_1 index.
Notebooks
Combine code snippets, live visualizations, and narrative text in a single notebook interface.
Workspaces
Customize environments for specific observability use cases to keep assets orderly.
Putting customization to work your way

Modular architecture and flexible components
A modular architecture designed for speed, flexibility, and scalability forms a foundation for reusable packages, plugins, and integrations that enable extension and customization.

Tool-agnostic integrations
The Integrations application in OpenSearch Dashboards gives developers and analysts the freedom to customize, integrate, and extend visual analytics.

Flexible queries
Compatibility with a variety of query languages, including SQL, DSL, and PPL, unlocks different levels of simplicity and complexity that work for diverse settings and tasks.

Adaptable outputs
OpenSearch Dashboards provides dynamic, highly scalable dashboards with a wide range of visualizations that operate with minimal latency.

Alerting
By creating, managing, and taking action on your alerts in a single consolidated view, you can resolve issues more quickly and avoid pane-switching.

Snapshot-supported failure recovery and migration
By backing up your cluster’s indexes and state through the OpenSearch Dashboards Snapshot Management interface, you can take and restore snapshots in case of failure.
Boost observability through visualization
Layer comprehensive visuals, dashboards, alerts, and other analytics capabilities on top of OpenSearch Observability features.
| Observability | |
|---|---|
| Experiment in the OpenSearch Playground | Explore features in OpenSearch Dashboards without downloading or installing anything. |
| Install the application |
Install OpenSearch Dashboards and choose the options that match your observability needs. |
| Build data visualizations | Create visualizations from a range of charts that provide the most helpful view of your data. |
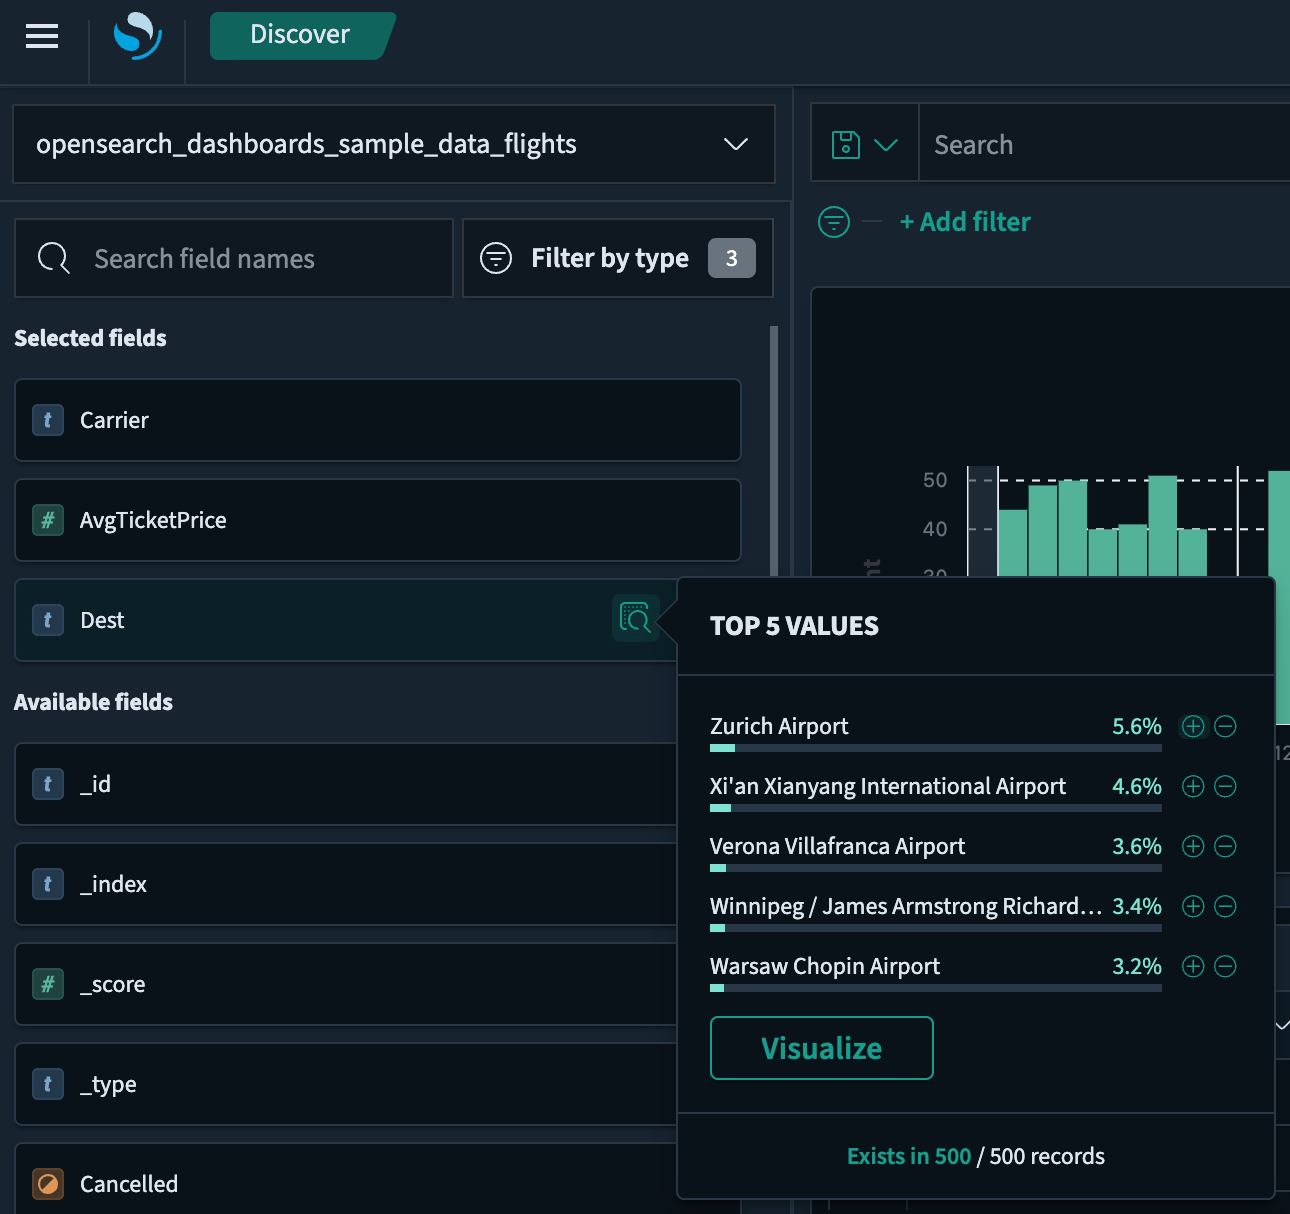
| Explore and query data | Analyze your data in OpenSearch and visualize key metrics using the Discover application in OpenSearch Dashboards. |
| Create dashboards | Build a dashboard using the Dashboard application and relevant data pulled from OpenSearch. |
| Manage your indices | Manage common indexing and data stream operations through the OpenSearch Dashboards Index Management interface. |
Get started with OpenSearch
Unlock actionable insights today. Explore our documentation for OpenSearch Observability.