OpenSearch is a comprehensive, open source solution with observability capabilities that provide extensive visibility into your applications and infrastructure. By seamlessly integrating logs, metrics, and traces, you can efficiently detect, diagnose, and resolve operational issues.
OpenSearch observability features use the Piped Processing Language (PPL) and adhere to standards such as OpenTelemetry (OTel) to simplify how you correlate and analyze diverse telemetry data. Scalable architecture and extensible integrations empower your DevOps teams, site reliability engineers, and developers to build robust, vendor-neutral observability stacks. The results are faster time to resolution and better experiences for end users.
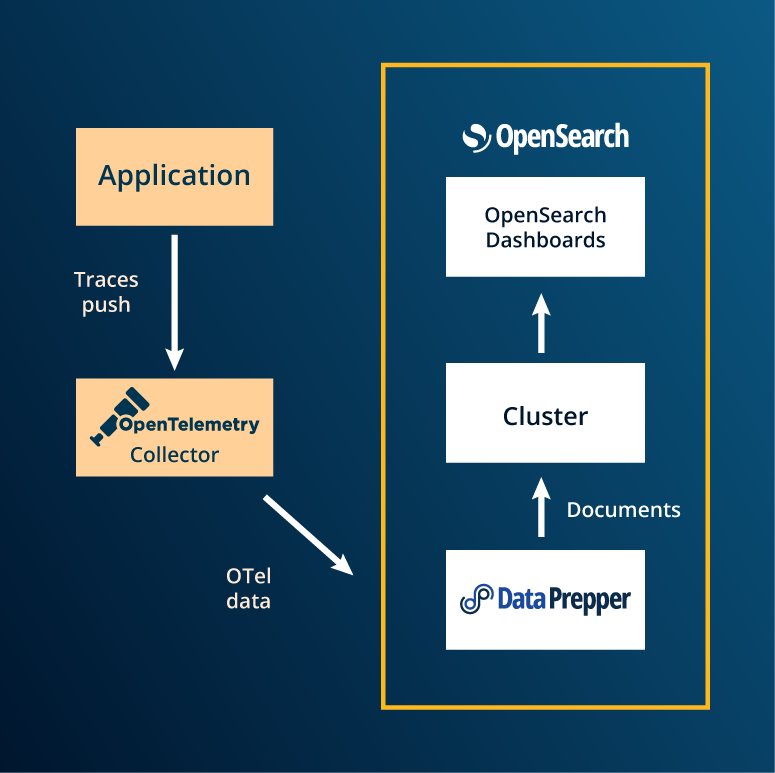
Seamless integration with OpenTelemetry
OpenSearch and OTel work together to let you generate, process, and transmit telemetry data in a single, unified format.
From data to insight with Piped Processing Language
Piped Processing Language (PPL) is an intuitive, easy-to-use query language that allows you to programmatically explore, discover, and find search patterns in your data.
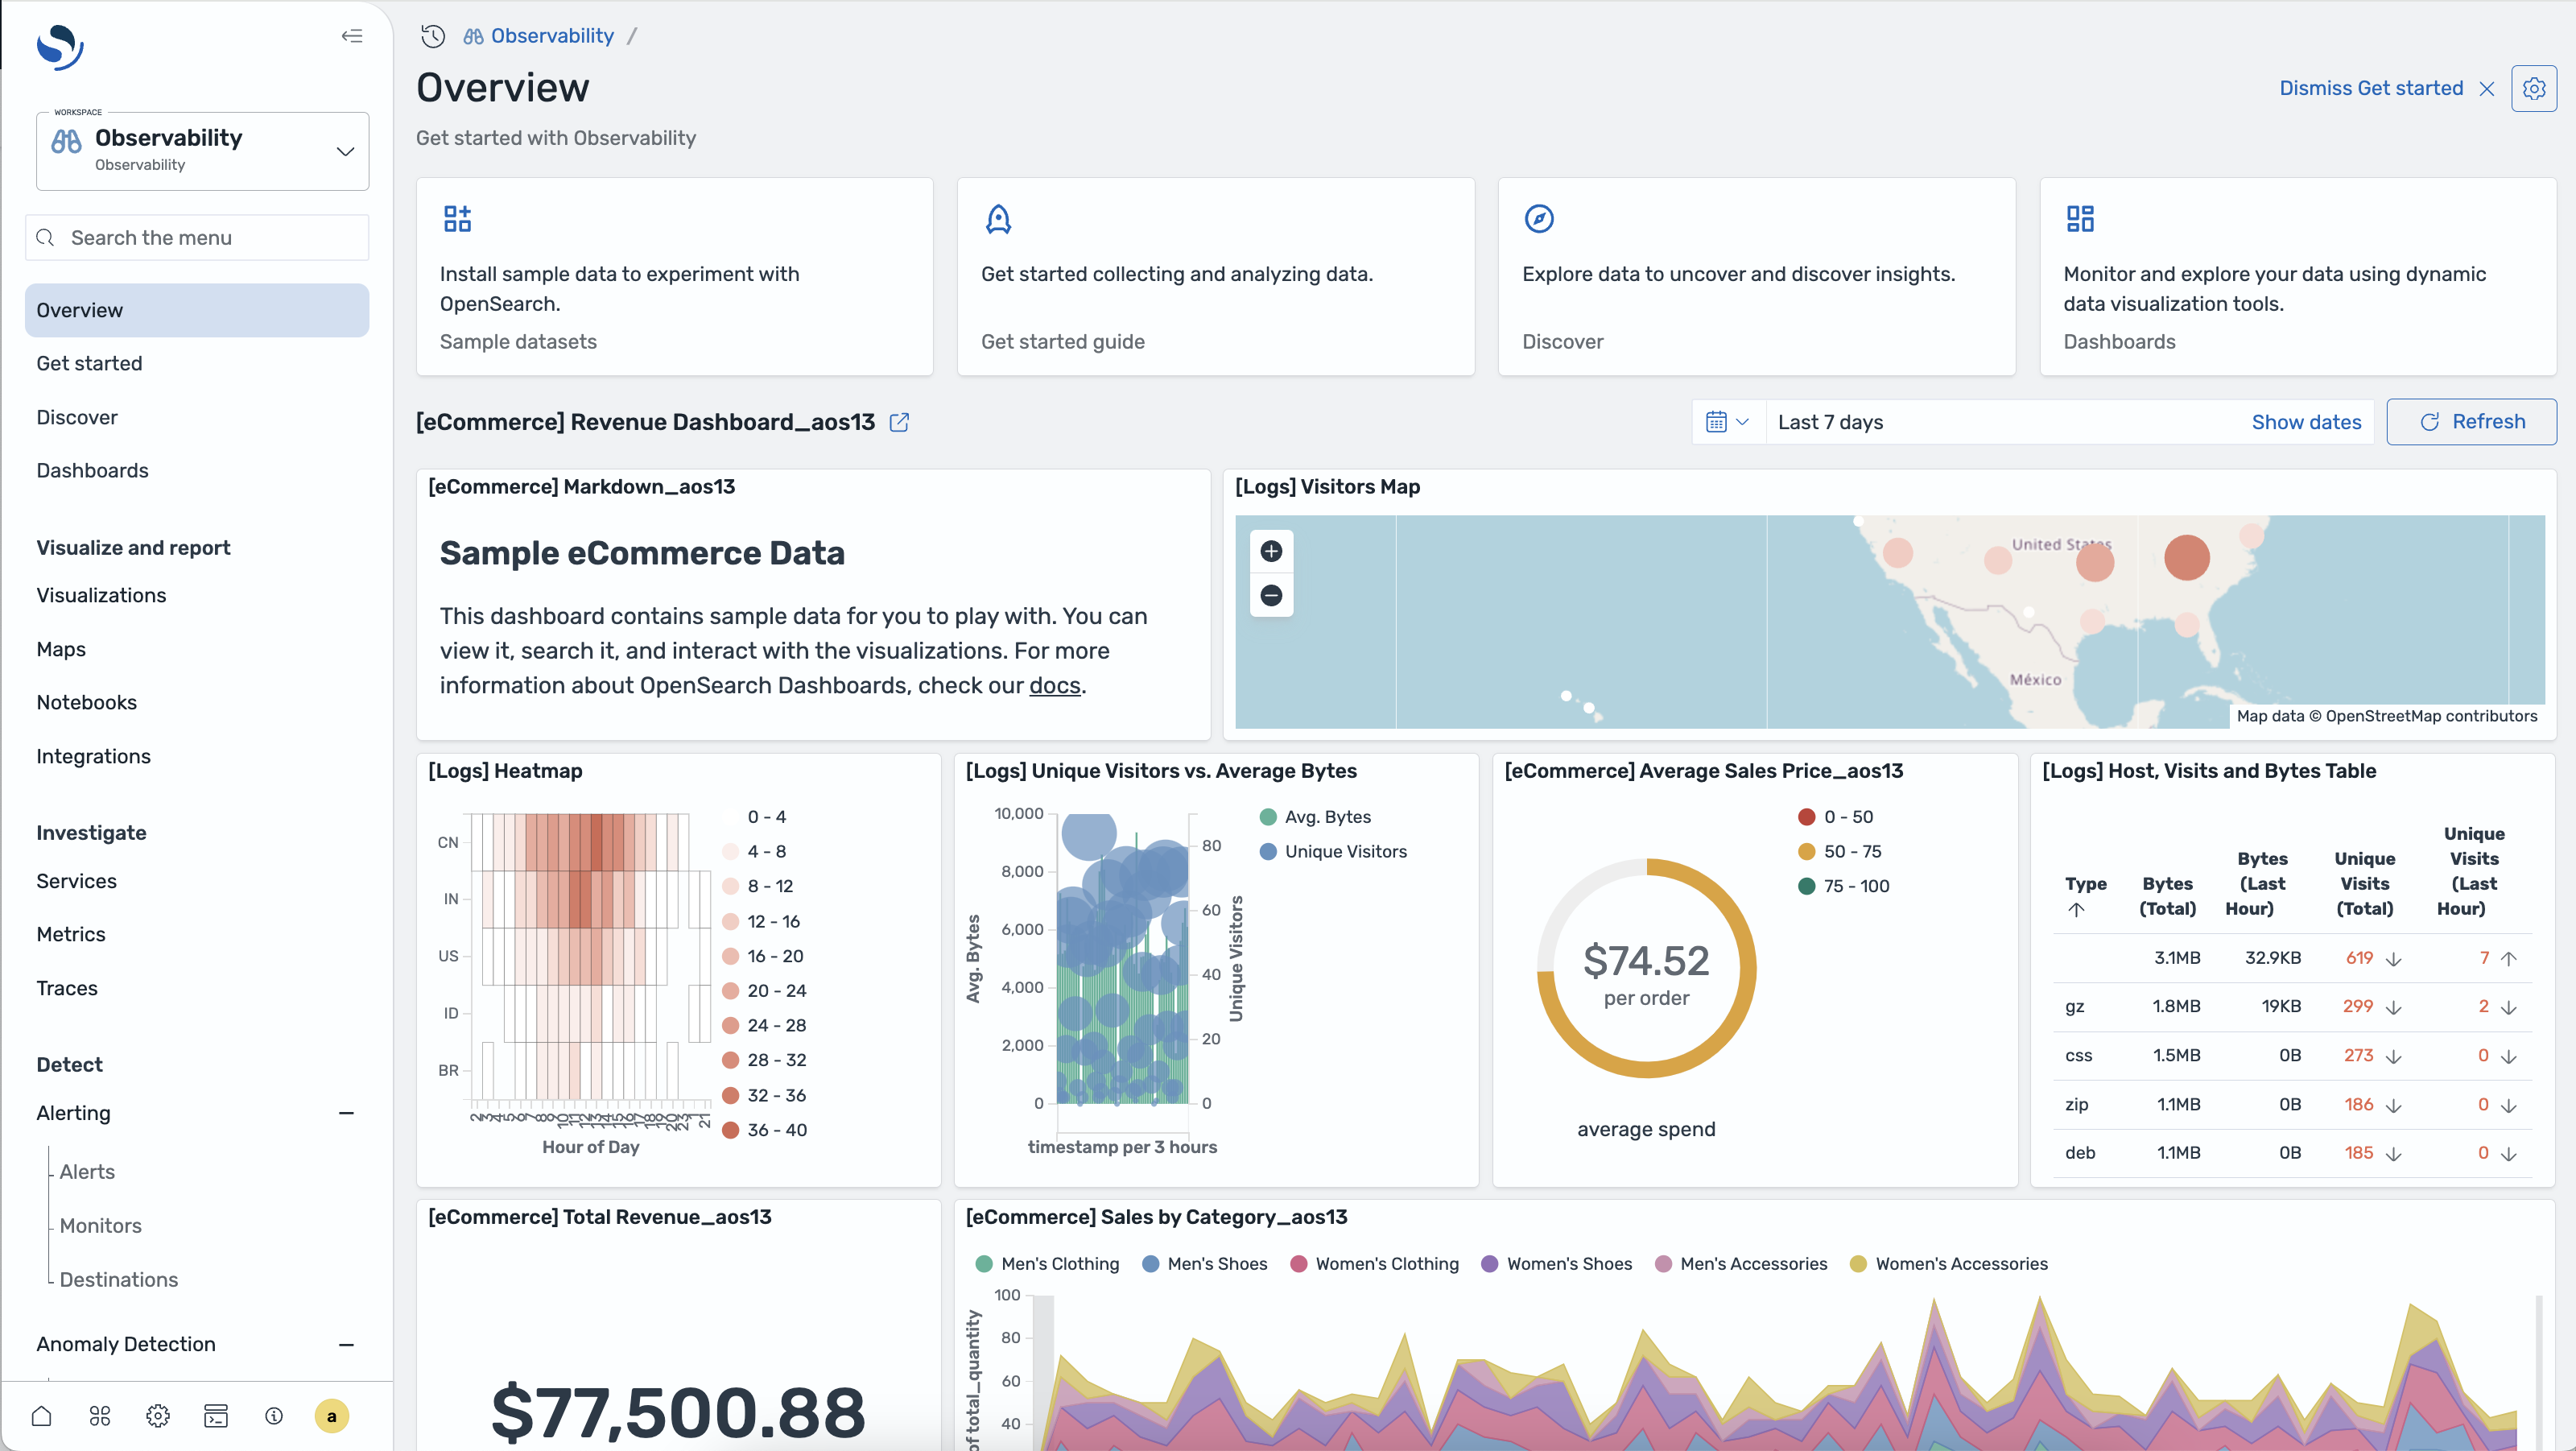
Better observability through OpenSearch Dashboards
Our integrated visualization toolset delivers a flexible interface for exploring and querying your data through out-of-the-box components for trace analytics, alerting, and more.
Custom pipelines with OpenSearch Data Prepper
Filter, enrich, transform, normalize, and aggregate data for more effective downstream analysis and visualization through a server-side data collector.
Architecture for unlocking observability with OpenSearch
Key features

Flexible data ingestion
Data Prepper facilitates the collection and processing of observability data by supporting OpenTelemetry sources for logs, traces, and metrics, enabling custom pipelines tailored to your needs.
See how

Powerful log analytics
Using PPL, you can perform complex queries on your log data to detect patterns by identifying trends and anomalies, then build custom dashboards to generate insights.
See how

Comprehensive trace and service analysis
The Trace Analytics plugin provides detailed visualizations of trace data to help you identify bottlenecks and optimize application performance by analyzing service maps, trace groups, and individual spans.
See how

Unified observability architecture
Use native integration with OpenTelemetry and Jaeger to seamlessly ingest and analyze logs, metrics, and traces to standardize your approach to observability.
See how

Real-time anomaly detection
The OpenSearch anomaly detection plugin automatically identifies unusual patterns in your data through machine learning algorithms to flag potential issues before they impact your system.
See how

Alerts and notifications
Monitors and alerts help you keep track of critical metrics and events by defining conditions and configuring notifications through the channels that work best for you.
See how

Notebooks
Notebooks provide a canvas for teams to collaboratively develop rich reports backed by live data for use cases like postmortems, run books, live infrastructure reports, and documentation.
See how

Extensive integrations
An extensive catalog of integrations connects OpenSearch with the tools and data sources you need to enhance your observability capabilities.
See how
OpenSearch in action
| Observability | |
|---|---|
|
Custom dashboards in OpenSearch
|
Understand trends, get a high-level view of key metrics, simplify data exploration, and unlock insights. |
| Log ingestion with Fluent | Transform unstructured log information into structured data to improve queries and filtering. |
|
|
Query, visualize, and perform operations on data stored across multiple OpenSearch clusters from a single interface. |
| Sending events to Logstash | Decouple event processing from your app by sending events from different sources to Logstash. |
| Diversify queries with Grafana | Run simplex or complex queries, visualize logs and metrics, and annotate graphs with log events. |
| Automated deployment and provisioning | Automate deployment and provisioning across multiple clusters using OpenSearch Kubernetes Operator. |
| On-demand queries | Run on-demand SQL and PPL queries through Query Workbench in OpenSearch Dashboards. |
Get started
Jump in to our demo environment OpenSearch Playground or explore our documentation for OpenSearch observability and OpenSearch Data Prepper.