OpenSearch Observability Stack
Unify AI agent tracing, APM, service maps, logs, metrics, and dashboards in a single open-source, OpenTelemetry-native platform with built-in ML-powered anomaly detection and PPL query language.
Apache 2.0 licensed. Self-host anywhere. No vendor lock-in.
QUICK START
$curl -fsSL https://raw.githubusercontent.com/opensearch-project/observability-stack/main/install.sh | bash
Traces

Dashboards
Metrics
AI Agents
QUICK START Docker, Kubernetes, or bare metal. Full stack in 5 minutes.
$curl -fsSL https://raw.githubusercontent.com/opensearch-project/observability-stack/main/install.sh | bashSee it in action
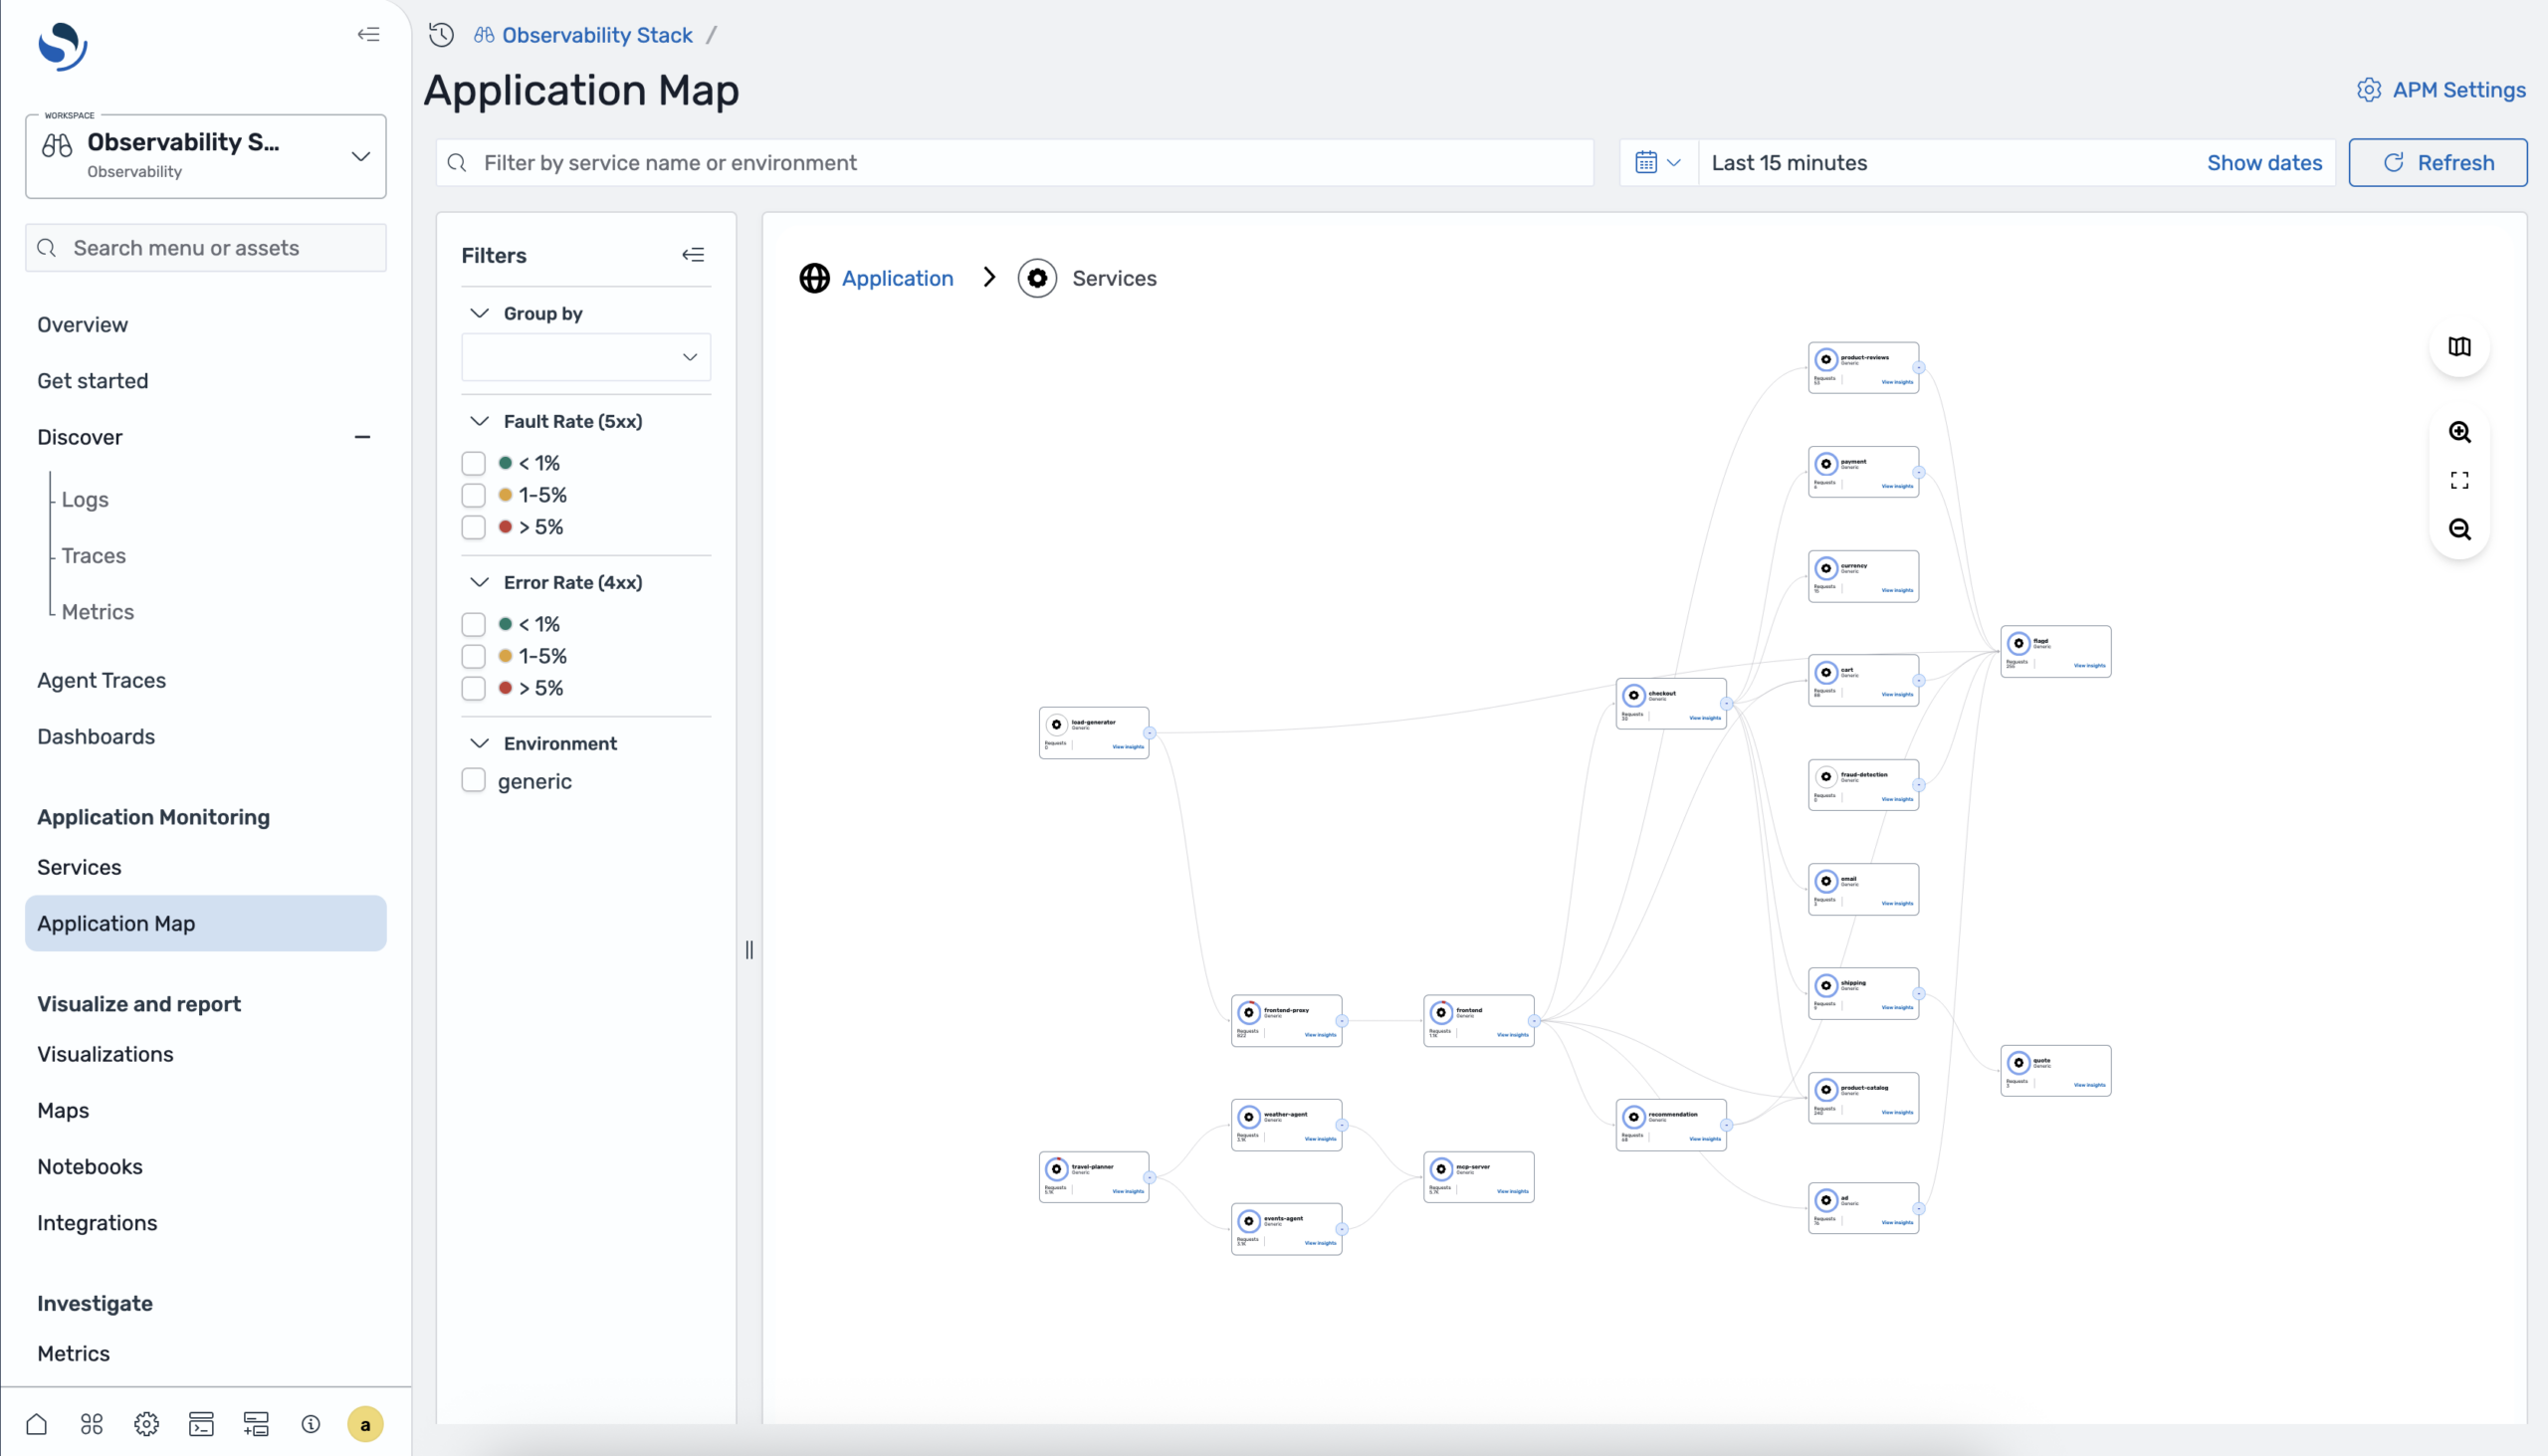
Real screenshots from the OpenSearch Observability Stack. Every feature shown here is available in the live playground.
Full-stack observability, one platform
From service health to AI agent performance: traces, logs, metrics, dashboards, and more
APM & distributed tracing
End-to-end visibility across services with auto-generated service maps, latency breakdowns, and error tracking. OpenTelemetry-native with zero proprietary agents.

Service maps and dependency visualization
P50/P95/P99 latency, error rates, and throughput
OTel-native and works with any language or framework
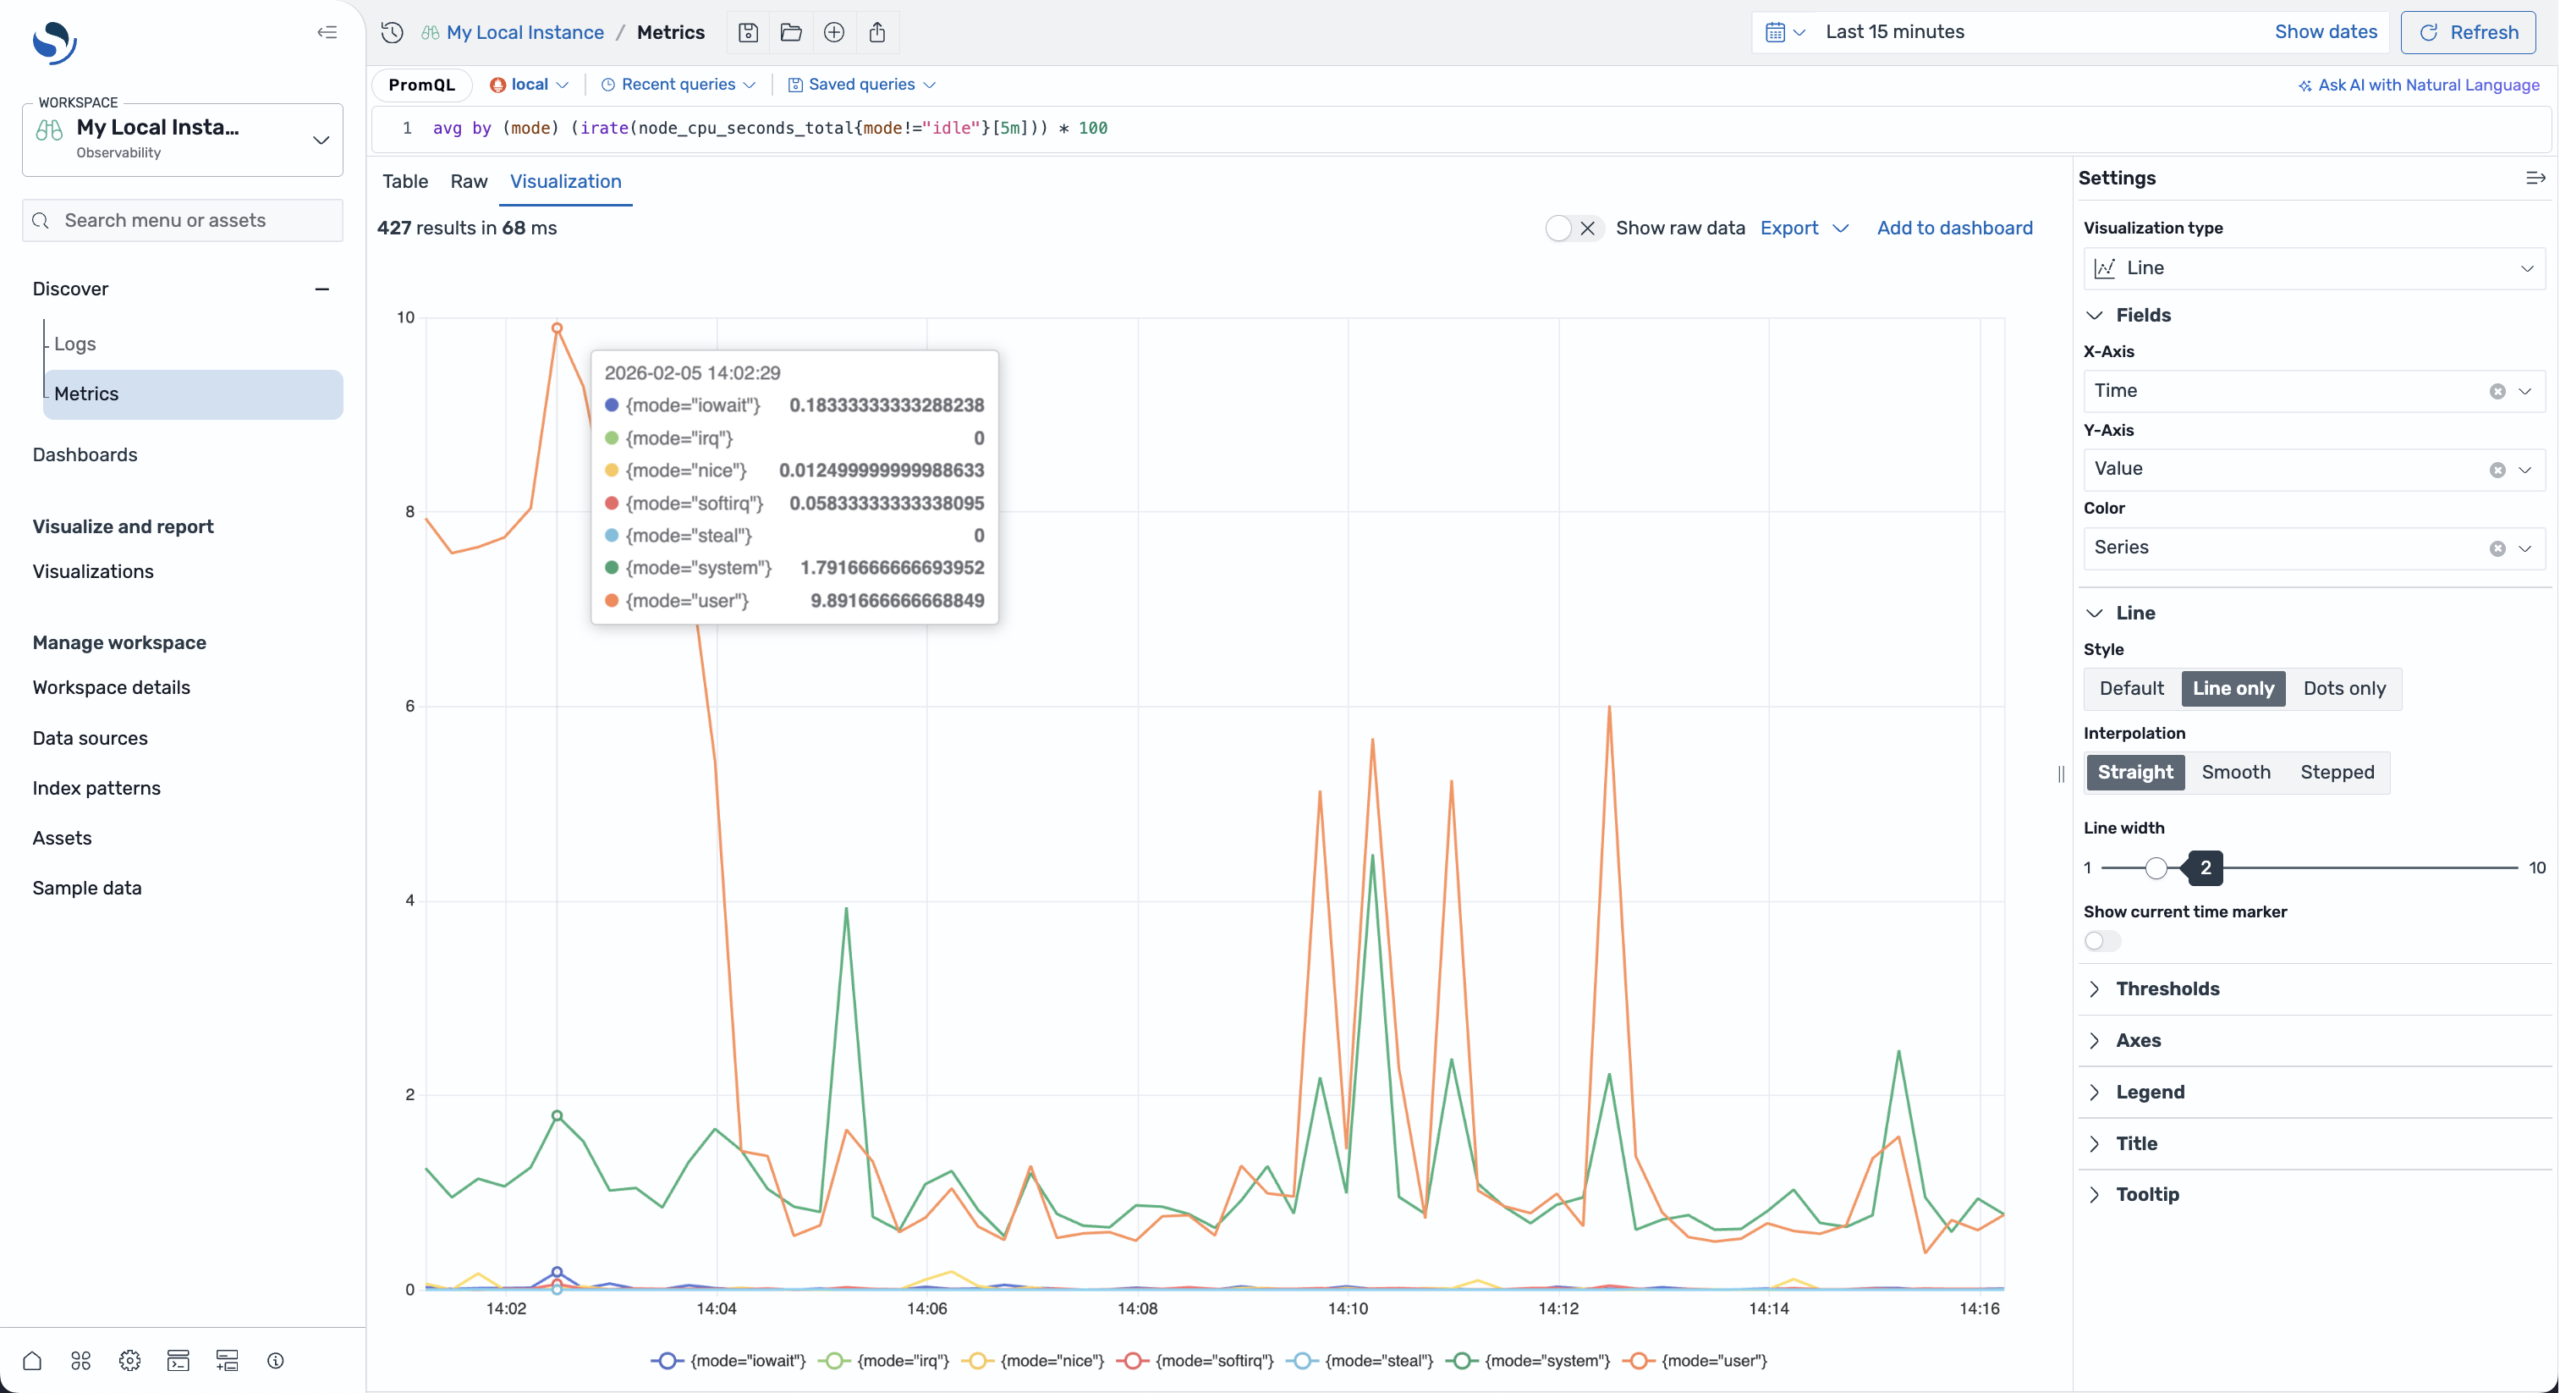
Metrics & dashboards
Prometheus-compatible metrics with PromQL support. Custom dashboards and RED metrics computed automatically from trace data. All signals in one platform.
Prometheus remote-write and native PromQL support
RED metrics (Rate, Errors, Duration) auto-computed from traces
Custom dashboards with real-time panels and alerting
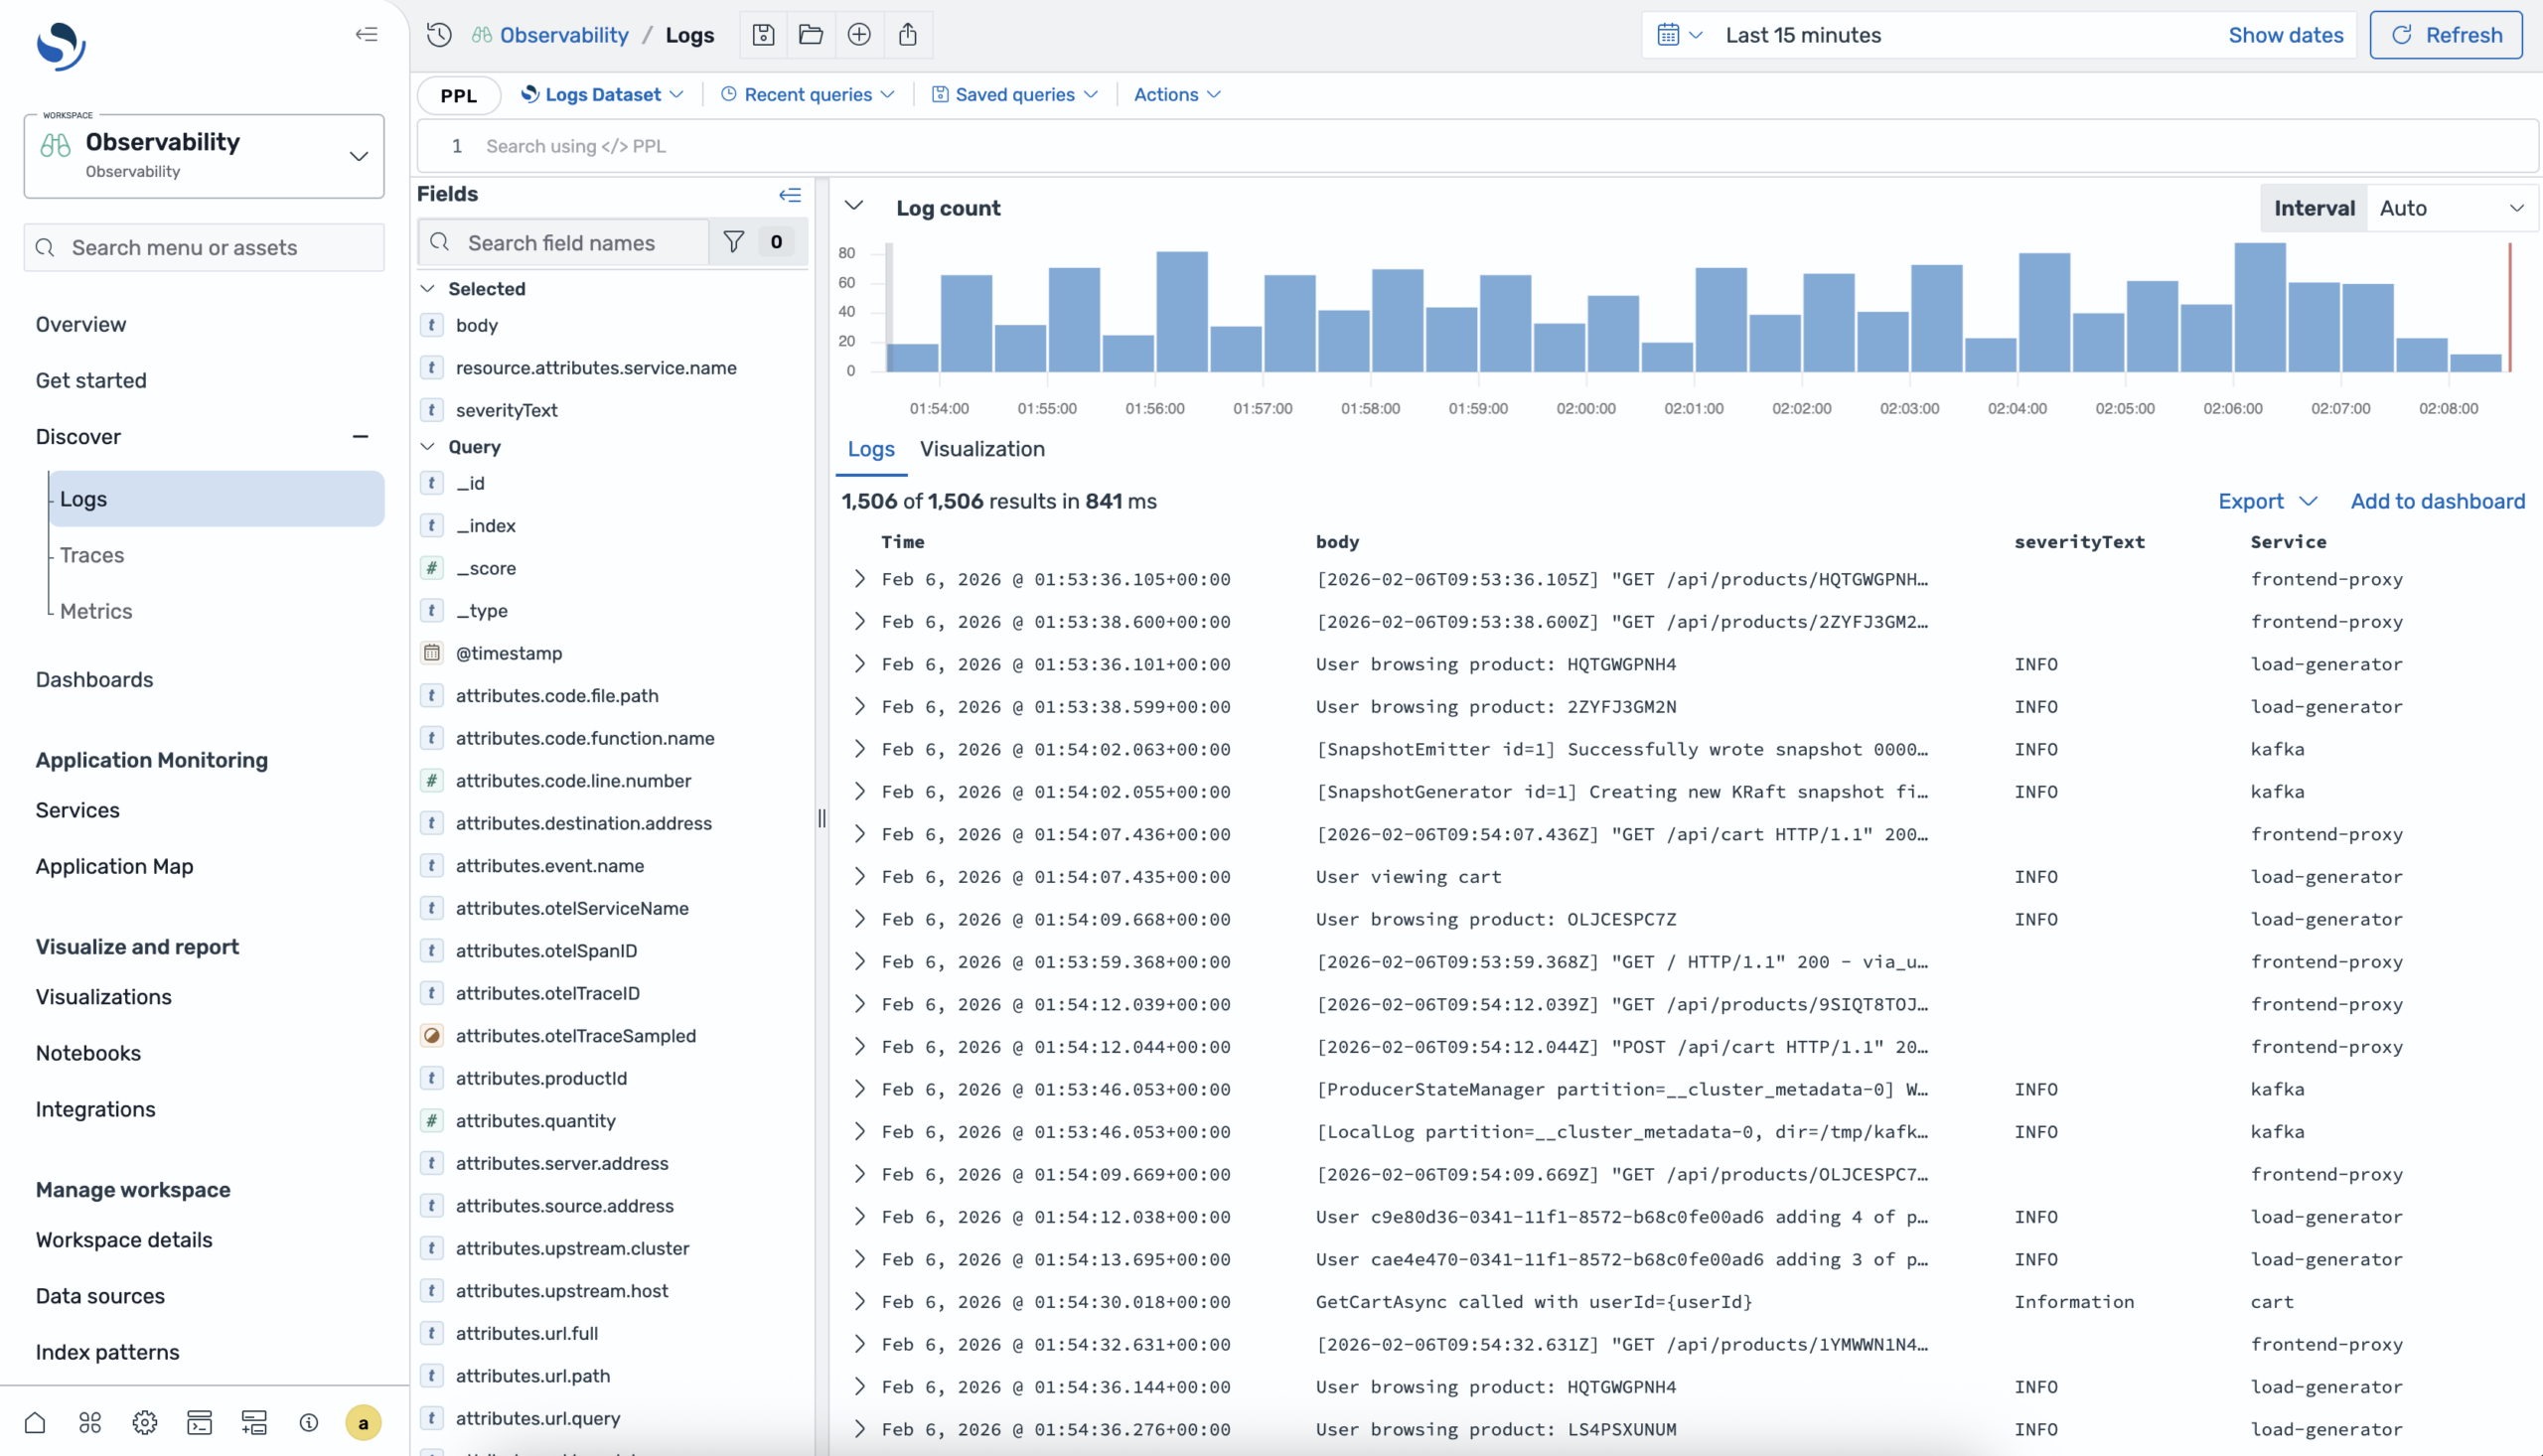
Log Analytics with PPL
Full-text search meets a pipe-based query language. PPL lets you filter, transform, aggregate, and correlate logs with traces in a single query. 50+ commands and 200+ built-in functions.
Complete query language — joins, subqueries, stats, and more
ML-powered log pattern clustering with zero regex
Log-to-trace correlation via traceId in one click
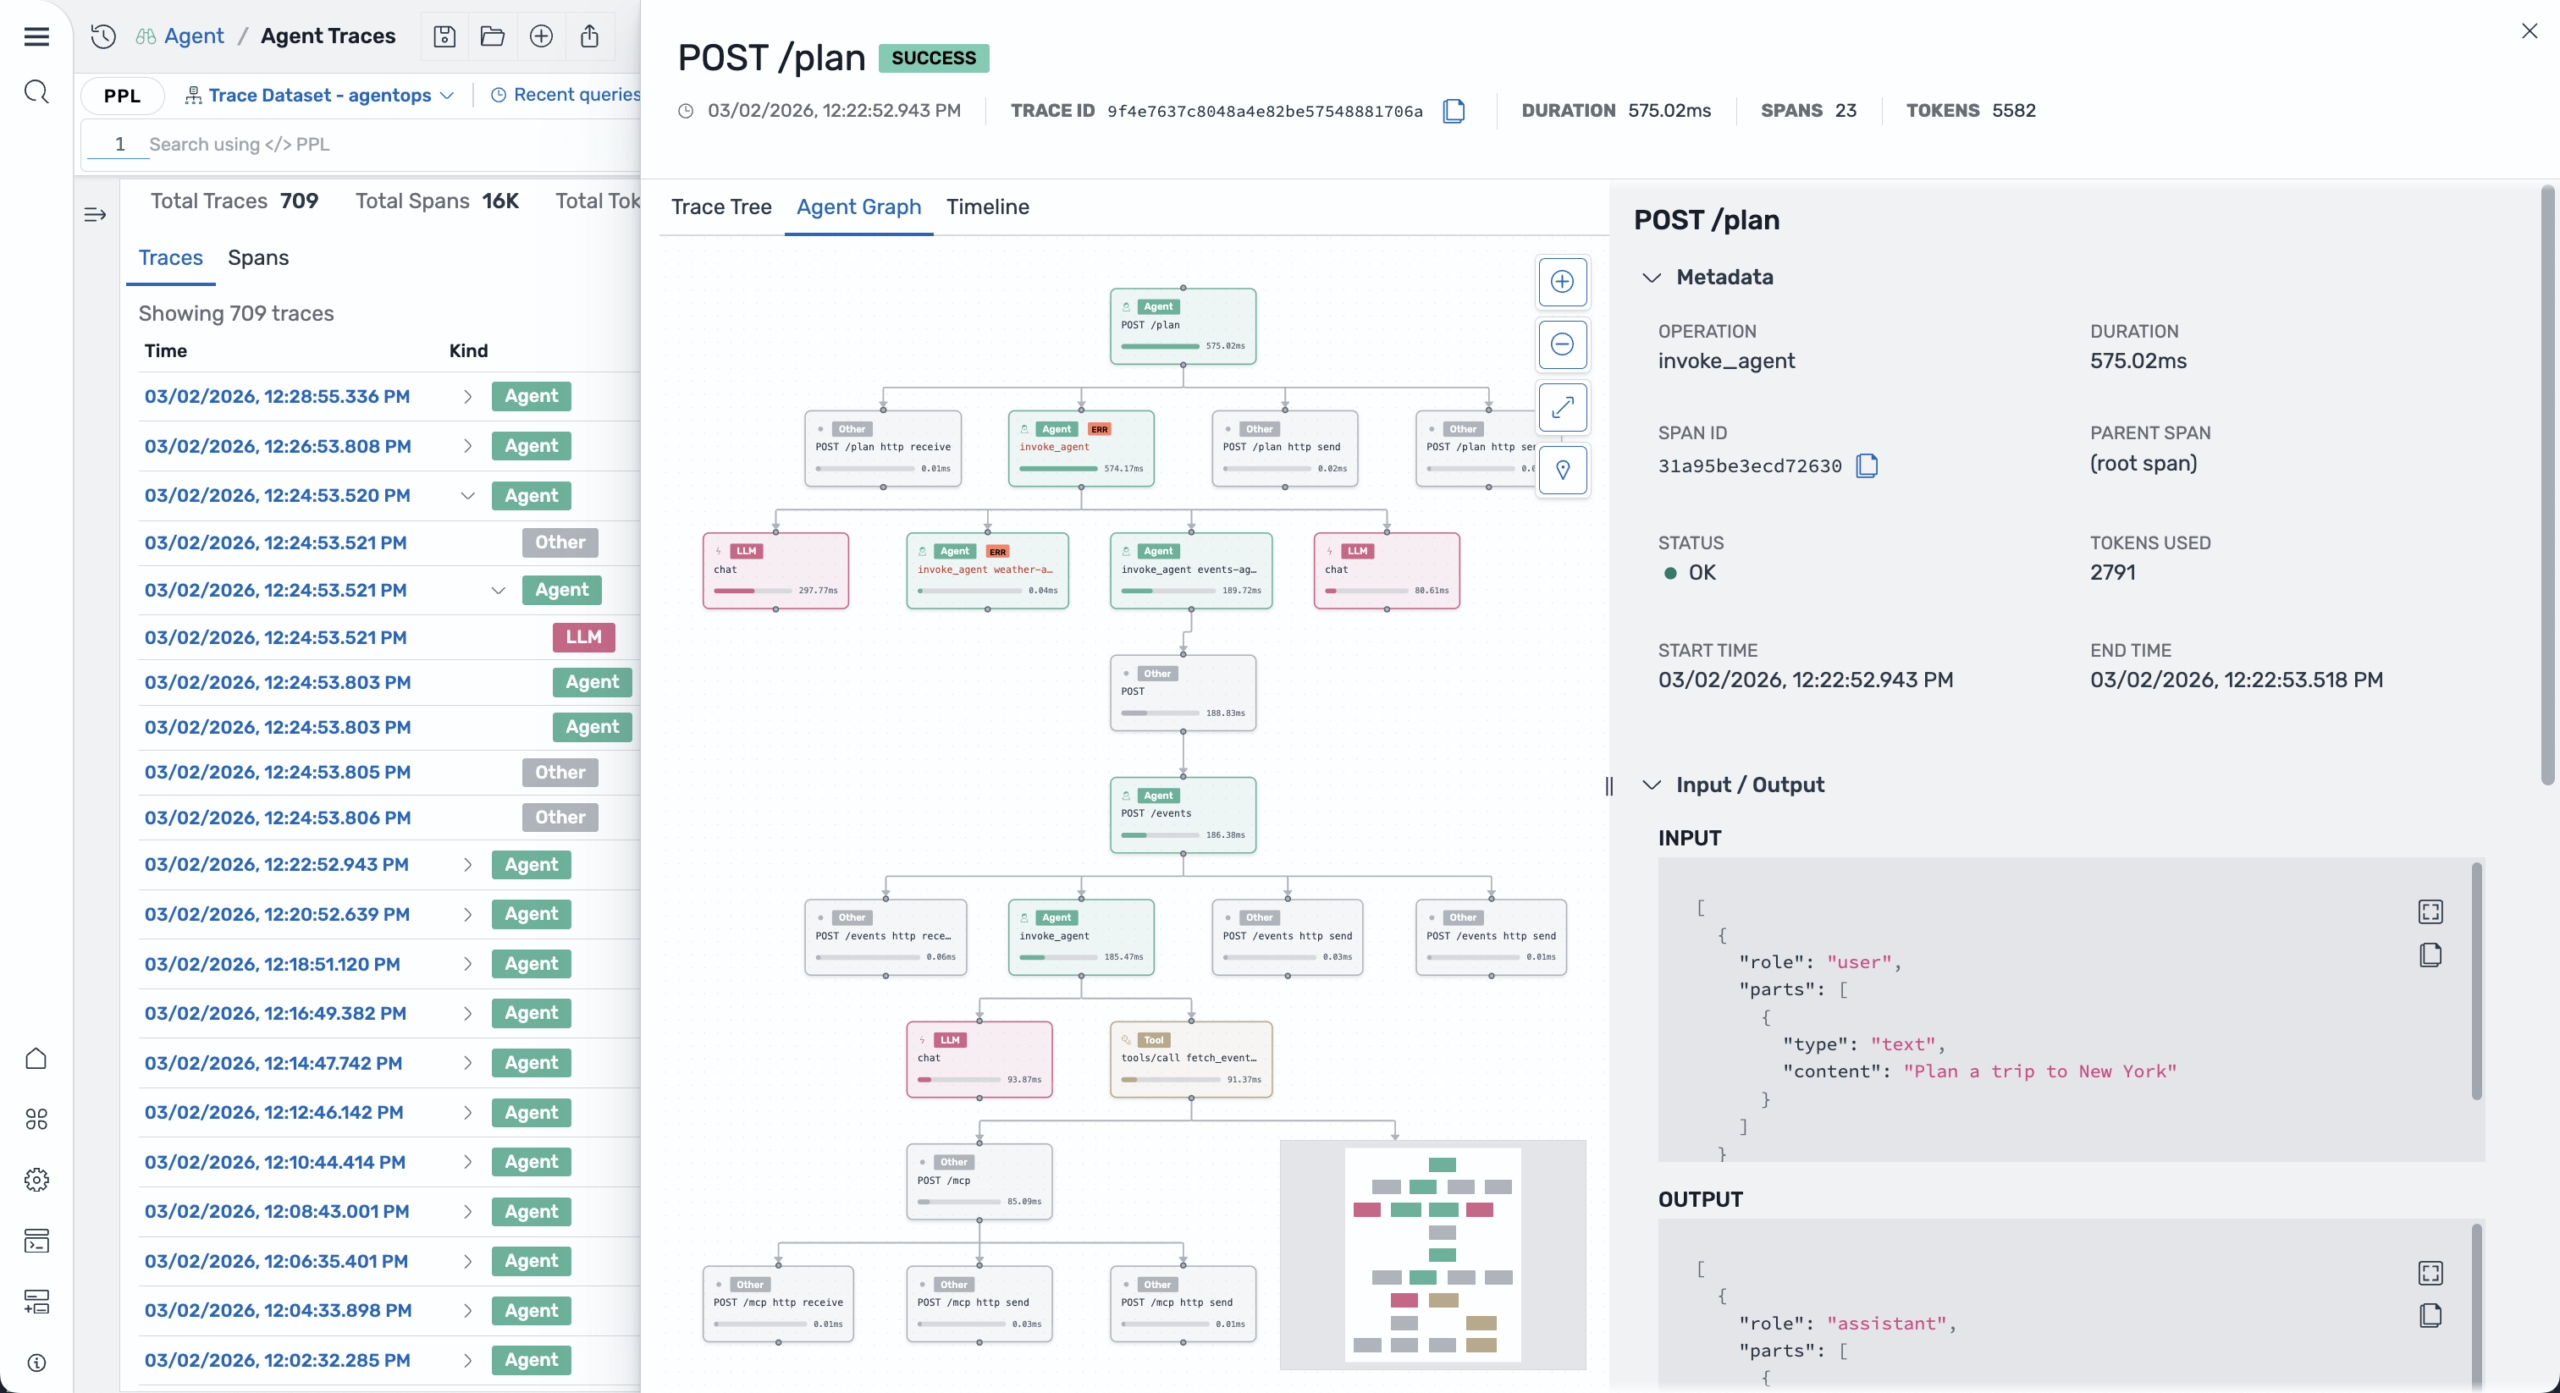
AI agent & LLM observability
Trace AI agent workflows end-to-end. Visualize execution graphs, monitor token usage, track tool calls, and debug agent behavior with OpenTelemetry GenAI semantic conventions.
Agent tracing with tool-call and reasoning step visualization
Token usage, cost tracking, and failure rate analysis
Python/JS SDKs + MCP support = works with any AI framework
PPL query language
A pipe-based query language built for observability. Filter, transform, aggregate, join across indices, and run ML algorithms from a single query pipeline.
Cross-signal correlation: join logs with traces on traceId
Automatic error pattern clustering — no regex required
Anomaly detection and k-means clustering built into queries
yaml
source = logs-otel-v1*
| where severityText = 'ERROR'
| patterns body method=brain mode=aggregation
    by `resource.attributes.service.name`
| sort - pattern_count
| head 20

# Zero regex. ML-powered clustering.
# Try it in the Live Playground →
yaml
source = otel-v1-apm-span-*
| stats avg(durationInNanos) as avg_latency
    by span(startTime, 5m) as window,
       serviceName
| ml action='train' algorithm='rcf'
    time_field='window'
    category_field='serviceName'
| where anomaly_grade > 0
| sort - anomaly_grade

# Built-in ML. No external service.
Built-in machine learning
Anomaly detection and clustering run directly in your query pipeline means no separate ML service, no model management, no data science team required.
Random Cut Forest anomaly detection per service
K-means clustering for automatic service health tiers
Trendline and rolling window analytics built in
Five minutes to production observability
From zero to full tracing in minutes. No complex configuration, no vendor lock-in.
main.py
PYTHON
from opensearch_genai_sdk_py import register, agent, tool

register(service_name="my-app")

@tool(name="search")
def search(query: str) -> dict:
return search_api.query(query)

@agent(name="assistant")
def assistant(prompt):
data = search(prompt)
return llm.generate(prompt, context=data)

# Automatic OTEL traces captured
result = assistant("Hello AI")
Terminal output
✓ Instrumentation initialized
✓ OTEL exporter configured
✓ Trace captured: process_request
✓ Spans exported: 3
✓ Latency: 342ms
→ View dashboard at http://localhost:8000
Choose your integration style
Three paths to production observability. Pick the one that fits your workflow.
GenAI SDK
One-line setup with automatic OpenTelemetry instrumentation. Decorators for agents, tools, and workflows.
example.py
PYTHON
from opensearch_genai_sdk_py import register, agent, tool
# One-line setup — configures OTEL pipeline automatically
register(service_name="my-app")
@tool(name="get_weather")
def get_weather(city: str) -> dict:
    return {"city": city, "temp": 22, "condition": "sunny"}
@agent(name="weather_assistant")
def assistant(query: str) -> str:
    data = get_weather("Paris")
    return f"{data['condition']}, {data['temp']}C"
# Automatic OTEL traces, metrics, and logs
result = assistant("What's the weather?")
Key benefits
Zero configuration required
Automatic instrumentation of popular frameworks
Instant OTEL traces and metrics
Works with existing code
Production-ready in 5 minutes
Manual OTEL instrumentation
Full control over your observability. Use standard OTEL APIs directly.
example.py
PYTHON
from opentelemetry import trace
from opentelemetry.sdk.trace import TracerProvider
from opentelemetry.sdk.trace.export import BatchSpanProcessor
from opentelemetry.exporter.otlp.proto.grpc.trace_exporter import OTLPSpanExporter
# Configure OTEL with Observability Stack
provider = TracerProvider()
exporter = OTLPSpanExporter(endpoint="http://localhost:4317")
provider.add_span_processor(BatchSpanProcessor(exporter))
trace.set_tracer_provider(provider)
# Use standard OTEL APIs
tracer = trace.get_tracer(__name__)
with tracer.start_as_current_span("agent_task"):
    response = llm.generate(prompt)
    span = trace.get_current_span()
    span.set_attribute("gen_ai.request.model", "gpt-4")
    span.set_attribute("gen_ai.usage.output_tokens", 150)
Key benefits
Standard OTEL APIs – no vendor lock-in
Full control over spans and attributes
Custom instrumentation for your use case
Works with any OTEL-compatible backend
Easy migration to/from other OTEL tools
Bring your own OTEL setup
Already using OTEL? Just point your exporter to Observability Stack. Keep your existing setup.
example.py
PYTHON
from opentelemetry.sdk.trace.export import BatchSpanProcessor
from opentelemetry.exporter.otlp.proto.grpc.trace_exporter import OTLPSpanExporter
# Add Observability Stack as an additional exporter
# Keep your existing OTEL configuration
exporter = OTLPSpanExporter(
    endpoint="http://localhost:4317"
)
# Add to your existing trace provider
trace_provider.add_span_processor(
    BatchSpanProcessor(exporter)
)
# Your existing OTEL instrumentation continues to work
# Traces now flow to both your existing backend AND Observability Stack
Key Benefits
Keep your existing OTEL setup
Multi-backend support (send to multiple destinations)
No code changes required
Works with any OTEL collector
Key benefits
Keep your existing OTEL setup
Multi-backend support (send to multiple destinations)
No code changes required
Works with any OTEL collector
Gradual migration path
Why OpenTelemetry matters
The foundation for traces, metrics, and logs across services and AI. No compromises, no vendor lock-in.
Industry standard (CNCF)
OpenTelemetry is a CNCF graduated project, backed by major tech companies and trusted by thousands of organizations worldwide.
Your data, your rules
Own your observability data completely. Export to any backend, store locally, or switch providers anytime without losing history.
Future-proof investment
Built on open standards that evolve with the industry. Your instrumentation code stays relevant as technology advances.
No vendor lock-in
Switch observability backends in minutes, not months. Your instrumentation is portable across any OTEL-compatible platform.
Language agnostic
Consistent instrumentation across Python, JavaScript, Go, Java, and 10+ languages. One standard for your entire stack.
Community driven
Benefit from contributions by thousands of developers. Active community, extensive documentation, and continuous improvements.