
Simplify hybrid search, expand observability for AI agents, and ingest data at rest
OpenSearch 3.10 adds features across observability, search, and cluster operations, delivering deeper visibility into applications and AI agents, simpler and more predictable AI-powered search, and new ways to ingest and recover data. The latest capabilities in OpenSearch 3.10 include:
- Investigating applications and AI agents faster using the OpenSearch Observability Stack, which maps the databases, queues, and external APIs for dependent services and traces agent conversations to the failing call.
- Querying Prometheus metrics in Vega and Vega-Lite visualizations.
- Accelerating PPL queries using time-range index pruning and support for cross-cluster queries.
- Running hybrid queries without a search pipeline using a new fusion mode.
- Connecting to models on Google Gemini Enterprise Agent Platform with fewer setup steps.
- Making agentic search more predictable with experimental search templates that the LLM fills in instead of writing full queries.
- Extending pull-based ingestion to data at rest in object storage.
- Restoring plugin state cleanly from snapshots.
OpenSearch 3.10 is ready for download. The following sections describe the new features in more detail. For a complete list of changes, see the release notes.
Observability and analytics
OpenSearch 3.10 helps you go from a symptom to its cause without leaving OpenSearch Dashboards. Application Performance Monitoring (APM) now adds the databases, queues, and third-party APIs your services depend on to the service map. Agent Traces lets you follow an AI agent conversation to identify the LLM or tool call that failed. The visualization editor becomes the starting point for new charts, and you can now view Prometheus metrics using Vega visualizations. PPL can skip indexes outside the selected time range, return results while a query is still running, and query flat_object fields and remote clusters. Several of these features require the OpenSearch Observability Stack with Data Prepper 2.17, which is versioned separately from core OpenSearch.
View databases, queues, and external APIs on the service map
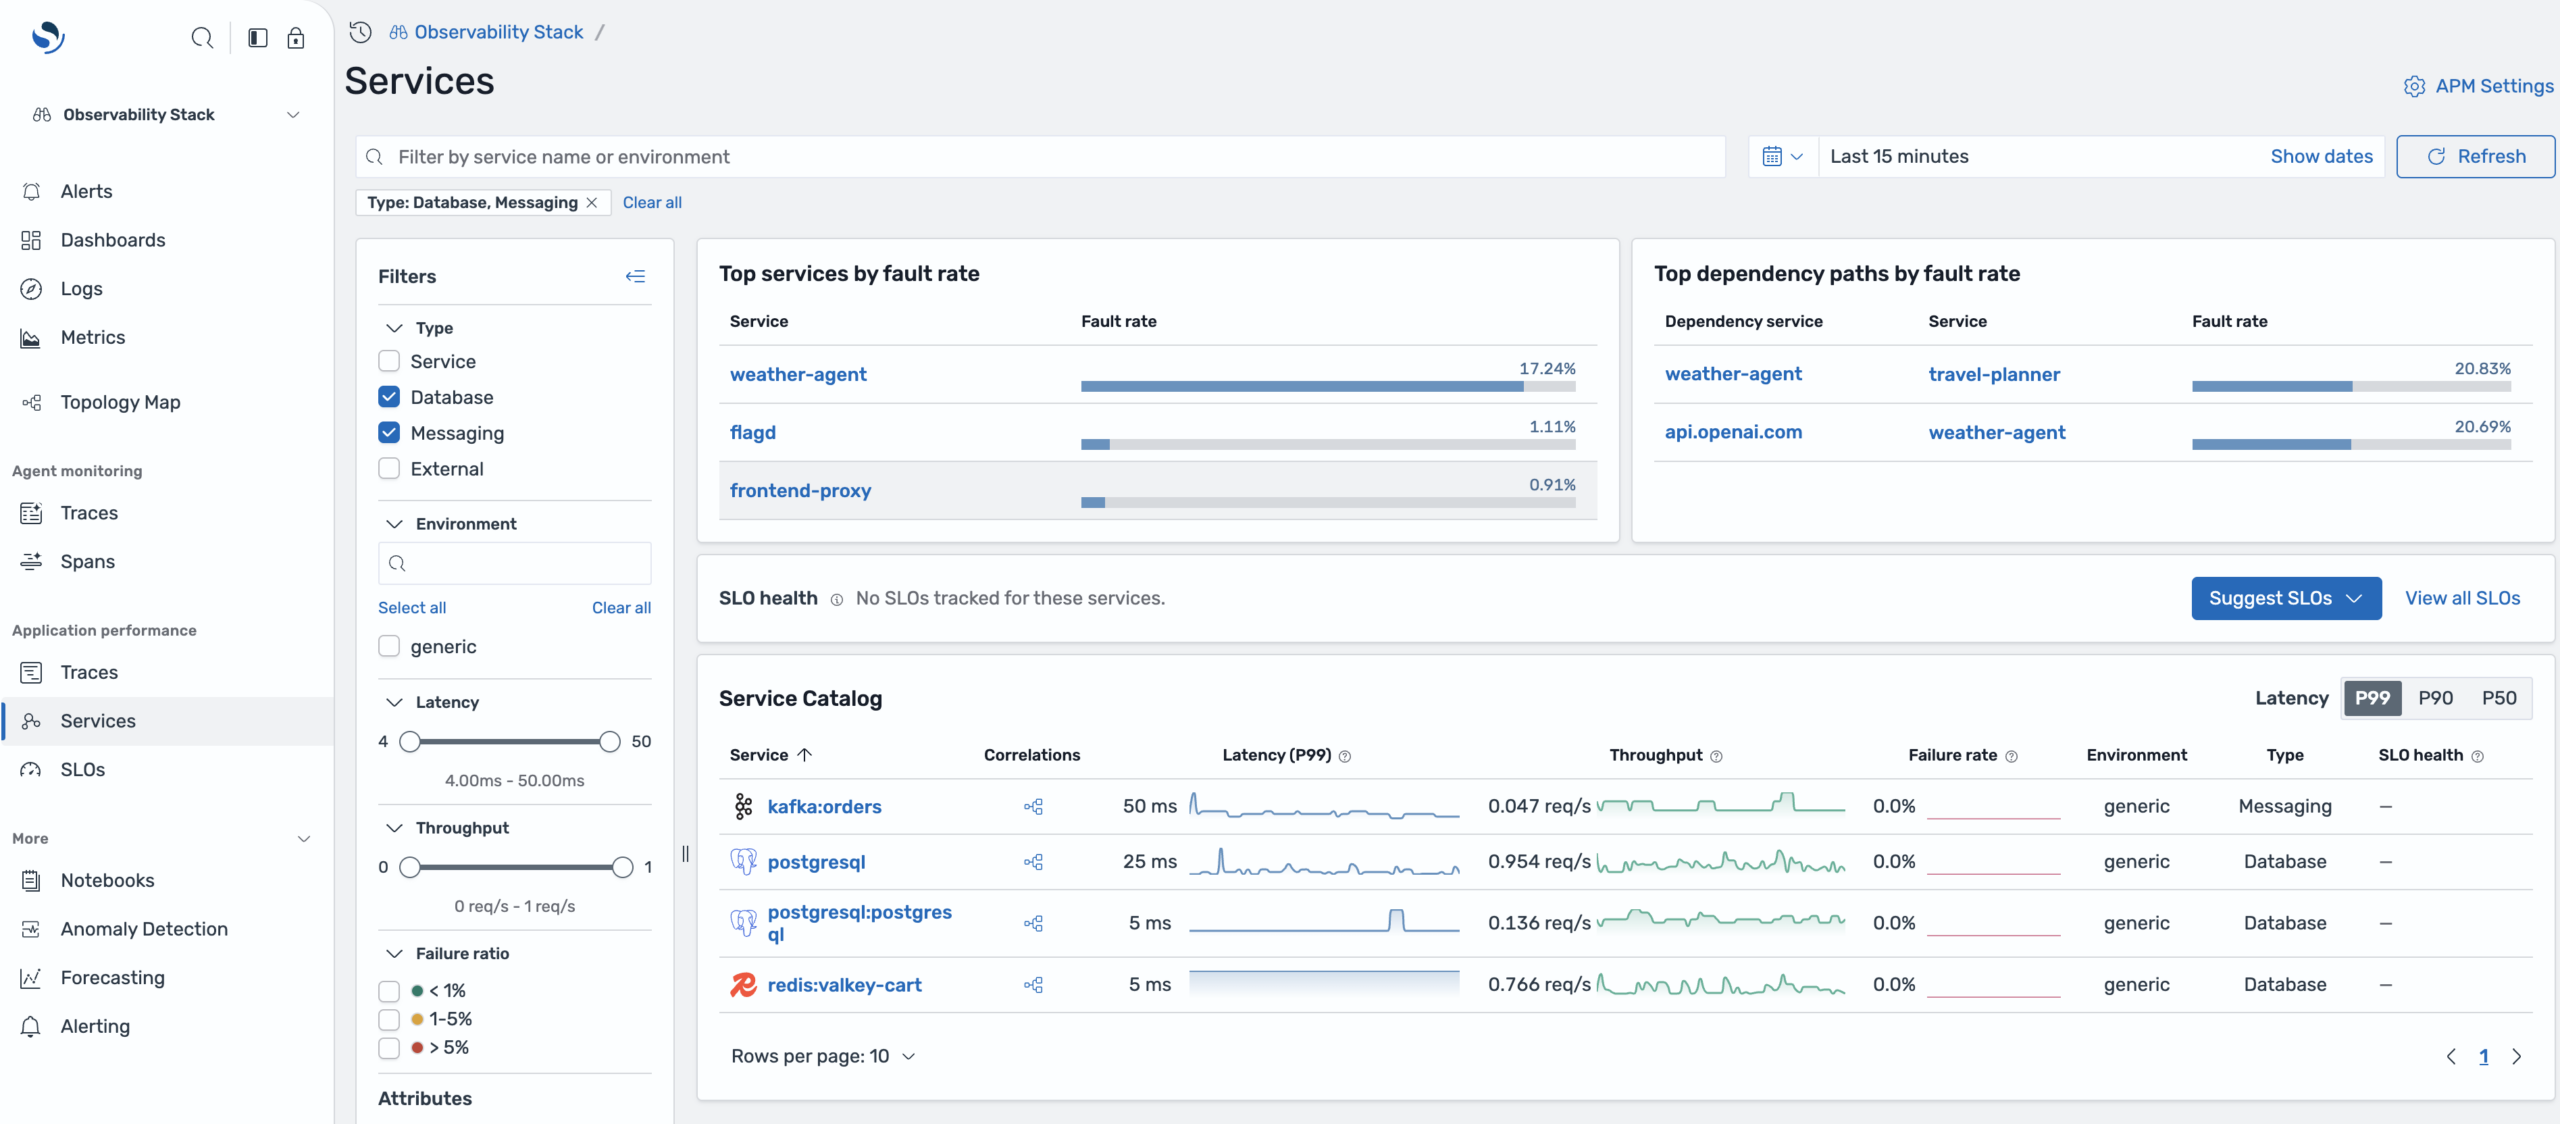
OpenSearch 3.10 and Data Prepper 2.17 can detect the databases, message queues, and external APIs that your services call. These dependencies appear directly in APM. Data Prepper finds them in client spans, including PostgreSQL, Valkey, Redis, Kafka, external HTTP services, and LLM endpoints, so you do not need to instrument the dependencies themselves. APM shows each dependency as a typed node with its own rate, error, and duration (RED) metrics. The topology map and the Services catalog list dependencies next to your services, and you can filter the catalog by type. The same dependencies also appear in the trace map, waterfall, and topology card of a single trace in Discover Traces. APM charts now include a crosshair that moves in sync across all dependency charts, and you can zoom into a latency spike or open it in Discover Metrics to determine whether the problem comes from your own code or from a database, queue, or third-party API. For more information, see Services and Service map.
The following image shows the APM Services catalog filtered to databases and message queues, each displaying its own latency, throughput, and failure rate.
 Trace AI agent conversations from session to failing call
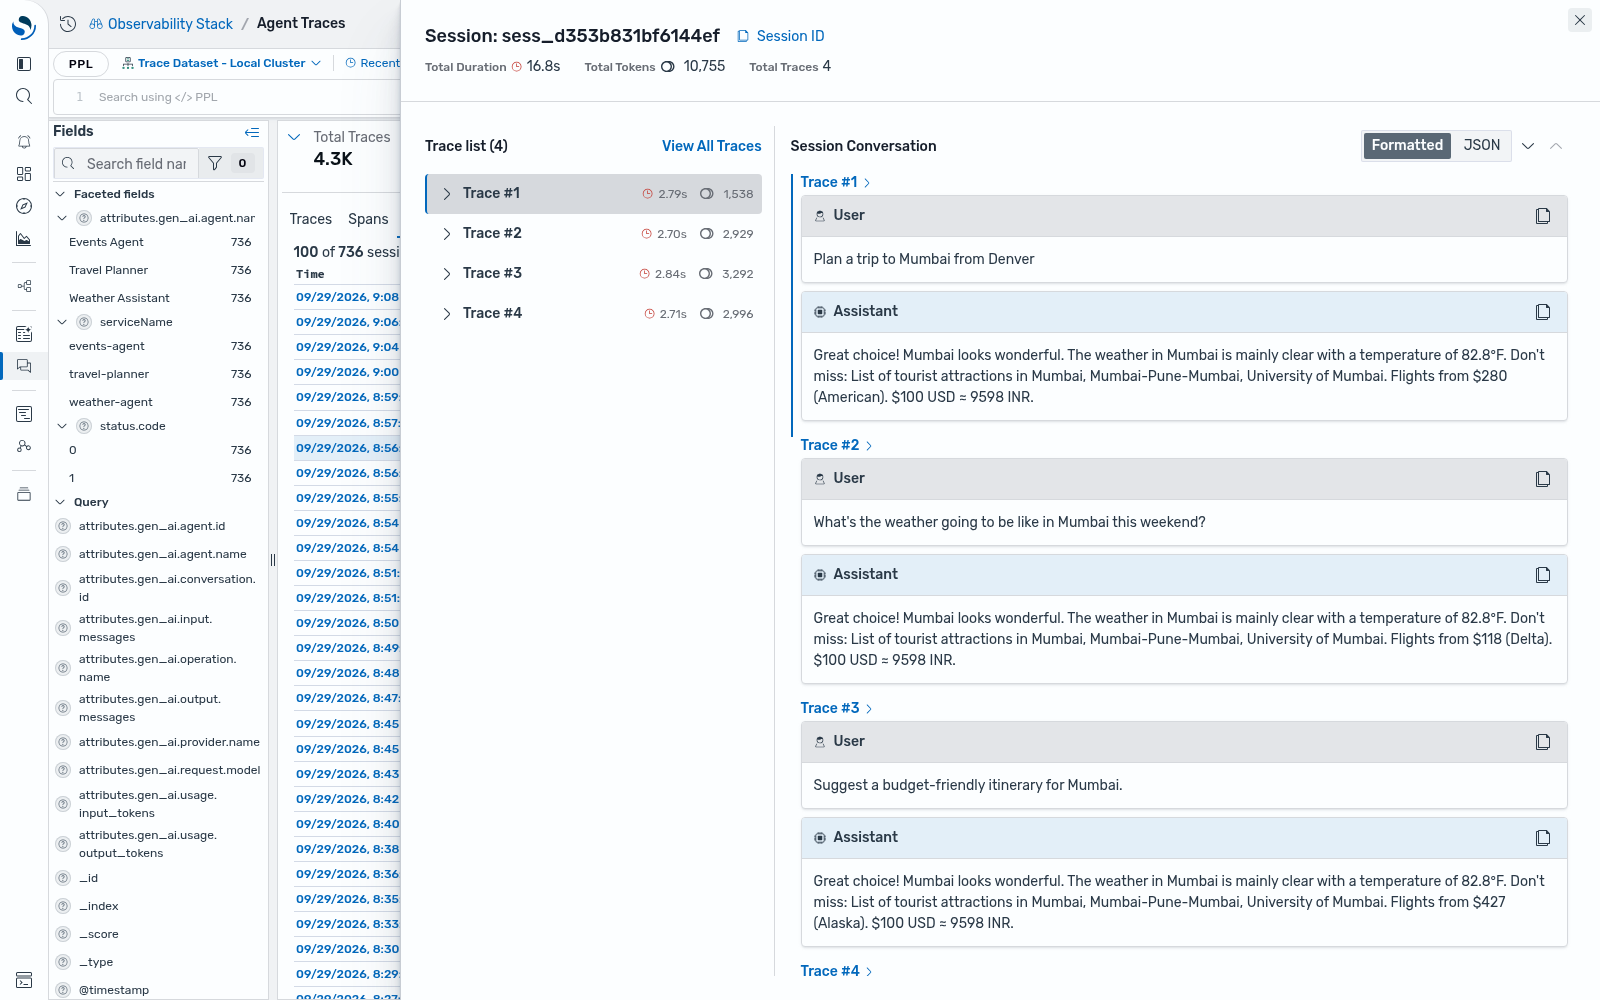
As AI agents move into production, you need to monitor them like any other workload. OpenSearch 3.10 and Data Prepper 2.17 add a Sessions view to Agent Traces. This view groups agent executions into multi-turn conversations using the gen_ai.conversation.id attribute. Each session shows its first message, duration, trace count, and total number of tokens, and a filter limits the list to sessions with errors. You can read a conversation turn by turn and then open a failing turn to identify the failing LLM call or tool call and the number of tokens it used. A new Related logs tab in the trace flyout lists the logs generated during the trace. Each span shows its own logs, so you can trace a failed tool call to its log lines. Agents that run inside an HTTP service, such as a chat endpoint that calls an agent, are now detected as agent runs, so more of your AI applications can be monitored without code changes. For more information, see Agent tracing.
The following image shows the Agent Traces Sessions view, where you can read an agent conversation turn by turn with duration and token totals for each trace.
 Visualize Prometheus metrics in Vega and Vega-Lite
Vega has long been one of the most flexible visualization options in OpenSearch Dashboards, and OpenSearch 3.10 extends it to Prometheus data sources. Vega and Vega-Lite specifications can now query a Prometheus data connection using PromQL. You can build interactive metrics visualizations next to your log and search visualizations in one interface. For example, you can use a Kubernetes memory explorer to select a point in time and view memory usage in a tree map split by namespace and pod. Data is fetched on the server, so you do not need to enable external URLs, and visualizations are updated when the dashboard time selector changes. This work is a community contribution, and you can help shape further improvements by commenting on the RFC.
Build every chart from one visualization editor
OpenSearch 3.10 makes the visualization editor the starting point for new charts. Create visualization now recommends the visualization editor and offers shortcuts to start from Discover or Metrics. The 19 classic visualization types are in a collapsed, searchable Legacy visualization types section, so existing workflows keep working. In the visualization editor, a Code/Builder switch lets you build a PPL query point by point. Dashboard variables also scale to large value lists. You can search the full list of values, and a new Custom all value field lets you specify the query value used when All is selected, for example .+ for a PromQL regex. For more information, see Visualization editor and Managing variables.
Visualize data flows with Sankey charts
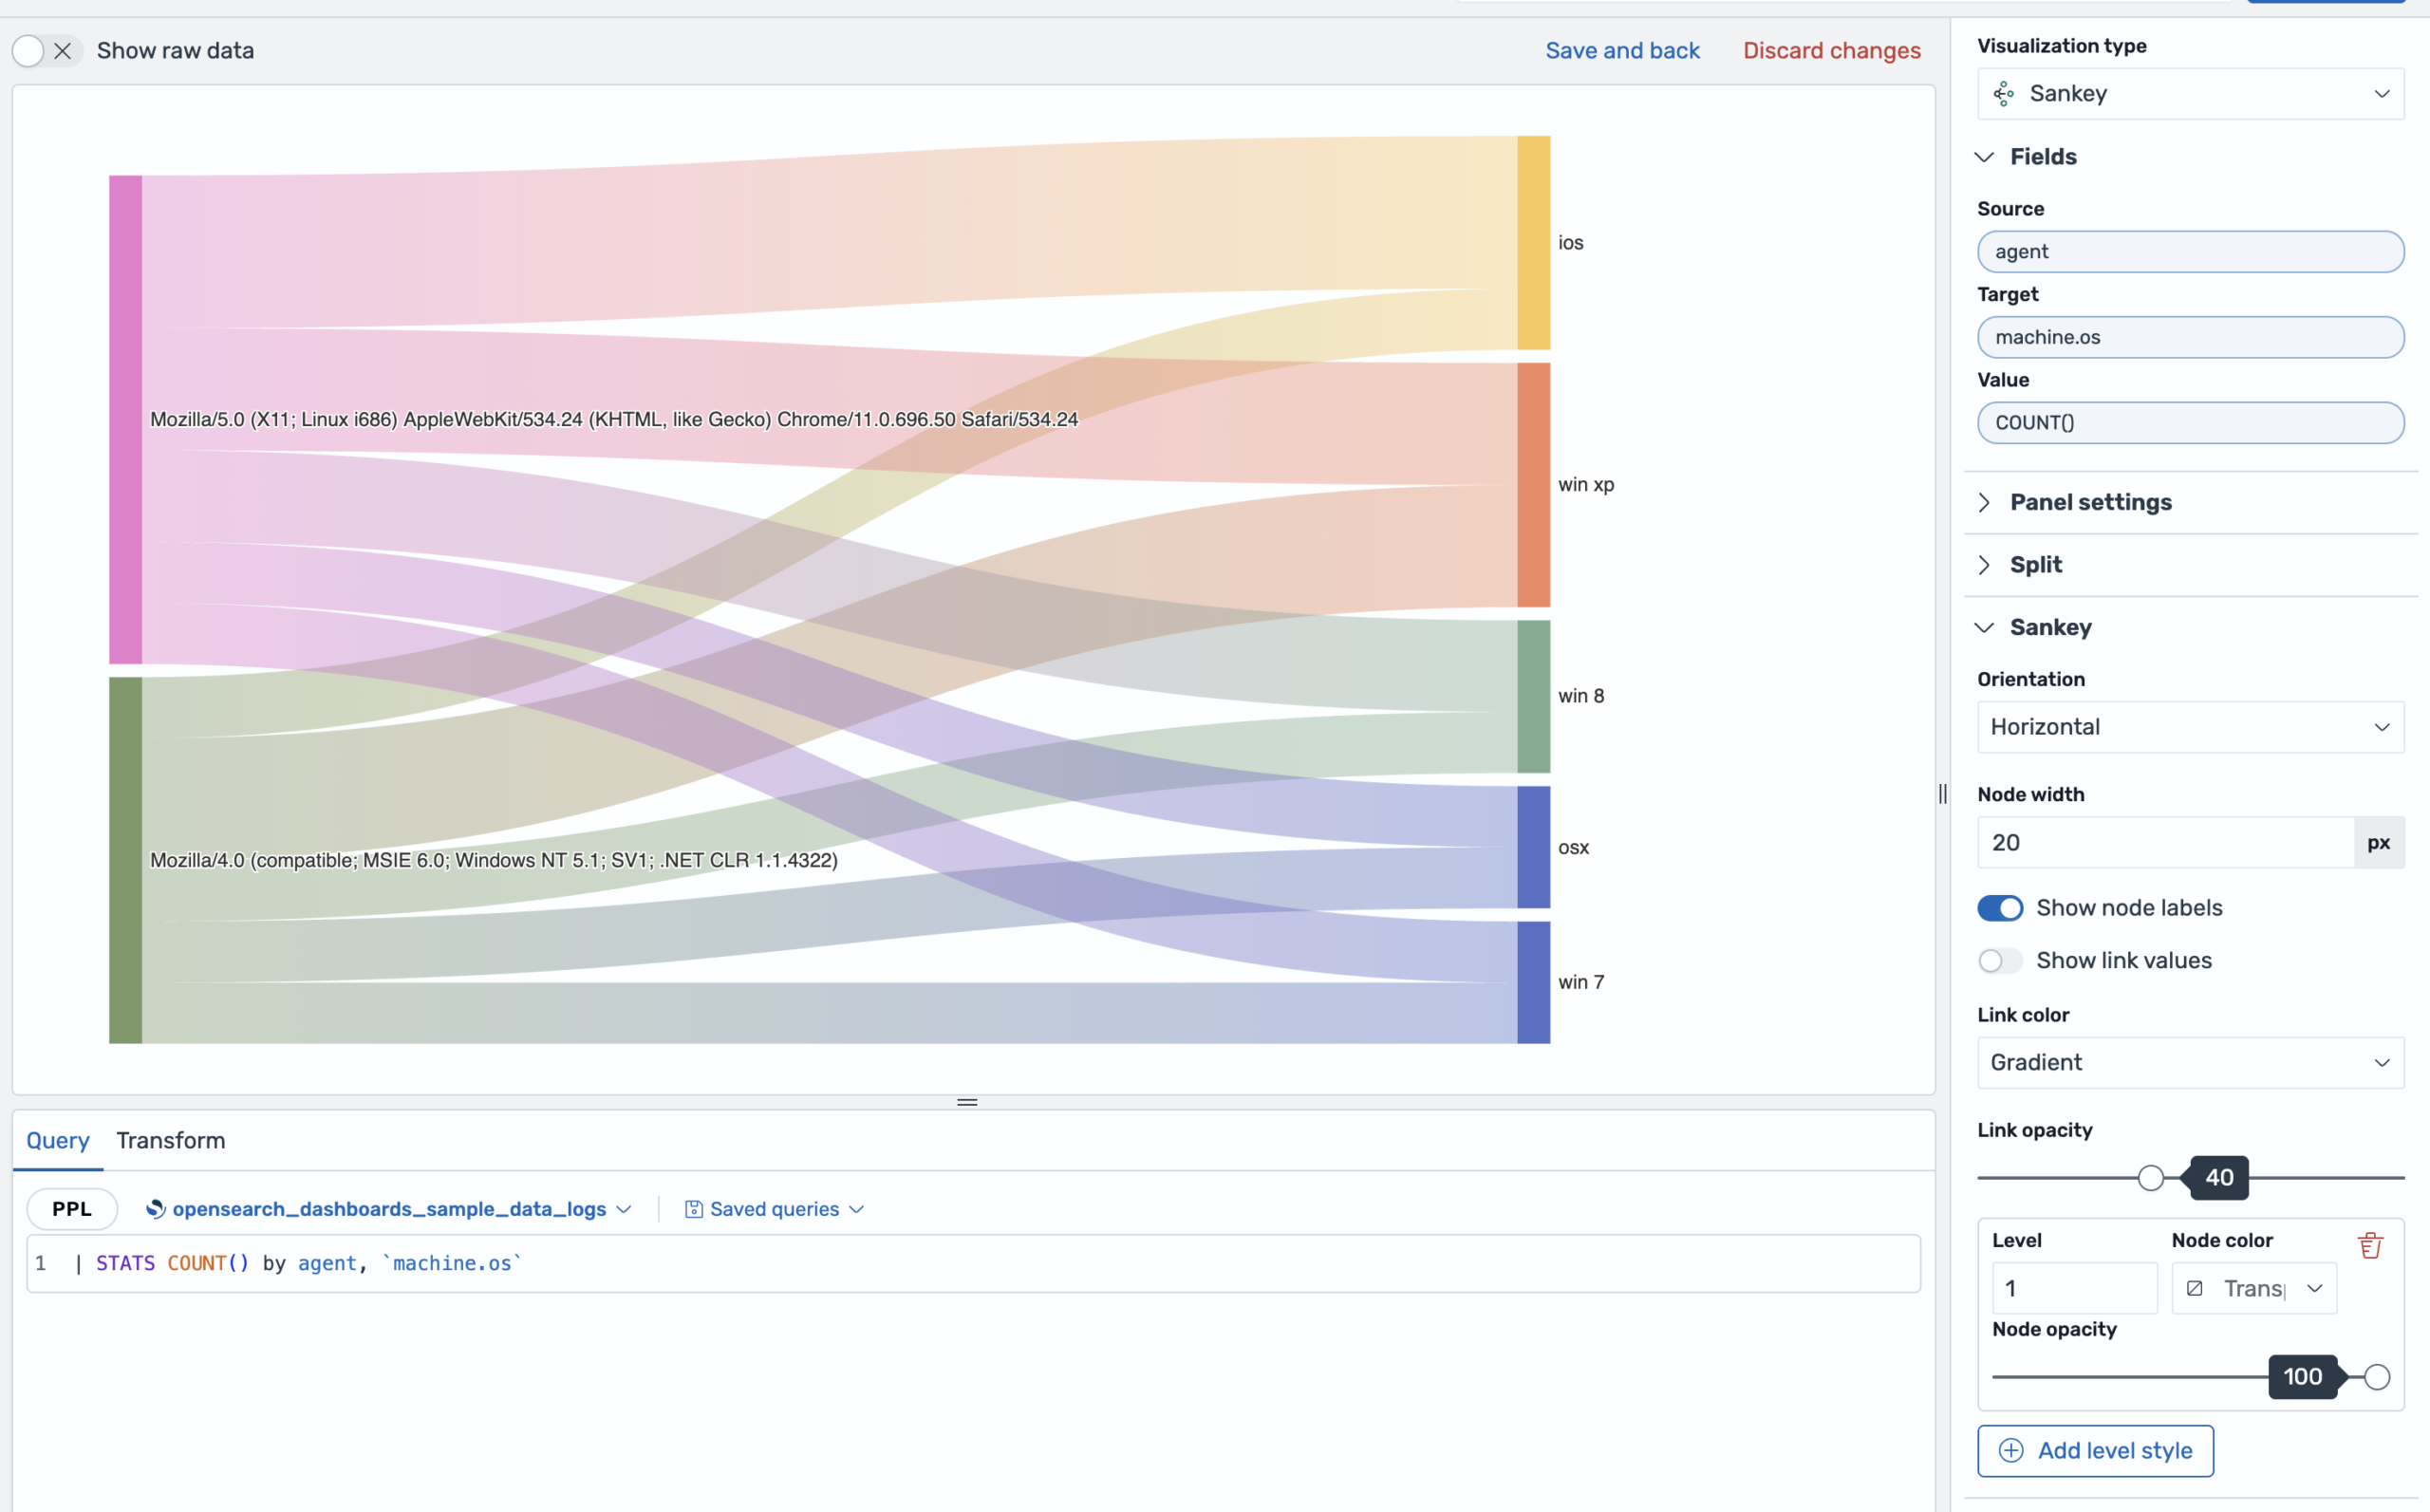
A new Sankey visualization in Discover and Dashboards shows how volume flows between two fields, such as from services to severity levels. You can build one directly from a PPL stats ... by query by choosing a source, target and value field. Display options include orientation, node labels, link colors and per-level styling.
The following image shows a Sankey chart built from stats count() by agent, machine.os, displaying flows between two fields.
 Query faster and at larger scale using PPL
In OpenSearch 3.10, PPL queries run faster and support more kinds of data:
- Time-range index pruning: Discover now sends the selected time range with each PPL query, and the SQL plugin uses it to skip indexes that hold no data in that range before reading their mappings. A
logs-*query within the last 30 minutes no longer reads every rolled over index in the pattern. Pruning also works on data stream backing indexes and on queries that filter by@timestamp,timestamp, ortime, producing identical results. - Streaming results and asynchronous queries: When streaming results are enabled, Discover shows PPL results as a long-running query runs. A row count updates as results arrive, and you can end the query early. Applications can submit PPL queries asynchronously, check how far along they are by using
progress.fraction_done, and cancel them by usingDELETE /_plugins/_async_query/{id}. flat_objectfields: PPL can now read, filter, convert, and inspect the type of the leaf fields offlat_objectfields, such asattributes.duration_ms, by usingcastandtypeof. Filters such as=,in,likeandisnullrun as index lookups.- Cross-cluster queries: Queries such as
source=remote:logs-*,*:logs-*, or a mix of local and remote patterns, now work in PPL and in Discover. Previously, these queries only worked if a matching index also existed on the local cluster. For more information, see Cross-cluster search. - Unicode string literals are now supported in the Calcite PPL engine.
- Regex match limit: A new dynamic setting,
plugins.ppl.regex.match.limit(default100000), limits the number of steps performed during a singleparseorrexregex match. One pathological pattern can no longer occupy a worker thread for a long time.
Search modernization
AI-powered search applications benefit from relevance tuning that is simple to configure, query generation that behaves predictably, and vector storage that scales efficiently. OpenSearch 3.10 advances all three with a new fusion mode that brings hybrid score combination into the query itself, experimental search templates for agentic search, deeper compression options for half-precision vectors, and an easier path to connecting with models on Google Gemini Enterprise Agent Platform.
Run hybrid queries without a search pipeline
OpenSearch 3.10 introduces fusion mode for the hybrid query, which lets you define score normalization and combination directly in the query body instead of in a search pipeline. Because retrieval logic and fusion configuration are contained in one request, hybrid search can be easier to configure. You can also reuse your existing pipeline configurations using the source: pipeline option. Fusion mode makes hybrid queries composable: a pipeline-based hybrid query must be the top-level query, but a fused hybrid query can be nested inside a bool, dis_max, or another fused hybrid query, and rescoring applies to the combined results. Fusion mode retains the existing normalization and combination techniques, including min-max, z-score, L2, and reciprocal rank fusion. It also supports rescoring, explain, and pagination without extra configuration. A new weights parameter lets each request set subquery weights in fusion mode or for pipeline-based queries so you can tune relevance per request without changing shared configuration. For more information, see Fusion mode.
Return a full page of distinct groups from hybrid queries
Hybrid queries that use collapse can now return a full page of distinct groups. A new index setting collects the top groups rather than the top documents, so a single group with many high-scoring documents does not displace others from the page, which can suit search experiences that show one result per product, author, or category. This functionality is disabled by default. For instructions on enabling this option, see Collapsing hybrid query results.
Connect to Gemini Enterprise Agent Platform models
OpenSearch 3.10 makes it easier to connect OpenSearch to models on Google Gemini Enterprise Agent Platform (formerly Vertex AI). The google_cloud connector protocol, introduced in OpenSearch 3.9, manages Google Cloud credentials in the cluster, much as aws_sigv4 does for Amazon Bedrock and SageMaker. It creates and refreshes OAuth2 access tokens on the cluster’s behalf, so you don’t need to rotate short-lived tokens or build your own refresh automation. It supports service account keys and Application Default Credentials (for example, GKE Workload Identity or the Compute Engine metadata server). New in OpenSearch 3.10, Gemini Enterprise Agent Platform endpoints are included in the default trusted endpoint list, and the blueprints for Gemini text generation, text embeddings, streaming, and batch inference have been updated and tested, so you can create a working connector in fewer steps. For more information, see Google Cloud authentication.
Keep agentic search predictable using search templates
Agentic search translates natural language questions into OpenSearch queries. OpenSearch 3.10 introduces agentic search templates as an experimental way to make that translation more predictable. Instead of asking the LLM to write the full query DSL, you register existing search templates, and the LLM selects the most appropriate one and fills in only its parameters, such as query text, filters, or sort fields. Because the query structure stays under your control and the model generates less query text, results can often be more consistent across requests. Template filling can run in the OpenSearch cluster or the OpenSearch Agent Server by using the same registered templates. For more information, see Using search templates as examples.
Combine half-float storage with deeper compression in k-NN search
OpenSearch 3.10 builds on the vector storage and compression options introduced in 3.9. Half-precision (half_float) vectors now support 2-bit and 4-bit scalar quantization, so you can pair 16-bit storage with higher compression when balancing memory against recall. Quantized search is also faster: new SIMD kernels can accelerate graph construction for 2-bit and 4-bit indexes, and 1-bit quantized queries are now scored using a precomputed table.
Use k-NN queries in more search scenarios
k-NN queries stored in percolator fields now run with exact search instead of failing when a document is percolated, so you can match incoming documents against saved vector queries. Rescoring now also works with expand_nested_docs for the Lucene engine, so nested document results are refined using full-precision distances.
Boost query throughput and reduce graph memory usage with Intel Scalable Vector Search
OpenSearch 3.10 features a sandbox engine framework for experimental vector search engines in the k-NN plugin, with Intel Scalable Vector Search (SVS) as the first tenant. SVS Vamana graphs and LeanVec compression are designed for substantially higher query throughput and lower graph memory than HNSW-fp16 at equal recall, with the largest gains in high-recall configurations. SVS with LeanVec compression delivered 2.6× the query throughput of Faiss HNSW-fp16 at the recall of 0.95, while using 37–40% less graph memory. Benchmark testing results are reported in the RFC.
Scalability and resiliency
As clusters take on more data and more tenants, you need simpler ways to bring data in, recover from failures, and balance capacity utilization. OpenSearch 3.10 extends pull-based ingestion to data at rest in object storage, helps plugins resume the tasks they stopped after a snapshot restore, and adds request throttling for workload groups, along with a new Send Notification API and expanded Query Insights.
Ingest data directly from object storage using pull-based ingestion
Pull-based ingestion lets OpenSearch fetch data directly from a source, and until now those sources have been streaming platforms such as Apache Kafka and Amazon Kinesis. OpenSearch 3.10 extends the model to data at rest with a new object store source, which reads NDJSON files directly from Amazon S3, Google Cloud Storage, Azure Blob Storage, or a shared file system. Database exports and files from upstream jobs can now flow into OpenSearch the same way, without a separate streaming layer or bulk indexing client. Each record maps to a stable document ID, so recovery and replays do not create duplicates. This first version supports uncompressed, append-only NDJSON, making it suitable for bulk loads of data that does not change during ingestion. For more information, see Object store source.
Restore plugin state cleanly from a snapshot
Snapshots are the main way to recover or move OpenSearch data, but restoring plugin state from system indexes can be difficult. Security blocks REST administrators from restoring system indexes, so a restore usually requires the admin certificate. Even then, some plugins may end up inconsistent with the new cluster (for example, monitors skip new documents, and managed indexes restart their policies). OpenSearch 3.10 adds a post-restore hook for plugins. Now, Alerting and Index State Management (ISM) carry restored state over to the new cluster, and both use the hook. Restored alerting monitors resume reading new documents and keep writing alerts and findings, and ISM-managed indexes continue their policies from the state captured in the snapshot instead of starting over. The Security plugin also lets REST administrators restore an approved list of system indexes, so disaster recovery and cluster migration for indexes on that list do not need the admin certificate. Because results can depend on restore order and configuration, review the per-plugin guidance before planning a restore. For more information, see Restoring monitors and alerts from a snapshot and Restoring ISM from a snapshot.
Limit the number of concurrent search requests per workload group
OpenSearch 3.10 adds request throttling to workload management, letting you limit the number of search requests a workload group runs at the same time. You can set a per-node limit (node_limit), which each node enforces locally with no added latency, or a strict cluster-wide limit (shared_limit), which adds latency from distributed coordination and is best reserved for cases that need exact cluster-wide enforcement. For each workload group, you can choose whether the limits apply to the group as a whole, per user, or per role, which can help keep any single tenant from taking all of the search capacity. Support for queueing these requests until capacity is available is planned for a future release. For more information, see Workload group throttling.
Reuse notification channels from any application with a new Send Notification API
A new Send Notification API lets applications and clients deliver messages through the email, chat, SNS, and webhook channels already configured in OpenSearch, so you do not need to build a separate integration for each channel type. Each request targets a single channel by its ID, and a new notifications_send_access role allows sending without permission to create or modify channels. For more information, see the Notifications API.
Identify active queries by user, role, and application in Query Insights
Query Insights in OpenSearch 3.10 shows each running PPL query as a single entry in Live Queries and adds user, role, and application ID columns and sortable live query tables, which can make it easier to identify the users running specific queries and the source of cluster load.
Security
Security updates in OpenSearch 3.10 focus on managing access control at scale and protecting sensitive key material. This release adds bulk APIs for roles, role mappings, and action groups, supports storing on-behalf-of token keys in a keystore with AES-256-GCM encryption, and adds more detail to audit logs and security configuration workflows.
Update many roles, role mappings, and action groups at once
OpenSearch 3.10 adds bulk create and update operations to the Security plugin’s roles, role mappings, and action groups APIs, so a single request can apply many access control definitions at once. Each request is validated in full before any change is written, and one invalid or unauthorized entry causes the whole request to be rejected, which can help keep security configuration consistent when changes are applied through automation or infrastructure-as-code pipelines. Definitions that are not included in the request stay unchanged, so you can update a targeted set of roles without rewriting the entire configuration.
Store on-behalf-of token keys in a keystore
OpenSearch 3.10 strengthens on-behalf-of tokens by encrypting their role claims with AES-256-GCM and a derived key. It lets you load the signing and encryption keys from a node-level keystore instead of storing them in the security index. Keeping key material and its passwords in the OpenSearch keystore may simplify alignment with internal key handling and FIPS requirements. Tokens remain valid during a rolling upgrade from the previous release. Existing inline key configuration continues to work, so you can adopt keystore-based keys for each cluster at your own pace. For more information, see Authorization tokens.
Investigate failed logins from audit logs
Failed login audit events now record the attempted user and the reason the credential was refused, even when authentication fails before a user is established, which can make suspicious login attempts easier to investigate. Raw tokens are not stored.
Protect every resource type in a shared index
Resource sharing now requires every resource type stored in the same index to be protected together, so a shared index cannot be left partially covered. The Security plugin flags misconfigurations at startup, and you should review your protected resource type settings before upgrading.
Run Security configuration changes as background tasks
Security configuration write APIs now accept a wait_for_completion parameter, so changes to roles, role mappings, users, and other settings can run as background tasks that you can check using the Tasks API. This can make automation more resilient in large clusters. The default behavior is unchanged.
Infrastructure updates
OpenSearch 3.10 includes JDK security patches and an update to supported distribution platforms.
JDK security fixes and platform updates
OpenSearch 3.10 bundles updated OpenJDK builds that include the October 2026 security fixes, so deployments that use the bundled JDK can apply these patches without a separate JDK upgrade. To align with upstream JDK platform support, macOS x64 archive distributions are no longer produced starting with this release. Users on Apple silicon or Linux are not affected.
Getting started with OpenSearch 3.10
You can download OpenSearch 3.10 today in your preferred distribution or try it in OpenSearch Playground. The release notes, documentation release notes, and updated documentation contain the full set of changes. We would love to hear how these features fit into your workflows, so share your feedback on the community forum, GitHub, or Slack. Happy searching!