As organizations increasingly rely on cloud services, monitoring and detecting anomalies in system behavior has become crucial for maintaining reliable operations. In this post, we’ll explore recent improvements to the Amazon OpenSearch Service anomaly detection feature, highlighting how these enhancements have helped EBSCO Information Services optimize their transaction logging system monitoring.
Introduction
Anomaly detection in Amazon OpenSearch Service helps users automatically identify unusual patterns in their data. While the feature has proven valuable for many users, we have recognized opportunities for improvement based on customer feedback. This post details significant updates to the Anomaly Detection plugin model, focusing on rule-based anomaly detection and its real-world applications.
The challenge
EBSCO Information Services is a leading provider of research databases and discovery services. While EBSCO’s core search engine is proprietary, the company leverages Amazon OpenSearch Service specifically for monitoring transaction logging across their product suite. This monitoring capability plays a vital role in understanding customer engagement with EBSCO products and helps users make informed decisions about database subscriptions through detailed usage reporting.
While activity levels across EBSCO’s products naturally fluctuate, significant and sustained changes in usage patterns can indicate potential issues. Most commonly, these changes result from transaction producers inadvertently modifying their application or logging logic. In these cases, particularly when there are substantial drops in activity, EBSCO needs to quickly identify the change and alert the responsible development team.
Initially, EBSCO faced two primary challenges related to anomaly detection:
- False positives: The system generated an excessive number of alerts, making it difficult to isolate genuinely anomalous patterns.
- Missing critical events: The system sometimes failed to identify significant volume drops, including instances where service volumes decreased by up to 50%.
Enhanced features: Customizable suppression rules
To address these challenges, we’ve implemented significant improvements in OpenSearch 2.17 and later, focusing on customizable suppression rules. This enhancement allows users to set specific thresholds in order to ignore anomalies based on both absolute values and relative percentages.
The suppression rules feature is particularly useful for handling common scenarios that previously generated false positives. For example, in monitoring transaction volumes, EBSCO could configure rules to suppress alerts when variations stay within expected thresholds (such as ignoring drops lower than 25% and increases greater than 50% above normal levels) while still detecting significant drops that might indicate real issues.
Additionally, in OpenSearch 2.19 and later, we have added the capability for users to add more general criteria for what a detector will consider to be an anomaly. Each feature in a detector can now be configured so that only spikes or dips in the data for that feature are provided. For example, if a user is configuring a feature that analyzes CPU data across their fleet, they can configure their features so that anomalies are only detected if the actual values are higher than the expected values because of a spike in CPU. A dip in CPU in this case would not trigger anomalies.
Implementation and results
After implementing these improvements, EBSCO saw significant enhancements in their anomaly detection capabilities:
- Reduced false positives: Through customizable suppression rules, they could filter out minor variations (like 16% changes) while maintaining sensitivity to genuine anomalies.
- More actionable alerts: The team now receives fewer but more meaningful notifications, allowing them to focus on genuine issues requiring attention.
Configuring anomaly detection rules: A community example
In a forum post, a user wanted to detect significant changes in log volume, using the Anomaly Detection plugin to count occurrences based on a timestamp field. However, the default settings flagged anomalies for relatively small increases of about 2–5%, which was too sensitive. Their goal was to receive alerts only for changes of about 10% or more.
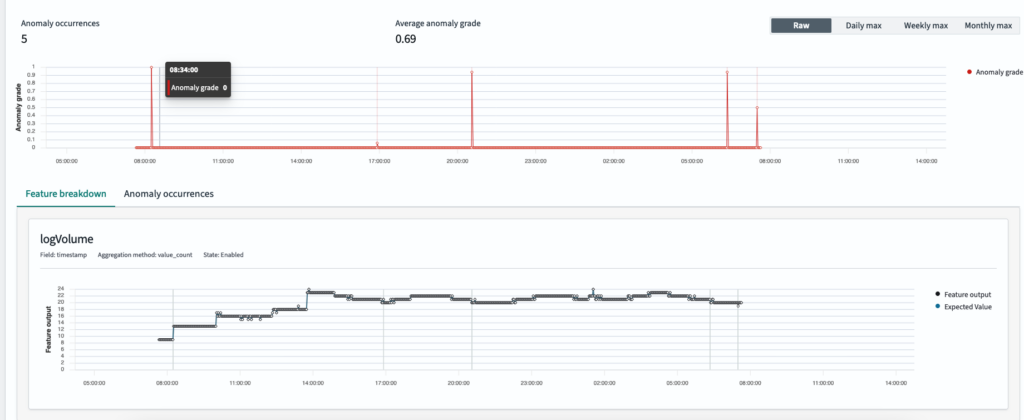
To illustrate this scenario, we generated synthetic log data over a 24-hour period with a gradual upward trend. We then introduced random “change points,” where the log count level would shift by 2–5%. A feature was set up to track total log volume, as shown in the following image.
Initially, without rule-based anomaly detection, the system reported multiple anomalies—even for minor fluctuations—making it difficult to spot genuinely significant changes, as shown in the following image.
We configured a rule to only flag anomalies that deviate at least 10% (either above or below) from the expected value, as shown in the following image, thus filtering out the noise. This ensures that only the meaningful spikes or dips are detected.

Note: The user interface for setting rules may change. For more information, see Anomaly detection dashboards and visualizations.
The following image shows the anomaly results generated when the rule was applied.
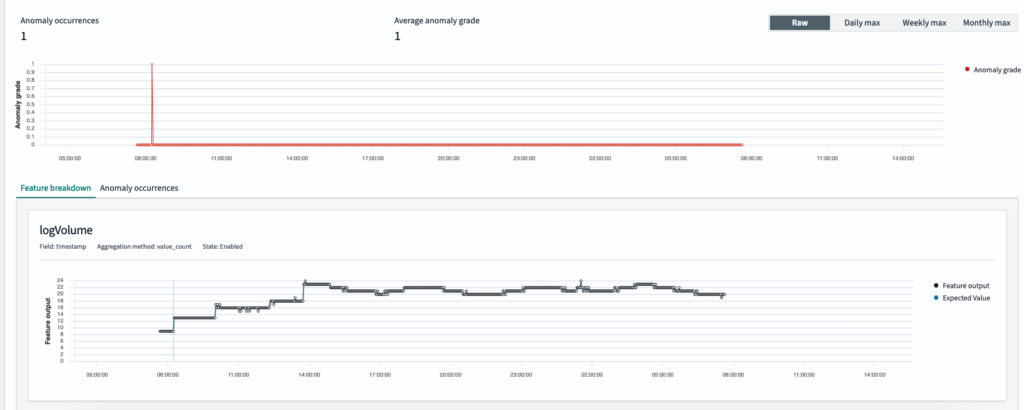
Note: If no custom rule is specified, the anomaly detection feature defaults to a built-in filter that suppresses anomalies with less than a 20% deviation from the expected value for each enabled feature.
Technical details
The foundation of suppression rules is expected normal values. To build an expected value for an anomalous point, Random Cut Forest (RCF), the algorithm behind OpenSearch anomaly detection, replaces the anomalous point’s most suspicious dimension with a typical value learned from historical data. Here, each dimension corresponds to a metric value within a context or recent-history window, and the overall anomaly score depends on these dimensions.
RCF partitions the data by selecting a dimension ii with a probability proportional to its range and then choosing a random cut value within that range. If lili is the difference between the maximum and minimum values observed in dimension ii, the probability of cutting along ii is li∑jljli∑jlj. These random cuts isolate anomalous points, and RCF sums the anomaly scores across all dimensions to compute the final anomaly score. To identify which dimension contributes most to an anomaly, RCF tracks each dimension’s portion of the total anomaly score. The dimension with the highest contribution is deemed the most suspicious.
RCF then imputes a more “normal” value for this suspicious dimension by treating it as if it were missing in the queried point. Specifically, the algorithm performs the following steps:
- Root to leaf: RCF starts at the root of each tree in the forest and traverses downward toward a leaf.
- Splitting normally: At each node, if the node’s split dimension is present in the query point, RCF follows that branch.
- Missing dimension: If the split dimension is “missing” (that is, the dimension must be replaced), the algorithm considers both child nodes—one on either side of the random cut—and then follows whichever path has the lower anomaly score. In essence, we are searching for an expected plausible value, and a lower score indicates that following that path is less likely to lead to an anomaly. By selecting the lower-score path, we ensure the resulting completion is more consistent with previously observed data and thus is less likely to be an anomaly.
- Arriving at a leaf: Eventually, RCF reaches a leaf node deemed relatively normal. The algorithm uses that leaf’s value for the suspicious dimension, creating a “corrected” version of the anomalous point.
- Final imputation: RCF gathers these candidate values from all trees and takes their median as the final expected value for the anomalous dimension.
Looking ahead
OpenSearch rule-based anomaly detection already supports the suppression of anomalies when the difference or relative ratio between actual and expected values meets certain conditions. However, this is just the beginning. We plan to introduce additional rule types—such as only reporting anomalies that persist for multiple consecutive intervals. For example, while a CPU spike to 100% might be flagged as an anomaly by default, this may only concern a user if CPU usage remains between 80% and 100% for 10 consecutive intervals. In this case, the system can hold off on raising an alert until the extended condition is met.
We are also exploring rules based on categorical data, enabling component-specific thresholds or conditions. Different teams or owners can then define tailored anomaly detection rules for their areas of responsibility. Finally, we plan to incorporate planned outages or holidays into the RCF models, giving users the ability to mark these events so that anomalies occurring during such periods are ignored. By incorporating the duration of extended anomalies, categorical data, and event calendars, OpenSearch anomaly detection can become even more flexible and accurate in separating true anomalies from ordinary fluctuations.
Conclusion
The improvements to anomaly detection in Amazon OpenSearch Service demonstrate our commitment to meeting customer needs. Through collaboration with customers like EBSCO, we continue to enhance our services to provide more accurate, useful, and customizable monitoring solutions.
To learn more about anomaly detection, see Anomaly detection.