Anomaly detection dashboards and visualizations
Introduced 2.9
OpenSearch provides an automated means of detecting harmful outliers and protecting your data when you enable anomaly detection. When applied to metrics, OpenSearch uses algorithms to continuously analyze systems and applications, determine normal baselines, and surface anomalies.
You can connect data visualizations to OpenSearch datasets and then create, run, and view real-time anomaly results from visualizations in the Dashboard interface. With only a couple of steps, you can bring together traces, metrics, and logs to make your applications and infrastructure fully observable.
Getting started
Before getting started, you must have:
- Installed OpenSearch and OpenSearch Dashboards version 2.9 or later. See Installing OpenSearch.
- Installed the Anomaly Detection plugin version 2.9 or later. See [Installing OpenSearch plugins]/(https://opensearch.org/docs/latest/install-and-configure/plugins/).
- Installed the Anomaly Detection Dashboards plugin version 2.9 or later. See Managing OpenSearch Dashboards plugins to get started.
General requirements for anomaly detection visualizations
Anomaly detection visualizations are displayed as time-series charts that give you a snapshot of when anomalies have occurred from different anomaly detectors you have configured for the visualization. You can display up to 10 metrics on your chart, and each series can be shown as a line on the chart. Note that only real-time anomalies will be visible on the chart. For more information about real-time and historical anomaly detection, see Anomaly detection, Step 3: Set up detector jobs.
Keep in mind the following requirements when setting up or creating anomaly detection visualizations. The visualization:
- Must be a Vizlib line chart
- Must contain at least a Y-axis metric aggregation
- Must not have non-Y-axis metric aggregation types
- Must use the date histogram aggregation type for the X-axis bucket
- Must have an X-axis on the bottom
- Must define one X-axis aggregation bucket
- Must have a valid time-based X-axis
Configuring admin settings
Users can only access, create, or manage anomaly detectors for resources for which they have permissions. Access to anomaly detection dashboards and visualizations is controlled by OpenSearch and OpenSearch Dashboards permissions. It is enabled by default and appears as a feature under Dashboards Management > Advanced Settings > Visualization. If the setting is disabled, it does not appear under Dashboards Management. You can disable the setting at the cluster level in the opensearch-dashboards.yml file.
Creating anomaly detectors
To start, first create an anomaly detector:
- Select Dashboard from the OpenSearch Dashboards main menu.
- From the Dashboards window, select Create and then choose Dashboard.
- Select Add an existing, then select the appropriate visualization from the Add panels list. The visualization is added to the dashboard.
- From the visualization panel, choose the ellipsis icon (
 ).
). - From the Options menu, choose Anomaly Detection > Add anomaly detector.
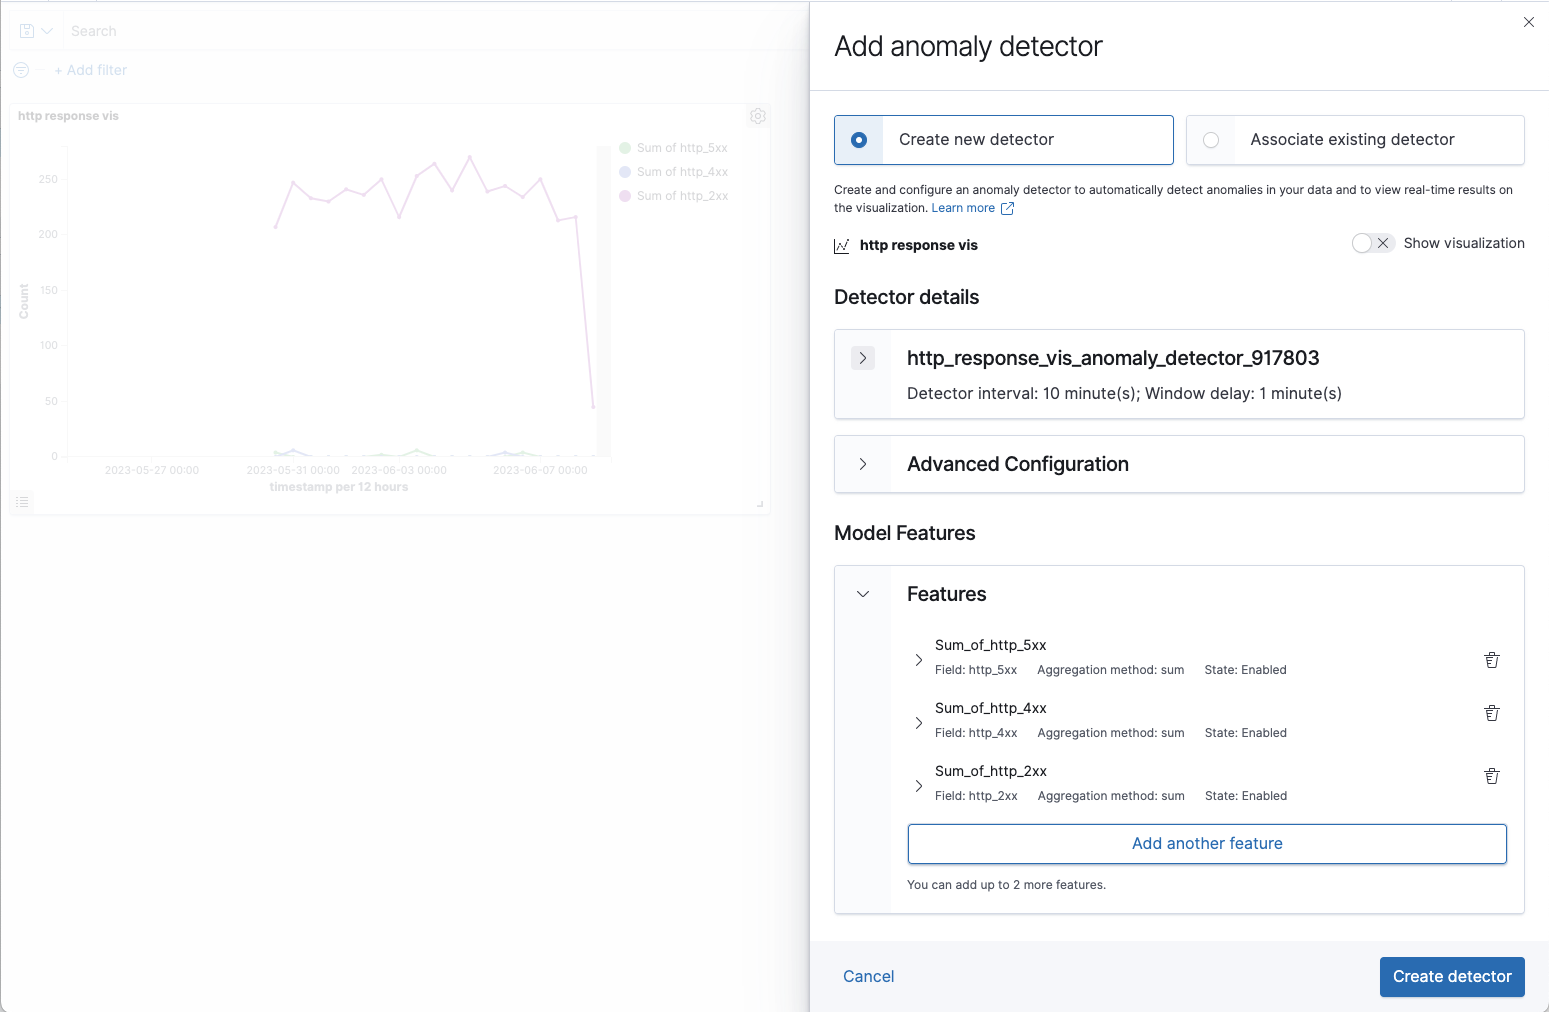
- Select Create new detector.
- Input information for Detector details and Model features. Up to five model features are allowed.
- To preview the visualization within the flyout, toggle the Show visualization button.
- Select Create detector. Once you have created a new detector, the detector is added to the visualization, as shown in the following image.
Adding anomaly detectors to visualizations
Use a single interface to add, view, and edit anomaly detectors that you want to associate with a visualization. Continuing with the visualization and dashboard in the preceding tutorial, follow these steps to associate an anomaly detector with a visualization:
- Select the ellipsis icon () from the visualization panel, then select Anomaly Detection.
- Select Associate a detector.
- From the Select detector to associate dropdown menu, select the detector. Only eligible detectors are listed in the dropdown menu.
- View basic information about the detectors. To view comprehensive details, select View detector page to open the Anomaly Detection plugin page.
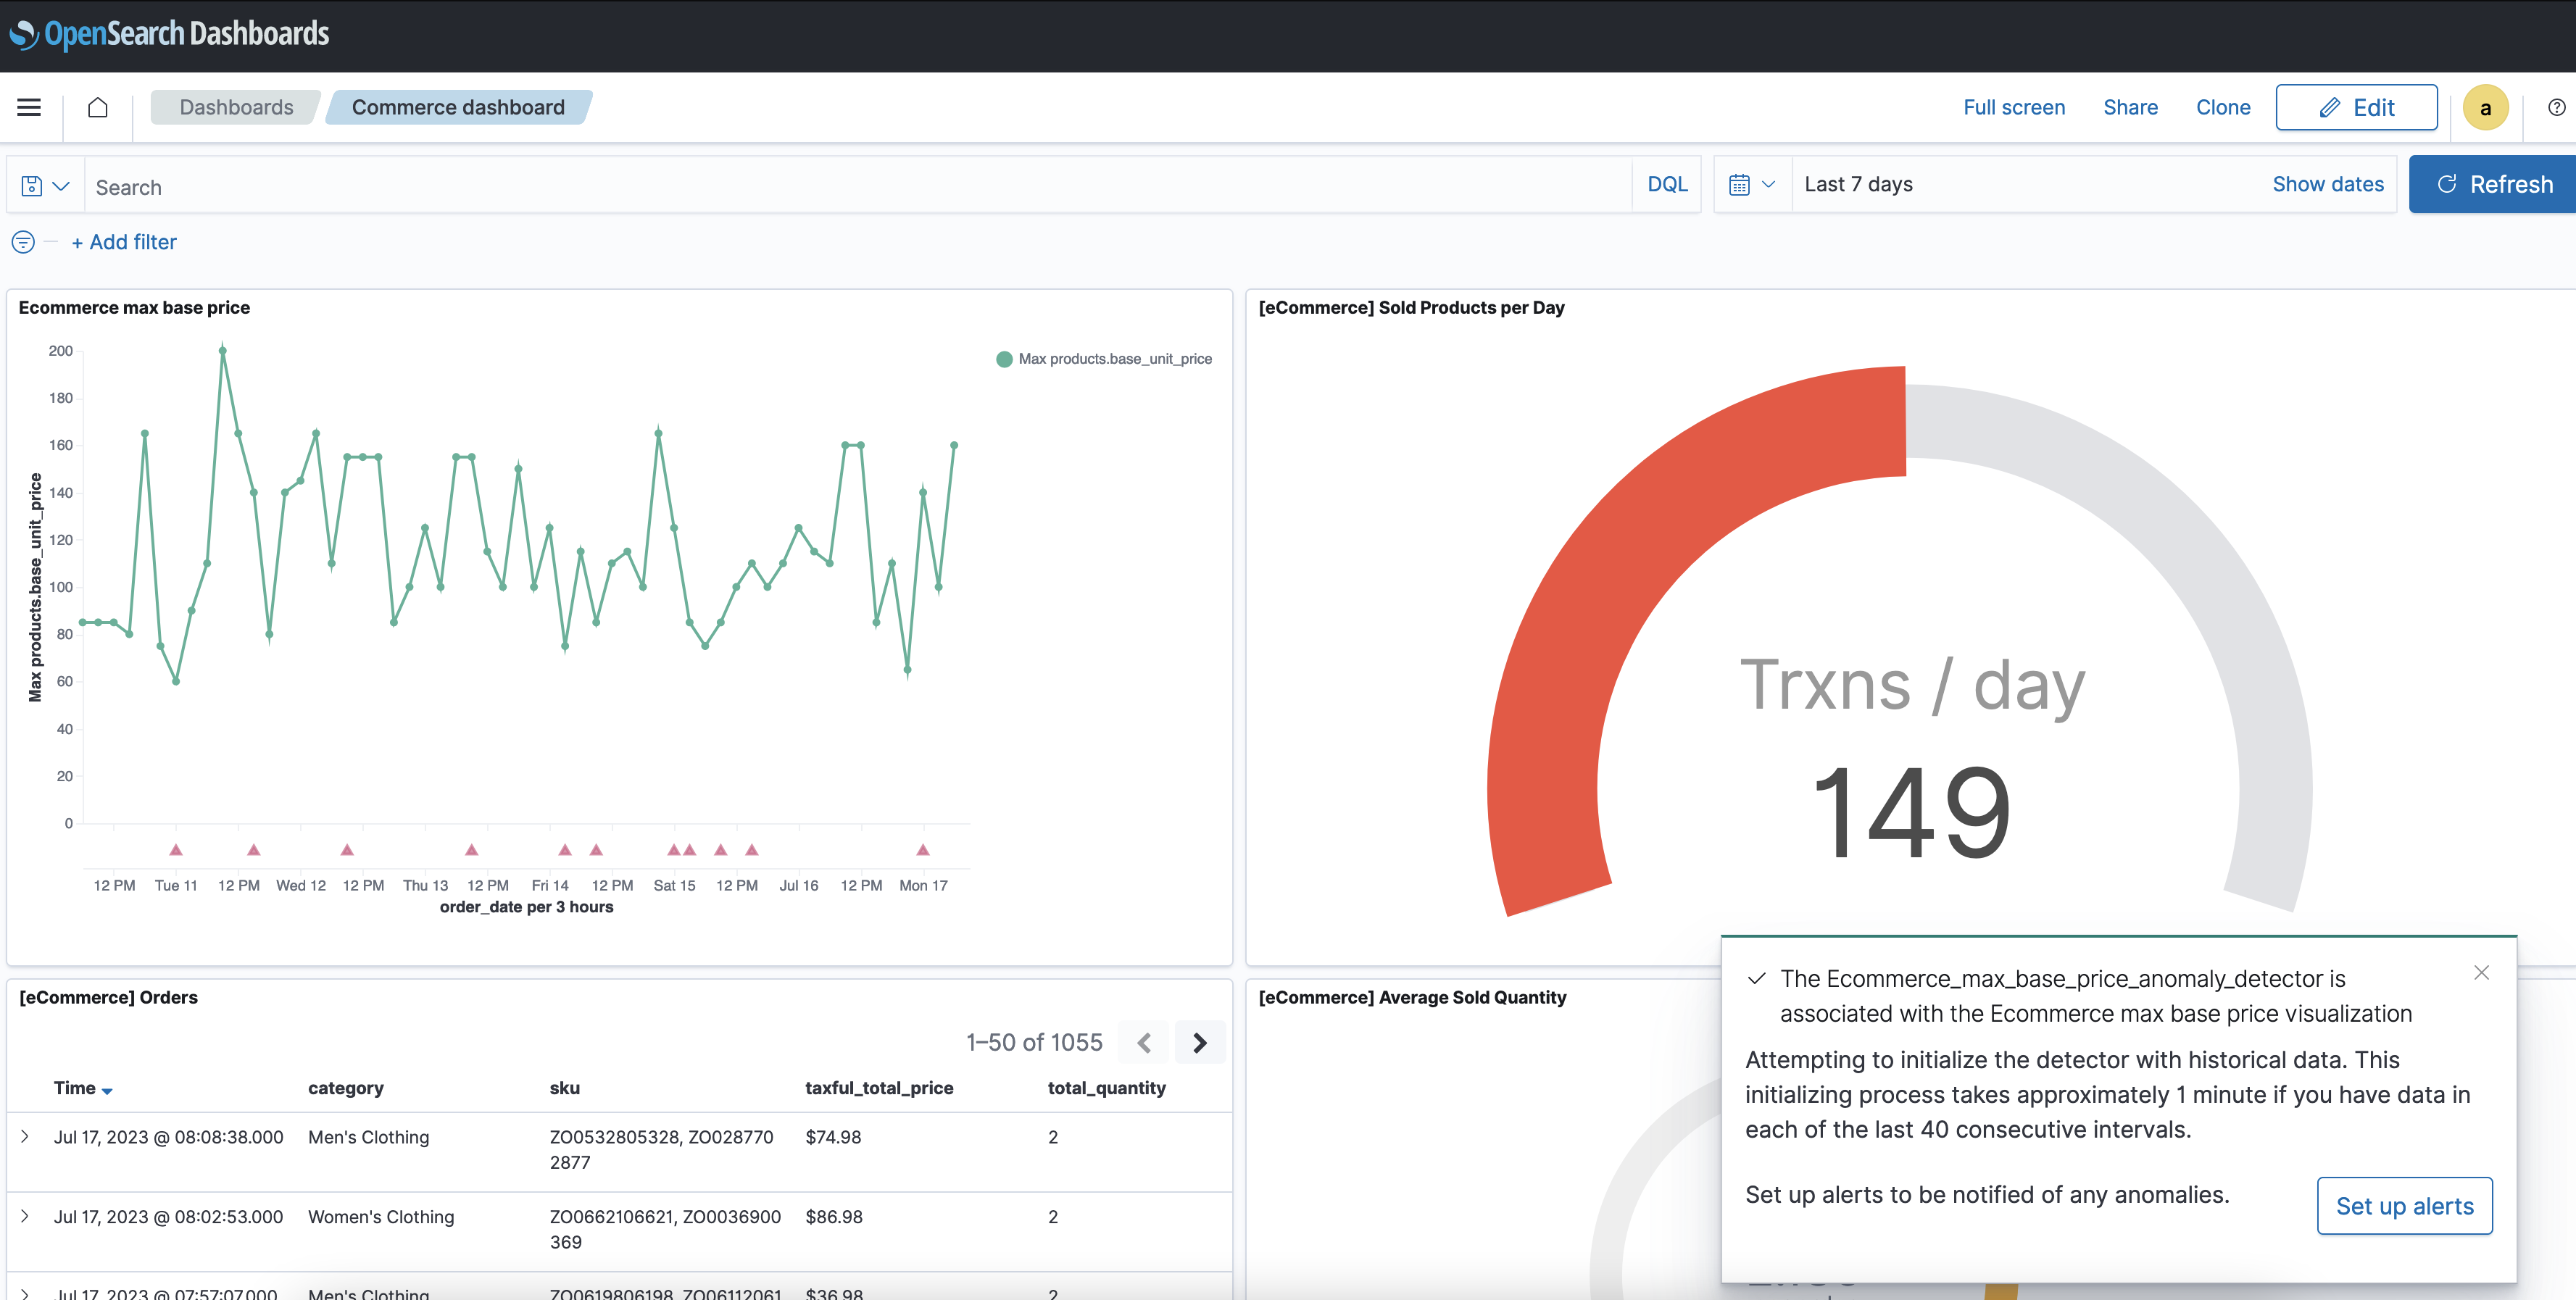
- Select Associate detector. An existing detector is now associated to the visualization, as shown in the following image.
Refreshing the visualization
Depending on the threshold settings, the visualization refreshes automatically at the specified interval. To manually refresh the visualization, select the Refresh button on the Dashboard page.