OpenSearch Dashboards quickstart guide
This quickstart guide provides tutorials on using OpenSearch Dashboards applications and tools. You can use these tutorials, either in your own environment or on OpenSearch Playground, to learn the following fundamental concepts:
- Adding sample data: Use preloaded visualizations, dashboards, and other tools to explore OpenSearch Dashboards before adding your own data.
- Using the Discover application: Analyze your data to gain insights.
- Using the Dashboards application: Create and store data visualizations.
- Customizing the appearance theme: Quickly change the OpenSearch Dashboards appearance theme from the home page.
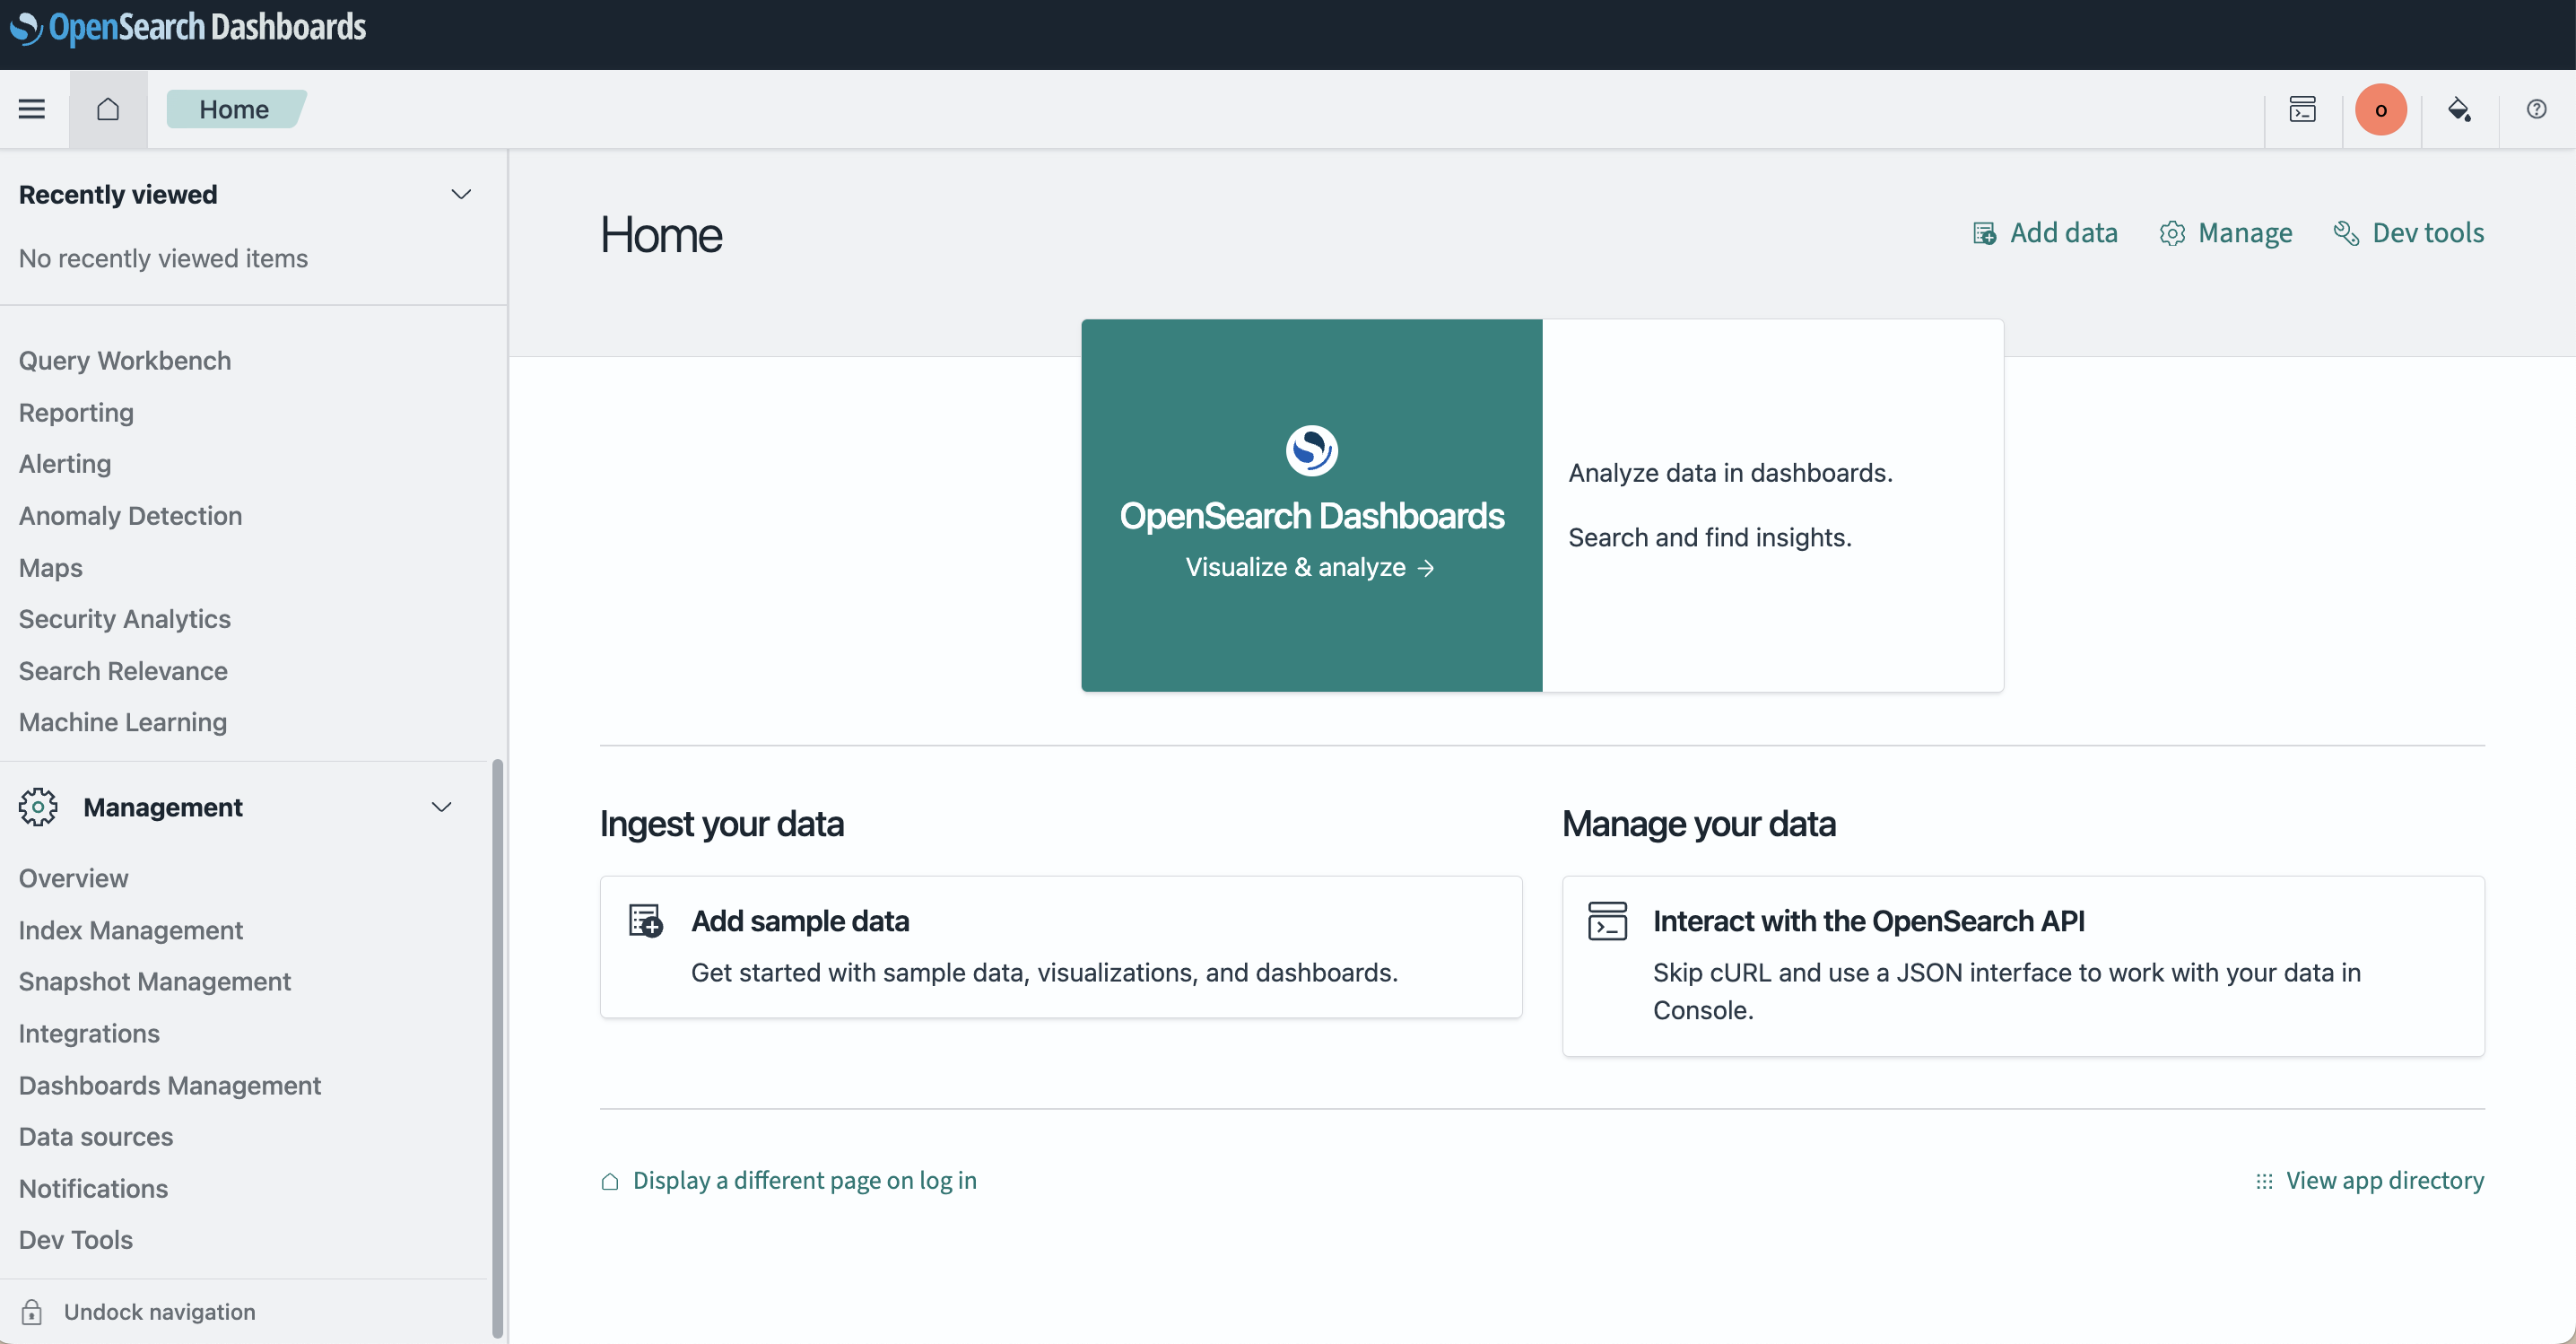
The OpenSearch Dashboards default view is shown in the following image.
Docking the navigation menu
To dock or undock the navigation menu, select the ![]() icon on the upper-left toolbar and then select Dock navigation or Undock navigation on the lower left of the menu. A docked navigation menu is shown in the preceding image.
icon on the upper-left toolbar and then select Dock navigation or Undock navigation on the lower left of the menu. A docked navigation menu is shown in the preceding image.
Before continuing with the following tutorials, make sure you’ve installed OpenSearch and OpenSearch Dashboards. For information about installation and configuration, see Install and configure OpenSearch and Install and configure OpenSearch Dashboards.
Adding sample data
The following tutorials use the Sample flight data dataset.
To add sample data, follow these steps:
- On the OpenSearch Dashboards Home page, choose Add sample data. Alternatively, choose Add data on the upper-right toolbar.
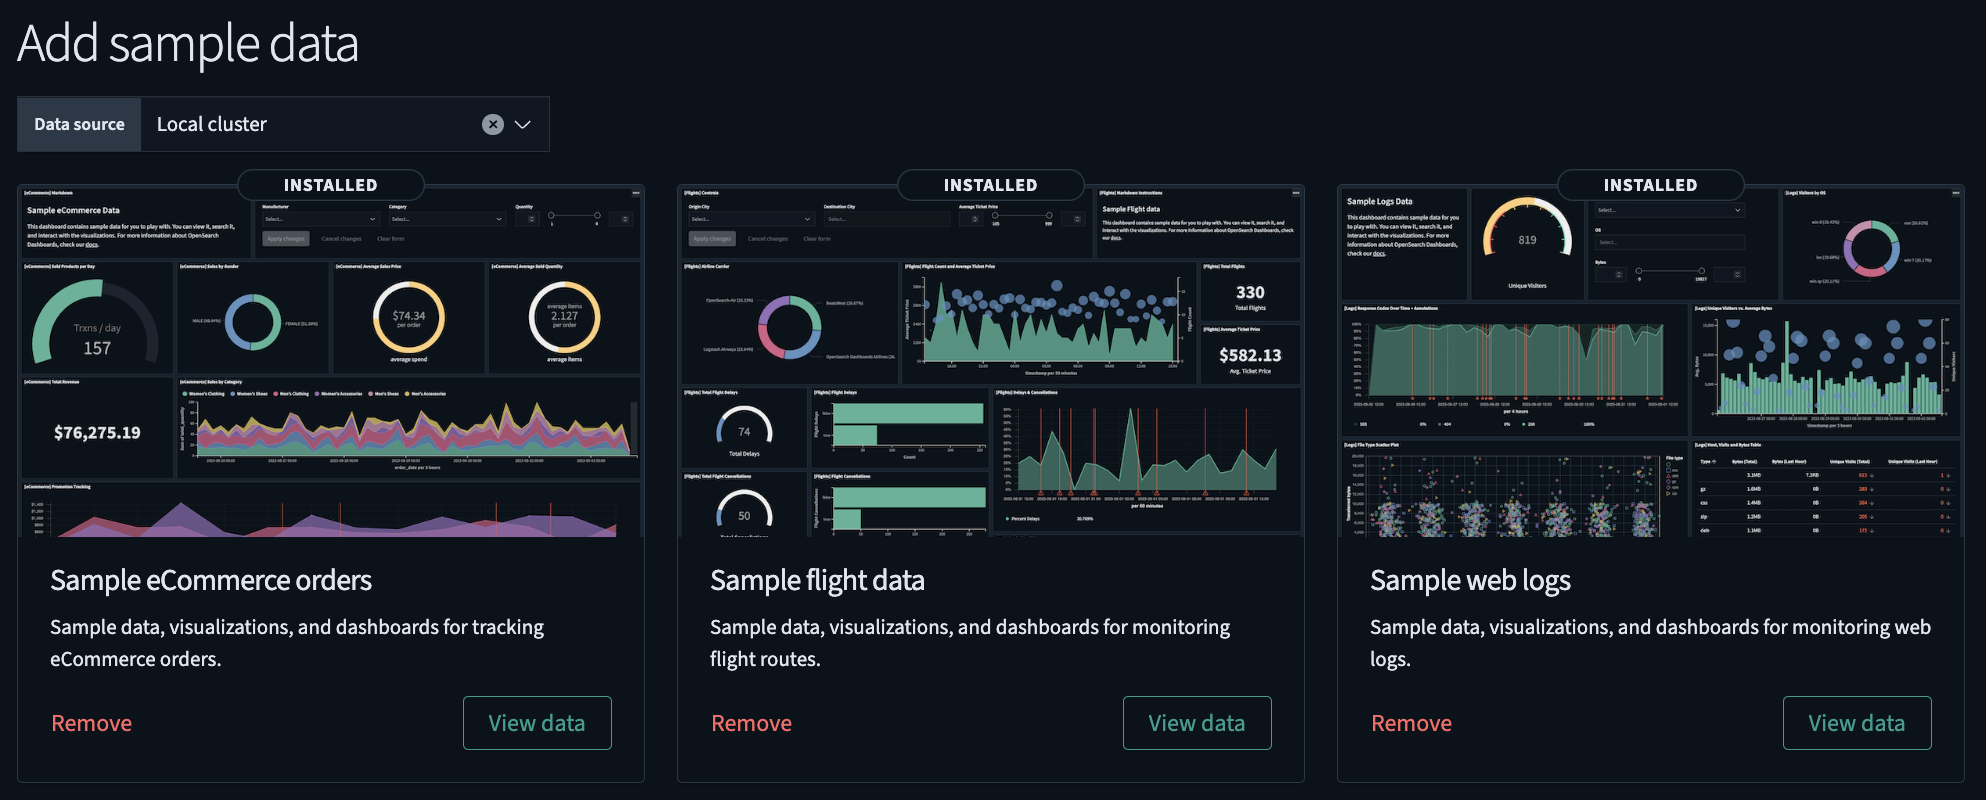
- On the Add sample data page, choose the dataset(s) you want to add to Dashboards. The following image shows the available sample datasets.
Using the Discover application
With Discover, you can:
- Choose data for analysis, set a time range for that data, search it using Dashboards Query Language (DQL), and filter the results.
- Analyze your data by querying and filtering, viewing results in a table, and examining documents.
- Create histograms to display the distribution of your data.
Follow these steps to use the Discover tool:
- From the OpenSearch Dashboards navigation menu, choose Discover.
- On the Discover page, choose the index pattern
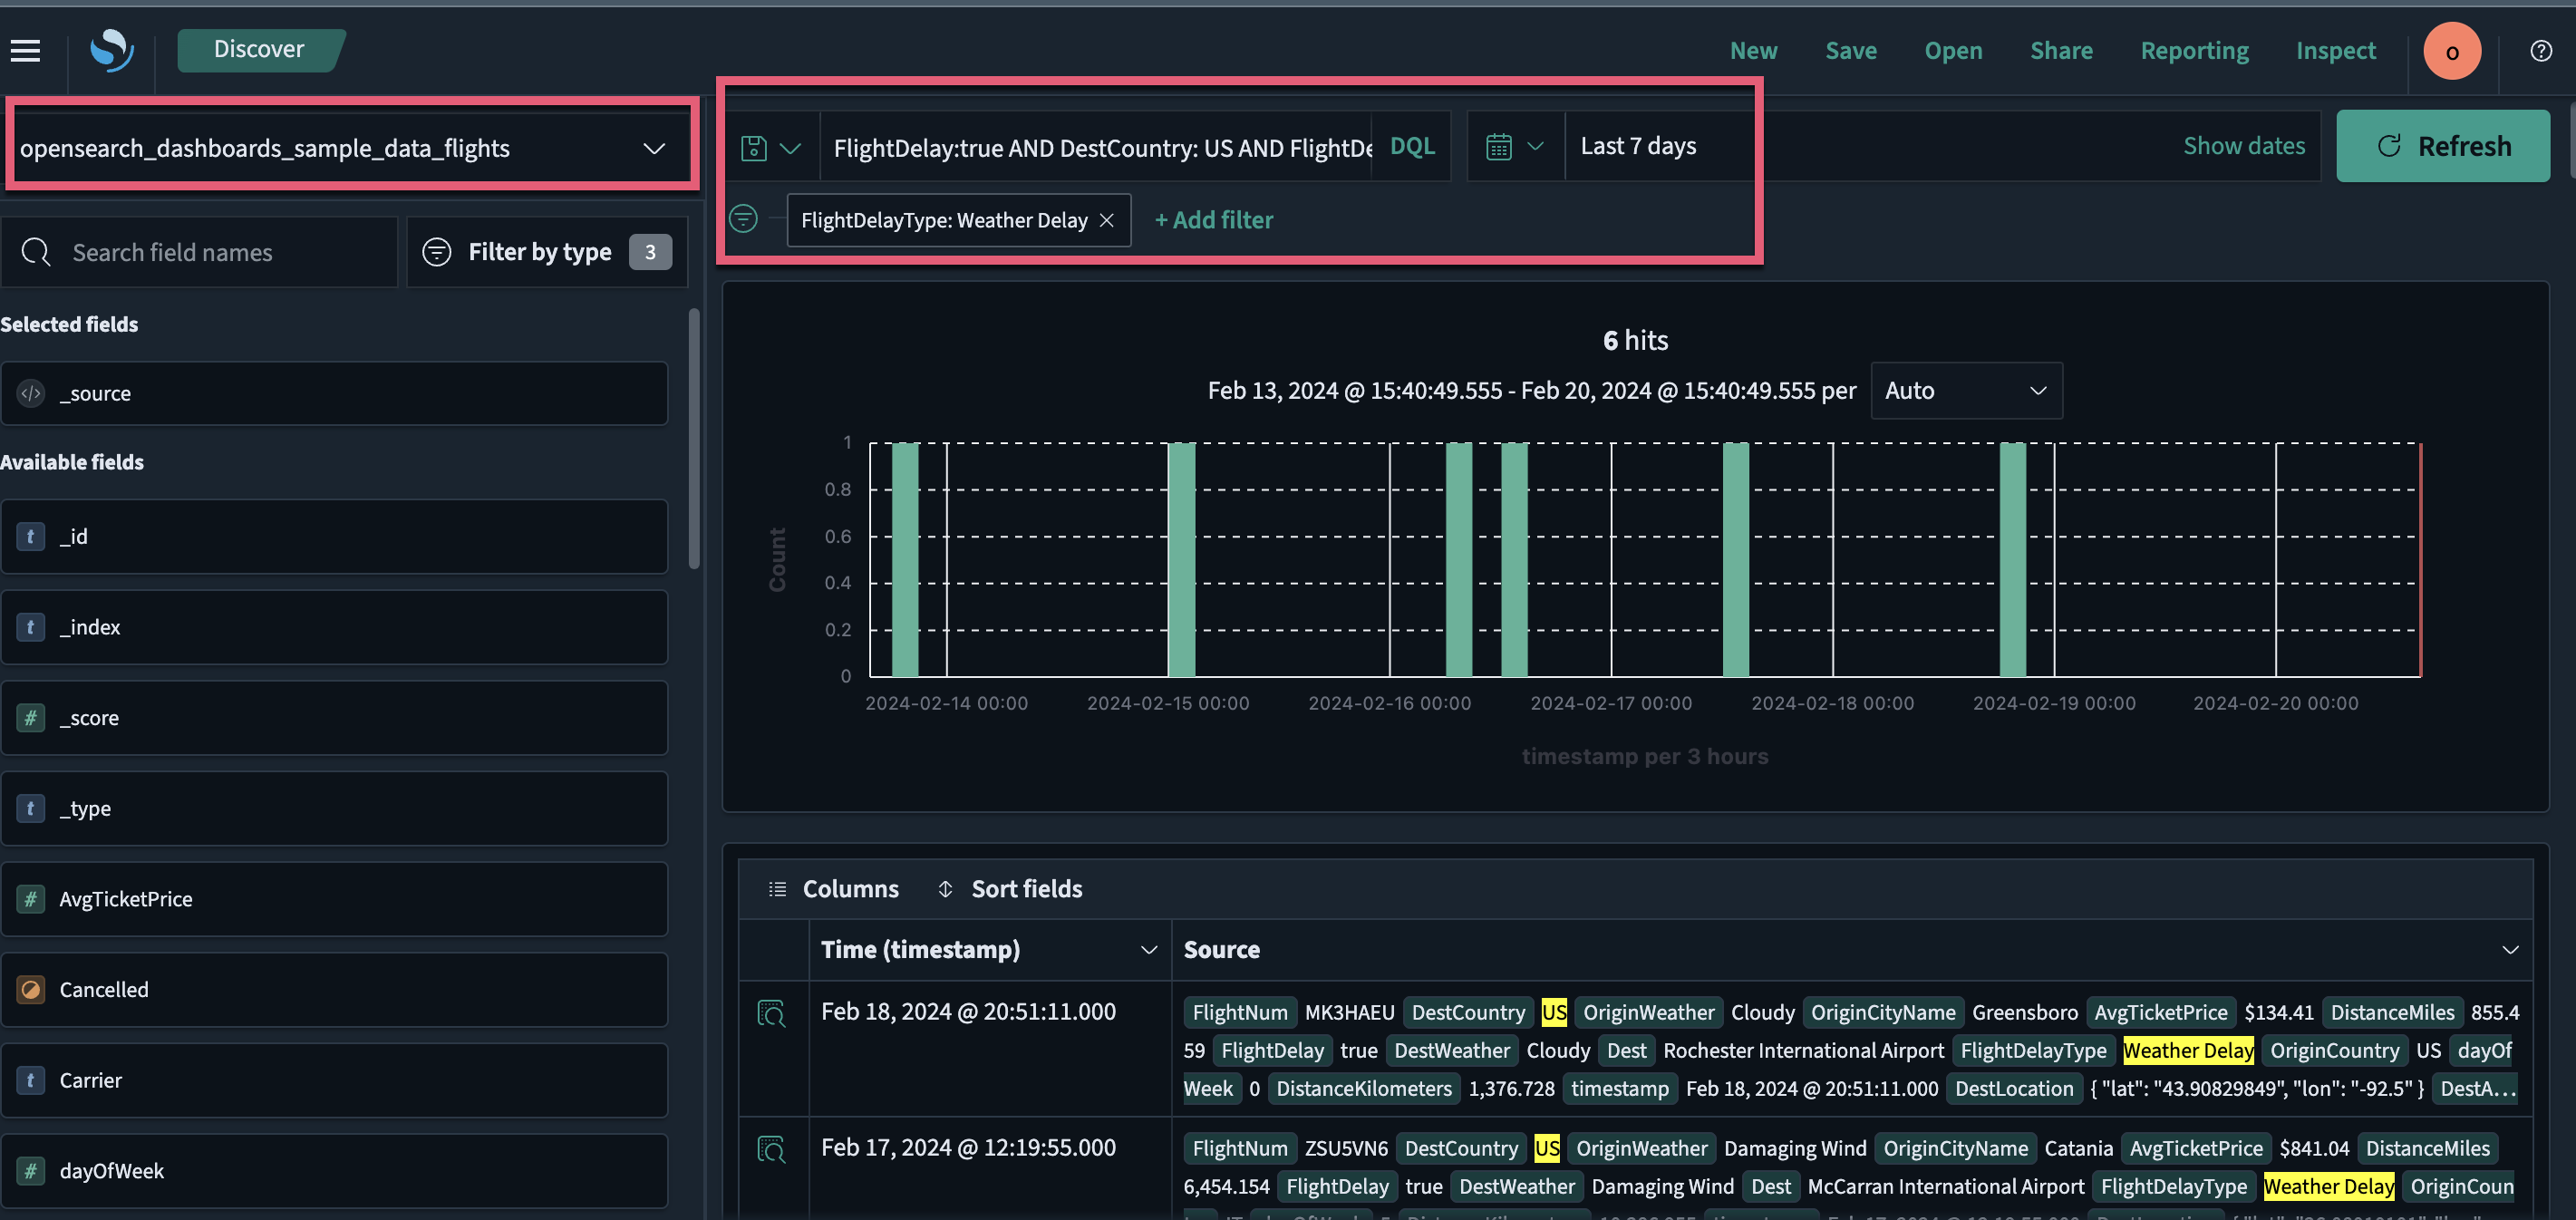
opensearch_dashboards_sample_data_flightsfrom the dropdown menu on the upper left. - Select the
 icon to change the time filter from the default of Last 15 minutes to Last 7 days.
 - In the DQL search bar, enter
FlightDelay:true AND DestCountry: US AND FlightDelayMin >= 60and select Update. Results are shown for US-bound flights delayed by 60 minutes or more. - Filter data by selecting Add filter from the DQL search bar and then selecting a Field, Operator, and Value from the dropdown lists in the Edit Filter pop-up window. For example, select
FlightDelayType, is, and Weather Delay.
The resulting view is shown in the following image.
Using the Dashboards application
With Dashboards, you can:
- Display data in a single view.
- Build dynamic dashboards.
- Create and share reports.
- Embed analytics to differentiate your applications.
The Dashboards application creates and stores visualizations generated from your data. Follow these steps to use the application:
- On the OpenSearch Dashboards Home page, choose Dashboards. A list of dashboards generated from the sample data appears.
- In the search toolbar, search for and select [Flights] Global Flight Dashboard. You’ll see a dashboard preloaded with visualizations, including charts, maps, and data tables.
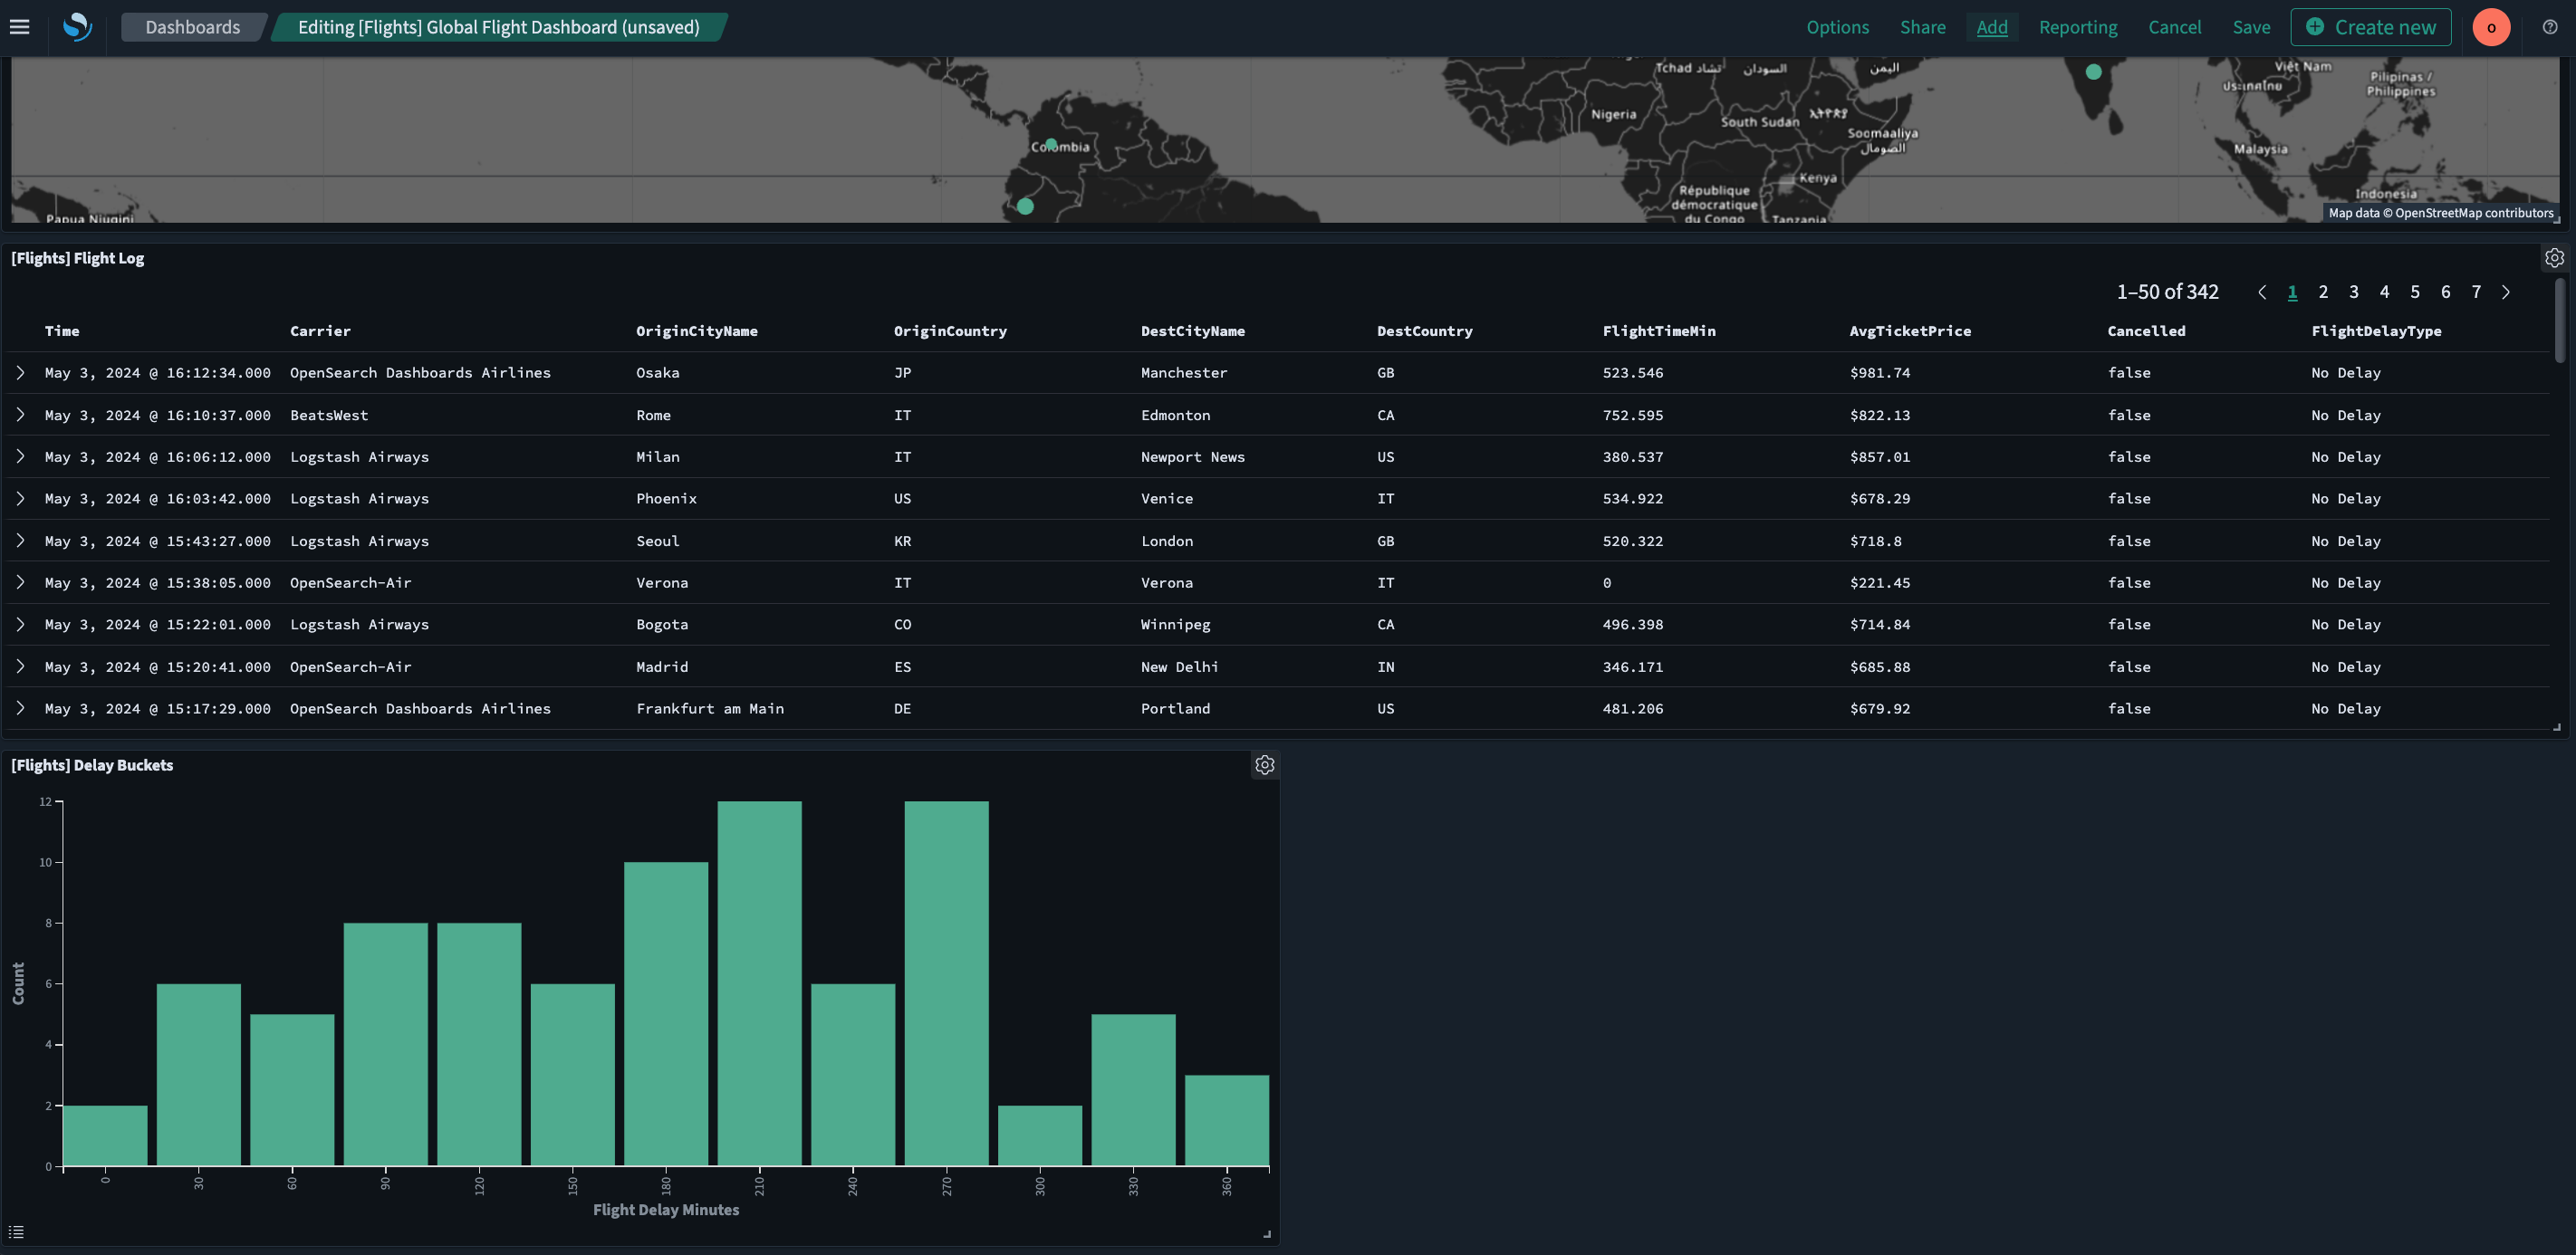
- To add other panels to the dashboard, select the Edit button and then choose Add from the toolbar. The Add panels window opens.
- In the search toolbar in the Add panels window, search for and select the existing panel [Flights] Delay Buckets. A pop-up message confirms that you’ve added the panel.
- Select close
xto exit the Add panels window. - The newly added panel is now displayed as the last panel on the dashboard.
The resulting view is shown in the following image.
For information about using a specific data visualization type, such as VisBuilder, go to Building data visualizations. For information about using dashboards and visualizations in Observability, go to Observability.
Interacting with data using dashboards
Interactive dashboards allow you to analyze data in more depth and filter it in several ways. With Dashboards, you can use dashboard-level filters to directly interact with data.
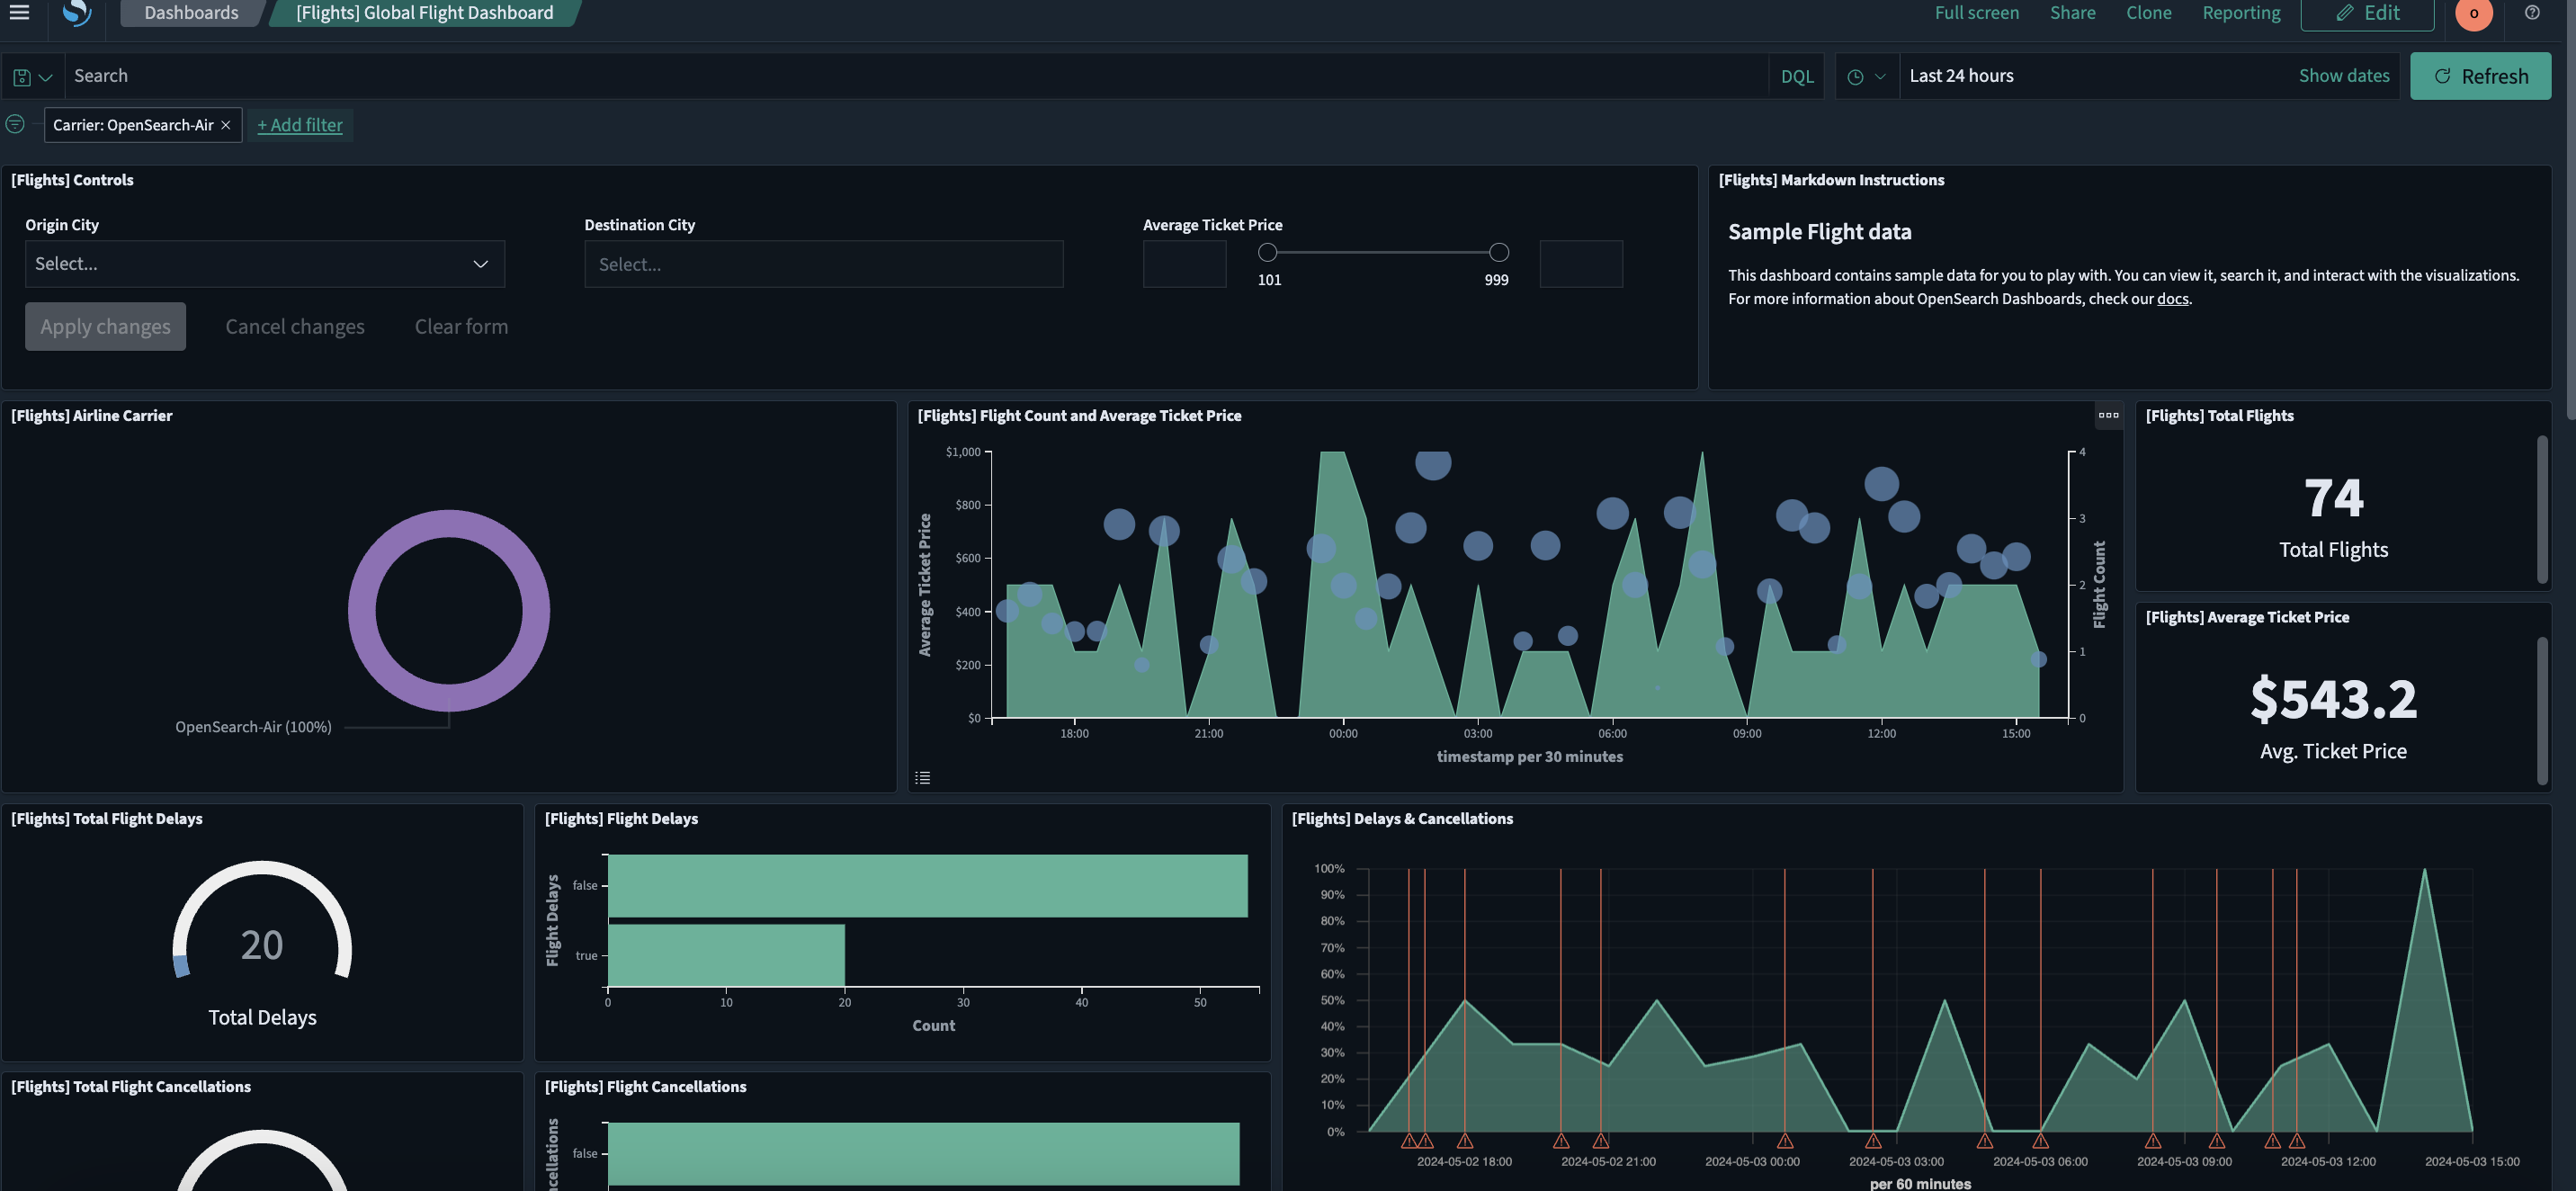
Using the [Flights] Global Flight Dashboard dashboard, follow these steps to further analyze and filter the sample flight data:
- On the [Flights] Airline Carrier panel, choose OpenSearch-Air. The dashboard updates automatically, adding the filter
Carrier: OpenSearch-Airon the upper-left filter bar. The following GIF illustrates this step. - Choose Save to save the dashboard.
Alternatively, you can use the dashboard toolbar to apply filters by following these steps:
- In the dashboard toolbar, choose Add filter.
- From the Field, Operator, and Value dropdown lists, choose Carrier, is, and OpenSearch-Air, respectively.
- Choose Save. The dashboard updates automatically.
The resulting view is shown in the following image.
Customizing the appearance theme
Introduced 2.14
Light mode is the default OpenSearch Dashboards appearance theme. You can customize the appearance theme to suit your preferences. The available options include light mode, dark mode, and your browser’s settings.
Enabling the appearance theme setting
The appearance theme setting is enabled or disabled through Advanced Settings and requires admin permissions.
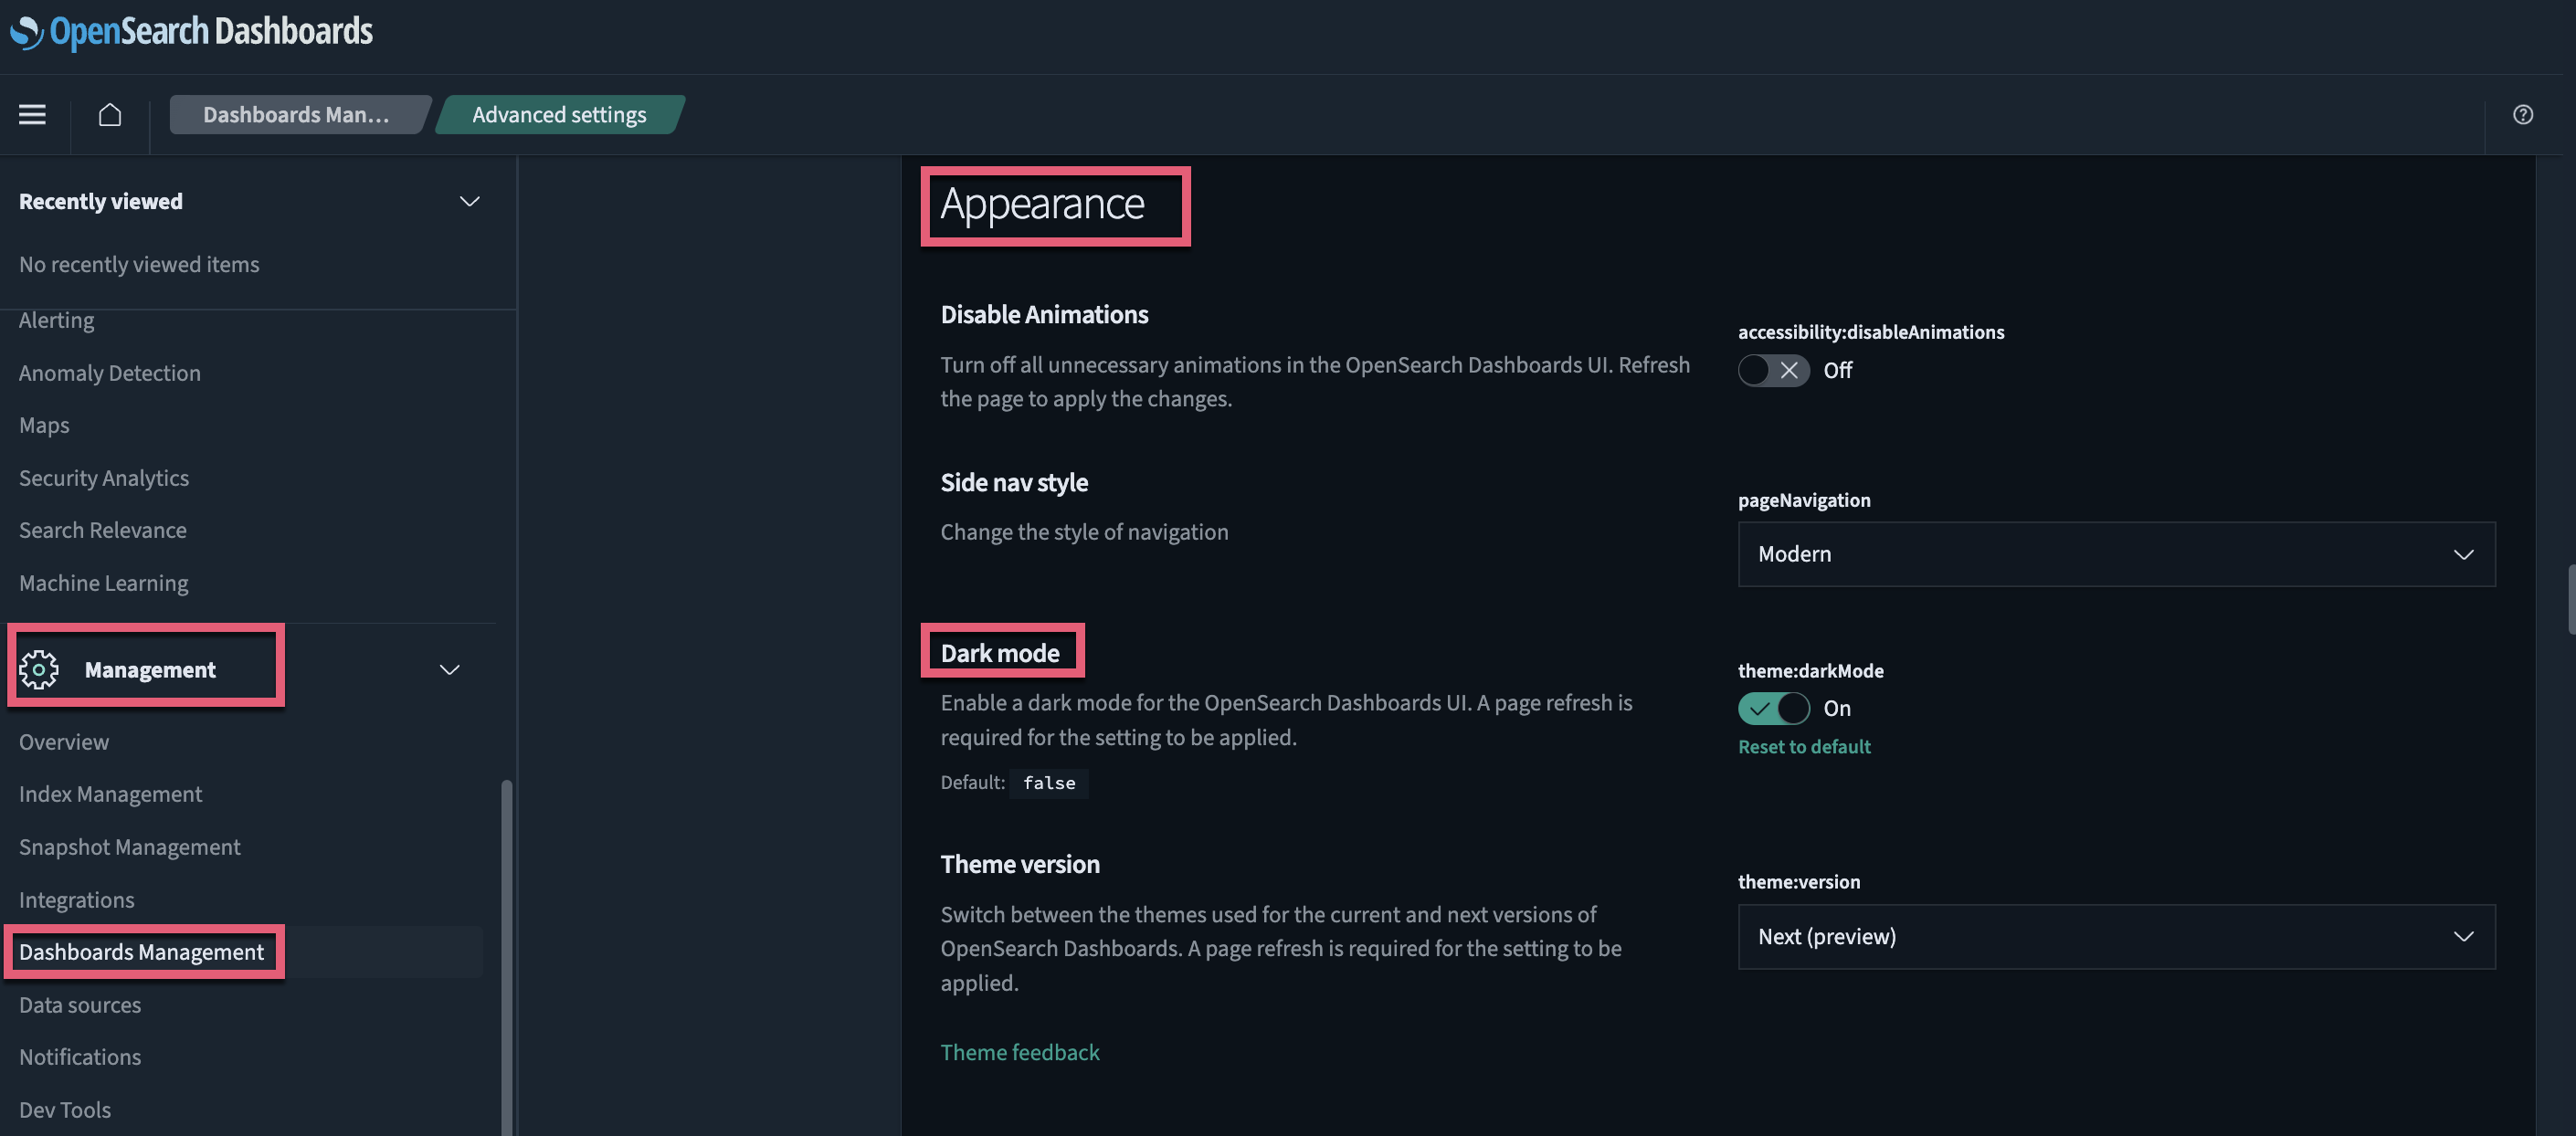
Changing the appearance theme settings
Admins can change the appearance theme for all users of their OpenSearch Dashboards instance through Advanced Settings:
- Navigate to Management > Dashboards Management > Advanced Settings.
- Scroll to the Appearance section and toggle
theme:darkModeon or off. - Select the Save changes button and then the Reload button. The updated theme is applied immediately.
Next steps
- Go to Building data visualizations to learn more about data visualizations.
- Go to Creating dashboards to learn more about creating dashboards.
- Go to Analyzing data to learn more about using Dashboards to analyze data.
- Go to Ingest APIs and Ingest pipelines to learn more about data ingestion using OpenSearch.