Composite monitors
Table of contents
About composite monitors
Basic monitor types for the Alerting plugin are designed to define a single trigger type. For example, a per document monitor can trigger an alert based on a query’s match with documents, while a per bucket monitor can trigger an alert based on queries aimed at aggregated values in a data source. The composite monitor combines multiple monitors in a sequence to analyze a data source based on multiple criteria and then uses their individual alerts to generate a single chained alert. This allows you to derive more granular information about a data source, and it doesn’t require you to manually coordinate the scheduling of the separate monitors.
Composite monitors remove the limitations of basic monitors in the following ways:
- Composite monitors give you the ability to create complex queries through a combination of triggers generated by multiple types of monitors.
- They have the capacity to define a pipeline of rules and queries that are run as a single execution.
- They deliver a single alert to users instead of multiple alerts from the individual monitors in their workflows.
- They provide a more complete view of a given data source by running multiple monitors and multiple types of monitors in sequence, creating more focused results and reducing noise in the results.
Key terms
The key terms in the following table describe the basic concepts of composite monitors. For additional terms common to all types of monitors, see Key terms in the Alerting section.
| Term | Definition |
|---|---|
| Composite monitor | A composite monitor is a type of monitor that supports the execution of multiple monitors in a sequential workflow. It supports configuring triggers to create chained alerts. |
| Delegate monitor | Delegate monitors are executed sequentially according to their order in a composite monitor’s definition. When a delegate monitor’s trigger conditions are met, it generates an audit alert. This audit alert then becomes a condition for the composite monitor’s trigger. The composite monitor supports per query, per bucket, and per document monitors as delegate monitors. |
| workflow ID | The workflow ID provides an identifier for the entire workflow of all delegate monitors. It is synonymous with a composite monitor’s monitor ID. |
| Chained alert | Chained alerts are generated from composite monitor triggers when delegate monitors generate audit alerts. The chained alert trigger condition supports the use of the logical operators AND, OR, and NOT so you can combine multiple functions into a single expression. |
| Audit alert | Delegate monitors generate alerts in an audit state. Users are not notified about each individual audit alert and don’t need to acknowledge them. Audit alerts are used to evaluate chained alert trigger conditions in composite monitors. |
| Execution | A single run of all delegate monitors in the sequence defined in the composite monitor’s configuration. |
Basic workflow
You create composite monitors by combining individual monitors in a workflow that executes each monitor in a defined sequence. When individual audit alerts from the delegate monitors meet the trigger conditions for a composite monitor, the composite monitor generates its own chained alert. Consider the following sequence of events to understand how a simple composite monitor configured with two delegate monitors executes its workflow. In this example, the trigger condition for the composite monitor is met when the first monitor and the second monitor both generate an alert.
- The composite monitor starts the execution and delegates it to the first monitor. The trigger conditions for the first monitor are met and it generates an audit alert.
- The composite monitor then delegates the execution to the second monitor. The second monitor’s trigger conditions are also met and it generates its own audit alert.
- Because the composite monitor’s trigger conditions require that the first and second monitors both generate audit alerts, the composite monitor then triggers a chained alert.
- If notifications are configured in the composite monitor’s definition, users receive a notification about the chained alert. They do not, however, receive the individual audit alerts generated by the two delegate monitors.
In this simple example, the first monitor could be a per document monitor configured to analyze a data source using three different queries, while the second monitor could be a per bucket monitor that aggregates data by client IP. By combining the requirements of each delegate monitor, the composite monitor focuses the criteria that decide whether an alert is generated or not. This can improve the meaningfulness of the alert while removing extraneous alerts that provide no deterministic value.
Managing composite monitors with the API
You can manage composite monitors using the OpenSearch REST API or OpenSearch Dashboards. This section describes API functionality for composite monitors.
Create composite monitor
This API allows you to create a composite monitor.
POST _plugins/_alerting/workflows
Request fields
| Field | Type | Description |
|---|---|---|
schedule | Object | The schedule that determines how often the execution runs. |
schedule.period.interval | Numeral | Accepts a numerical value to set how often the execution runs. |
schedule.period.unit | Object | The time unit of measure for the interval: SECONDS, MINUTES, HOURS, DAYS. |
inputs | Object | Accepts inputs to define the delegate monitors, which specify both the delegate monitors and their order in the execution’s sequence. |
inputs.composite_input.sequence.delegates | Object | The settings for the individual monitors that underlie the composite monitor. |
inputs.composite_input.sequence.delegates.order | Number | Designates the order in which the monitor runs in the execution. |
inputs.composite_input.sequence.delegates.monitor_id | String | The unique identifier for the monitor. |
enabled_time | Number | The time at which the monitor was enabled. Expressed in epoch time. |
enabled | Boolean | The setting that determines whether the composite monitor is enabled or not. Setting it to true enables the composite monitor. Default is true. |
workflow_type | String | Set to composite for composite monitor. |
triggers | Object | Details for the individual alert triggers. |
triggers.chained_alert_trigger | Object | Details for each individual alert trigger. Each monitor’s alert trigger will require settings for its configuration. |
triggers.chained_alert_trigger.id | String | The unique identifier for the alert trigger. |
triggers.chained_alert_trigger.name | String | The name of the alert trigger. |
triggers.chained_alert_trigger.severity | Number | The alert severity. 1 = highest; 2 = high; 3 = medium; 4 = low; 5 = lowest. |
triggers.chained_alert_trigger.condition.script | Object | The script details that determine the conditions for triggering an alert. |
triggers.chained_alert_trigger.condition.script.source | String | The Painless script that defines the conditions for triggering an alert. |
triggers.chained_alert_trigger.condition.script.lang | String | Enter painless for the Painless scripting language. |
actions | Object | Provides fields for configuring an alert notification. |
Example request
POST _plugins/_alerting/workflows
{
	"last_update_time": 1679468231835,
	"owner": "alerting",
	"type": "workflow",
	"schedule": {
		"period": {
			"interval": 1,
			"unit": "MINUTES"
		}
	},
	"inputs": [{
		"composite_input": {
			"sequence": {
				"delegates": [{
						"order": 1,
						"monitor_id": "grsbCIcBvEHfkjWFeCqb"
					},
					{
						"order": 2,
						"monitor_id": "agasbCIcBvEHfkjWFeCqa"
					}
				]
			}
		}
	}],
	"enabled_time": 1679468231835,
	"enabled": true,
	"workflow_type": "composite",
	"name": "scale_up",
	"triggers": [{
			"chained_alert_trigger": {
				"id": "m1ANDm2",
				"name": "jnkjn",
				"severity": "1",
				"condition": {
					"script": {
						"source": "(monitor[id=grsbCIcBvEHfkjWFeCqb] && monitor[id=agasbCIcBvEHfkjWFeCqa])",
						"lang": "painless"
					}
				}
			},
			"actions": [{
				"name": "test-action",
				"destination_id": "ld7912sBlQ5JUWWFThoW",
				"message_template": {
					"source": "This is my message body."
				},
				"throttle_enabled": true,
				"throttle": {
					"value": 27,
					"unit": "MINUTES"
				},
				"subject_template": {
					"source": "TheSubject"
				}
			}]
		},
		{
			"chained_alert_trigger": {
				"id": "m1ORm2",
				"name": "jnkjn",
				"severity": "1",
				"condition": {
					"script": {
						"source": "(monitor[id=grsbCIcBvEHfkjWFeCqb] || monitor[id=agasbCIcBvEHfkjWFeCqa])",
						"lang": "painless"
					}
				}
			}
		}
	]
}
Using Painless scripting language to define chained alert trigger conditions
Composite monitor configurations employ the Painless scripting language to define the conditions for generating chained alerts. Conditions are applied for each execution of the composite monitor. You define the alert trigger conditions in the triggers.chained_alert_triggers.condition.script.source field of the request. Using Painless syntax, you can apply logic to links between monitors with the basic Boolean operators AND, OR, NOT, and precedence:
- AND =
&& - OR =
|| - NOT =
! - Precedence =
()
See the following examples to understand how each is used in the monitor definition.
-
Example 1
monitor[id=1] && monitor[id=2]The following conditions for delegate monitors will trigger the composite monitor to produce a chained alert when both monitor #1 AND monitor #2 generate an alert.
-
Example 2
monitor[id=1] || !monitor[id=2]The following conditions will trigger the composite monitor to produce a chained alert when either monitor #1 generates an alert OR monitor #2 does NOT generate an alert.
-
Example 3
monitor[id=1] && (monitor[id=2] || monitor[id=3])The following conditions will trigger the composite monitor to produce a chained alert when monitor #1 generates an alert AND monitor #2 OR monitor #3 generates an alert.
The order of monitor IDs in the Painless script does not define the execution sequence for the monitors. The monitor execution sequence is defined in the inputs.composite_input.sequence.delegates.order field in the request.
Get Composite Monitor
This API retrieves information on the specified monitor.
GET _plugins/_alerting/workflows/<workflow_id>
Path parameters
| Field | Type | Description |
|---|---|---|
workflow_id | String | The composite monitor’s workflow ID. |
Update Composite Monitor
This API updates the composite monitor’s details. See Create Composite Monitor for descriptions of the request fields.
Example request
PUT _plugins/_alerting/workflows/<workflow_id>
{
    "owner": "security_analytics",
    "type": "workflow",
    "schedule": {
        "period": {
        "interval": 1,
        "unit": "MINUTES"
        }
    },
    "inputs": [
        {
            "composite_input": {
                "sequence": {
                    "delegates": [
                        {
                            "order": 1,
                            "monitor_id": "grsbCIcBvEHfkjWFeCqb"
                        },
                        {
                            "order": 2,
                            "monitor_id": "agasbCIcBvEHfkjWFeCqa"
                        }
                    ]
                }
            }
        }
    ],
    "enabled_time": 1679468231835,
    "enabled": true,
    "workflow_type": "composite",
    "name": "NTxdwApKbv"
}
Delete Composite Monitor
DELETE _plugins/_alerting/workflows/<workflow_id>
Execute Composite Monitor
This API begins the workflow execution for a composite monitor:
POST /_plugins/_alerting/workflows/<workflow_id>/_execute
Example response
{
    "execution_id": "I0GXeIgBYKBG2nHoiHCL_2023-06-01T20:18:48.511884_a9c1d055-9b70-49c2-b32a-716cff1f562e",
    "workflow_name": "scale_up",
    "workflow_id": "I0GXeIgBYKBG2nHoiHCL",
    "trigger_results": {
        "m1ANDm2": {
            "name": "jnkjn",
            "triggered": true,
            "action_results": {},
            "error": null
        },
        "m1ORm2": {
            "name": "jnkjn",
            "triggered": true,
            "action_results": {},
            "error": null
        }
    },
    "monitor_run_results": [{
            "monitor_name": "test triggers",
            "period_start": 1685650668501,
            "period_end": 1685650728501,
            "error": null,
            "input_results": {
                "results": [{
                    "bhjh": [
                        "OkGceIgBYKBG2nHoyHAn|test1",
                        "O0GceIgBYKBG2nHozHCW|test1"
                    ],
                    "nkjkj": [
                        "OkGceIgBYKBG2nHoyHAn|test1",
                        "O0GceIgBYKBG2nHozHCW|test1"
                    ],
                    "jknkjn": [
                        "OkGceIgBYKBG2nHoyHAn|test1",
                        "O0GceIgBYKBG2nHozHCW|test1"
                    ]
                }],
                "error": null
            },
            "trigger_results": {
                "NC3Dd4cBCDCIfBYtViLI": {
                    "name": "njkkj",
                    "triggeredDocs": [
                        "OkGceIgBYKBG2nHoyHAn|test1",
                        "O0GceIgBYKBG2nHozHCW|test1"
                    ],
                    "action_results": {},
                    "error": null
                }
            }
        },
        {
            "monitor_name": "test triggers 2",
            "period_start": 1685650668501,
            "period_end": 1685650728501,
            "error": null,
            "input_results": {
                "results": [{
                    "bhjh": [
                        "PEGceIgBYKBG2nHo1HCw|test",
                        "PUGceIgBYKBG2nHo3HA8|test"
                    ],
                    "nkjkj": [
                        "PEGceIgBYKBG2nHo1HCw|test",
                        "PUGceIgBYKBG2nHo3HA8|test"
                    ],
                    "jknkjn": [
                        "PEGceIgBYKBG2nHo1HCw|test",
                        "PUGceIgBYKBG2nHo3HA8|test"
                    ]
                }],
                "error": null
            },
            "trigger_results": {
                "NC3Dd4cBCDCIfBYtViLI": {
                    "name": "njkkj",
                    "triggeredDocs": [
                        "PEGceIgBYKBG2nHo1HCw|test",
                        "PUGceIgBYKBG2nHo3HA8|test"
                    ],
                    "action_results": {},
                    "error": null
                }
            }
        }
    ],
    "execution_start_time": "2023-06-01T20:18:48.511874Z",
    "execution_end_time": "2023-06-01T20:18:53.682405Z",
    "error": null
}
Get chained alerts
This API returns an array of chained alerts generated in composite monitor workflows:
GET /_plugins/_alerting/workflows/alerts?workflowIds=<workflow_ids>&getAssociatedAlerts=true
Query parameters
| Field | Type | Required | Description |
|---|---|---|---|
workflowIds | Array | No | When this parameter is used, it returns alerts created by the specified workflows. |
getAssociatedAlerts | Boolean | No | When true, the response returns audit alerts that the composite monitor used to create a chained alert. Default is false. |
Example response
{
    "alerts": [
        {
            "id": "PbQoZokBfd2ci_FqMGi6",
            "version": 1,
            "monitor_id": "",
            "workflow_id": "G7QoZokBfd2ci_FqD2iZ",
            "workflow_name": "scale_up",
            "associated_alert_ids": [
                "4e8256c5-529a-484c-bf7b-d3980c03e9a4",
                "513a8cb3-44bc-4eee-8aac-131be10b399e"
            ],
            "schema_version": -1,
            "monitor_version": -1,
            "monitor_name": "",
            "execution_id": "G7QoZokBfd2ci_FqD2iZ_2023-07-17T23:20:55.244970_edd977d2-c02b-4cbe-8a79-2aa7991c4191",
            "trigger_id": "m1ANDm2",
            "trigger_name": "jnkjn",
            "finding_ids": [],
            "related_doc_ids": [],
            "state": "ACTIVE",
            "error_message": null,
            "alert_history": [],
            "severity": "1",
            "action_execution_results": [],
            "start_time": 1689636057269,
            "last_notification_time": 1689636057270,
            "end_time": null,
            "acknowledged_time": null
        },
        {
            "id": "PrQoZokBfd2ci_FqMGj8",
            "version": 1,
            "monitor_id": "",
            "workflow_id": "G7QoZokBfd2ci_FqD2iZ",
            "workflow_name": "scale_up",
            "associated_alert_ids": [
                "4e8256c5-529a-484c-bf7b-d3980c03e9a4",
                "513a8cb3-44bc-4eee-8aac-131be10b399e"
            ],
            "schema_version": -1,
            "monitor_version": -1,
            "monitor_name": "",
            "execution_id": "G7QoZokBfd2ci_FqD2iZ_2023-07-17T23:20:55.244970_edd977d2-c02b-4cbe-8a79-2aa7991c4191",
            "trigger_id": "m1ORm2",
            "trigger_name": "jnkjn",
            "finding_ids": [],
            "related_doc_ids": [],
            "state": "ACTIVE",
            "error_message": null,
            "alert_history": [],
            "severity": "1",
            "action_execution_results": [],
            "start_time": 1689636057340,
            "last_notification_time": 1689636057340,
            "end_time": null,
            "acknowledged_time": null
        }
    ],
    "associatedAlerts": [
        {
            "id": "4e8256c5-529a-484c-bf7b-d3980c03e9a4",
            "version": -1,
            "monitor_id": "DrQoZokBfd2ci_FqCWh8",
            "workflow_id": "G7QoZokBfd2ci_FqD2iZ",
            "workflow_name": "",
            "associated_alert_ids": [],
            "schema_version": 5,
            "monitor_version": 1,
            "monitor_name": "test triggers",
            "execution_id": "G7QoZokBfd2ci_FqD2iZ_2023-07-17T23:20:55.244970_edd977d2-c02b-4cbe-8a79-2aa7991c4191",
            "trigger_id": "NC3Dd4cBCDCIfBYtViLI",
            "trigger_name": "njkkj",
            "finding_ids": [
                "277afca7-d5aa-46ed-8023-5449ece65d36"
            ],
            "related_doc_ids": [
                "H7QoZokBfd2ci_FqFmii|test1"
            ],
            "state": "AUDIT",
            "error_message": null,
            "alert_history": [],
            "severity": "1",
            "action_execution_results": [],
            "start_time": 1689636056410,
            "last_notification_time": 1689636056410,
            "end_time": null,
            "acknowledged_time": null
        },
        {
            "id": "513a8cb3-44bc-4eee-8aac-131be10b399e",
            "version": -1,
            "monitor_id": "EbQoZokBfd2ci_FqCmiR",
            "workflow_id": "G7QoZokBfd2ci_FqD2iZ",
            "workflow_name": "",
            "associated_alert_ids": [],
            "schema_version": 5,
            "monitor_version": 1,
            "monitor_name": "test triggers 2",
            "execution_id": "G7QoZokBfd2ci_FqD2iZ_2023-07-17T23:20:55.244970_edd977d2-c02b-4cbe-8a79-2aa7991c4191",
            "trigger_id": "NC3Dd4cBCDCIfBYtViLI",
            "trigger_name": "njkkj",
            "finding_ids": [
                "6d185585-a077-4dde-8e43-b4c01b9f3102"
            ],
            "related_doc_ids": [
                "ILQoZokBfd2ci_FqGmhb|test"
            ],
            "state": "AUDIT",
            "error_message": null,
            "alert_history": [],
            "severity": "1",
            "action_execution_results": [],
            "start_time": 1689636056943,
            "last_notification_time": 1689636056943,
            "end_time": null,
            "acknowledged_time": null
        }
    ],
    "totalAlerts": 2
}
Request fields
| Field | Type | Description |
|---|---|---|
alerts | Array | A list of chained alerts generated by the composite monitor. |
associatedAlerts | Array | A list of audit alerts generated by the delegate monitors. |
Acknowledge chained alerts
After getting your alerts, you can acknowledge multiple active alerts in one call. If the alert is already in an ERROR, COMPLETED, or ACKNOWLEDGED state, it appears in the failed array.
POST _plugins/_alerting/workflows/<workflow_id>/_acknowledge/alerts
{
    "alerts": ["eQURa3gBKo1jAh6qUo49"]
}
Request fields
| Field | Type | Description |
|---|---|---|
alerts | Array | A list of alerts by ID. The results include alerts that are acknowledged by the system as well as alerts not recognized by the system. |
Example response
{
    "success": [
    "eQURa3gBKo1jAh6qUo49"
    ],
    "failed": []
}
Creating composite monitors in OpenSearch Dashboards
Begin by navigating to the Create monitor page in OpenSearch Dashboards: Alerting > Monitors and select Create monitor. Give the monitor a name and then select Composite monitor as the monitor type. Steps for creating a composite monitor workflow and trigger conditions vary depending on whether you use the Visual editor or the Extraction query editor. The first provides basic UI selectors for defining the composite monitor, while the second allows you to build the workflow and trigger conditions using a script. After deciding which method to use, refer to the corresponding section.
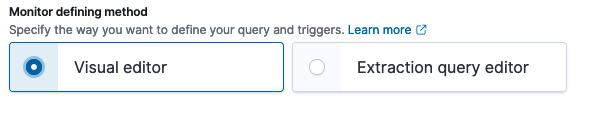
Visual editor
To use the visual editor for defining a workflow and trigger conditions, select the Visual editor radio button in the Monitor defining method section. This is shown in the following image.
To finish creating a composite monitor in the visual editor, follow these steps:
- In the Frequency dropdown list, select either By interval, Daily, Weekly, Monthly, or Custom cron expression:
- By interval — Allows you to run the schedule repeatedly based on the number of minutes, hours, or days you specify.
- Daily — Specify a time of day and a time zone.
- Weekly — Specify a day of the week, a time of day, and a time zone.
- Monthly — Specify a day of the month, a time of day, and a time zone.
- Custom cron expression — Create a custom cron expression for the schedule. Use the cron expressions link for help with creating these expressions, or see the Cron expression reference.
-
In the Delegate monitors section, enter the individual monitors you want to include in the workflow by selecting them in the dropdown lists. In the Visual editor, the order in which you select the monitors determines their order in the workflow.
Select Add another monitor to add another dropdown list. A minimum of two delegate monitors are required, and a maximum of 10 are allowed in total. Keep in mind that composite monitors support per query, per bucket, and per document monitors as delegate monitors.
Beside each dropdown list, you can select the view monitor icon (
 ) to open the monitor’s details window and review information about it.
 - Define a trigger or triggers for the composite monitor. In the Triggers section, select Add trigger. Add a trigger name, then define the trigger conditions.
- Use the Select delegate monitor label to open the pop-up window shown in the following image.
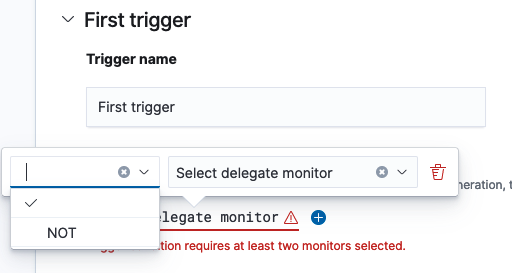
- Use the Select delegate monitor dropdown list to select a delegate monitor from those defined in the previous step. For the first delegate monitor, you can select NOT as the operator if you prefer. After the monitor is populated in the field, you can use the trash can icon (
 ) to the right of the list to remove the monitor if needed.
 - Select the plus sign (
 ) to the right of the first monitor to select a second delegate monitor. After selecting a second monitor, select one of the operators
 AND,OR,AND NOT, orOR NOTto apply the condition between the two monitors. After the operator is applied, you can select the operator to open the pop-up window again and change the selection. - Select the severity level for the alert. The options include 1 (Highest), 2 (High), 3 (Medium), 4 (Low), and 5 (Lowest).
-
In the Notifications section, select a notification channel from the dropdown list. If no channels exist, select the Manage channels label to the right of the dropdown list to set up a notification channel. For more information about notifications, see the Notifications documentation. You can also select Add notification to specify additional notifications for the alert trigger.
Notifications are optional for all monitor types.
- To define an additional trigger, select Add another trigger. You can have a maximum of of 10 triggers in total. Select Remove trigger to the right of the screen to remove a trigger.
- After completing the monitor workflow and defining triggers, select Create in the lower-right corner of the screen. The composite monitor is created, and the monitor’s details window opens.
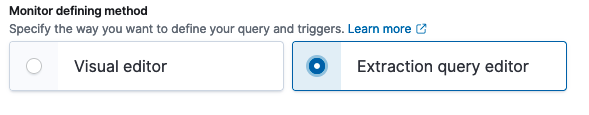
Extraction query editor
To use the extraction query editor for defining a workflow and triggers, select the Extraction query editor radio button in the Monitor defining method section. This is shown in the following image.
The extraction query editor follows the same general steps as the visual editor, but it allows you to build the composite monitor workflow and alert triggers using extractions from the API query. This provides you with the ability to create more advanced configurations not supported by the visual editor. The following sections provide examples of content for each of these two fields. All other steps for composite monitor creation are the same as in those for the visual editor.
-
Define workflow
In the Define workflow field, enter a sequence that defines the delegate monitors and their order in the workflow. The following example shows the delegate monitors that are included in the workflow, along with their order in the sequence:
{
    "sequence": {
        "delegates": [
            {
                "order": 1,
                "monitor_id": "0TgBZokB2ZtsLaRvXz70"
            },
            {
                "order": 2,
                "monitor_id": "8jgBZokB2ZtsLaRv6z4N"
            }
        ]
    }
}
All delegate monitors included in the workflow require a
monitor_idand a value fororder. -
Trigger condition
In the Trigger condition field, enter the monitors and the operators that will be used to define the conditions between them. This field requires that trigger conditions be formatted in Painless scripting language. To see how these scripts are formed for trigger conditions, see Using Painless scripting to define chained alert trigger conditions.
The following example shows a trigger condition requiring the first monitor OR the second monitor to generate an audit alert before the composite monitor can generate a chained alert:
(monitor[id=8d36S4kB0DWOHH7wpkET] || monitor[id=4t36S4kB0DWOHH7wL0Hk])
Viewing monitor details
After a composite monitor is created, it appears in the list of monitors on the Monitors tab. The Type column indicates the type of monitor, including the composite monitor type. The Associations with composite monitors column provides a count of how many composite monitors a basic monitor is used in as a delegate monitor. Select a monitor in the Monitor name column to open its details window.
For composite monitors, The Alerts section of the details window includes the Actions column, which includes the view details icon (![]() ). The following image shows the Actions column as the last column to the right.
). The following image shows the Actions column as the last column to the right.
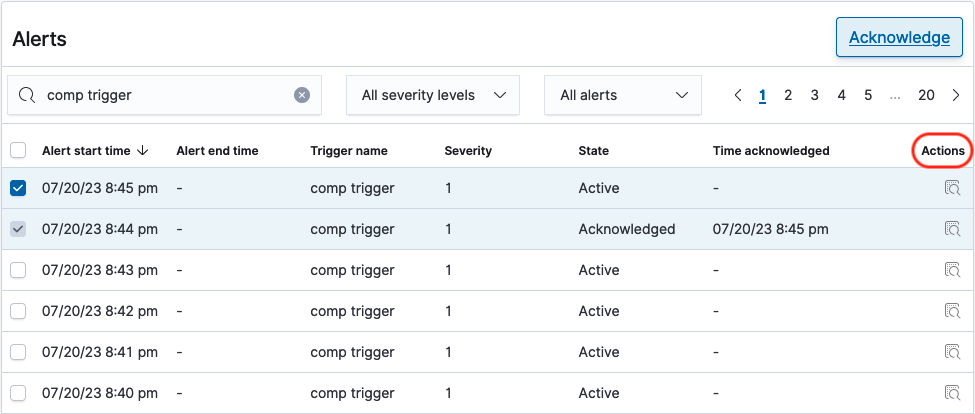
Select this icon to open the Alert details window. This window shows you all of the audit alerts that were part of the execution that generated the chained alert and includes the delegate monitor that generated the audit alert. Select the X in the upper-right corner of the window to close Alert details.
After returning to the Alerts section of the monitor’s details window, you can select the check box to the left of the Alert start time to highlight the alert. After the alert is highlighted, you can select Acknowledge in the upper-right portion of this section. The alert is acknowledged and the status in the State column changes from Active to Acknowledged.