Using maps
With OpenSearch Dashboards, you can create maps to visualize your geographical data. OpenSearch lets you construct map visualizations with multiple layers, combining data across different indexes. You can build each layer from a different index pattern. Additionally, you can configure maps to show specific data at different zoom levels. OpenSearch maps are powered by the OpenSearch maps service, which uses vector tiles to render maps.
Creating a new map
You can create a new map from the Maps or Visualize workflows by performing the following steps:
-
To create a new map from the Maps workflow, perform the following steps:
- On the top menu bar, go to OpenSearch Plugins > Maps.
- Choose the Create map button.
-
To create a new map from the Visualize workflow, perform the following steps:
- On the top menu bar, go to OpenSearch Dashboards > Visualize.
- Choose the Create visualization button.
- In the New Visualization dialog, choose Maps.
You can now see the default OpenSearch basemap.
To examine the Default map layer configuration, in the Layers panel on the upper left of the map, select Default map, as shown in the following image.
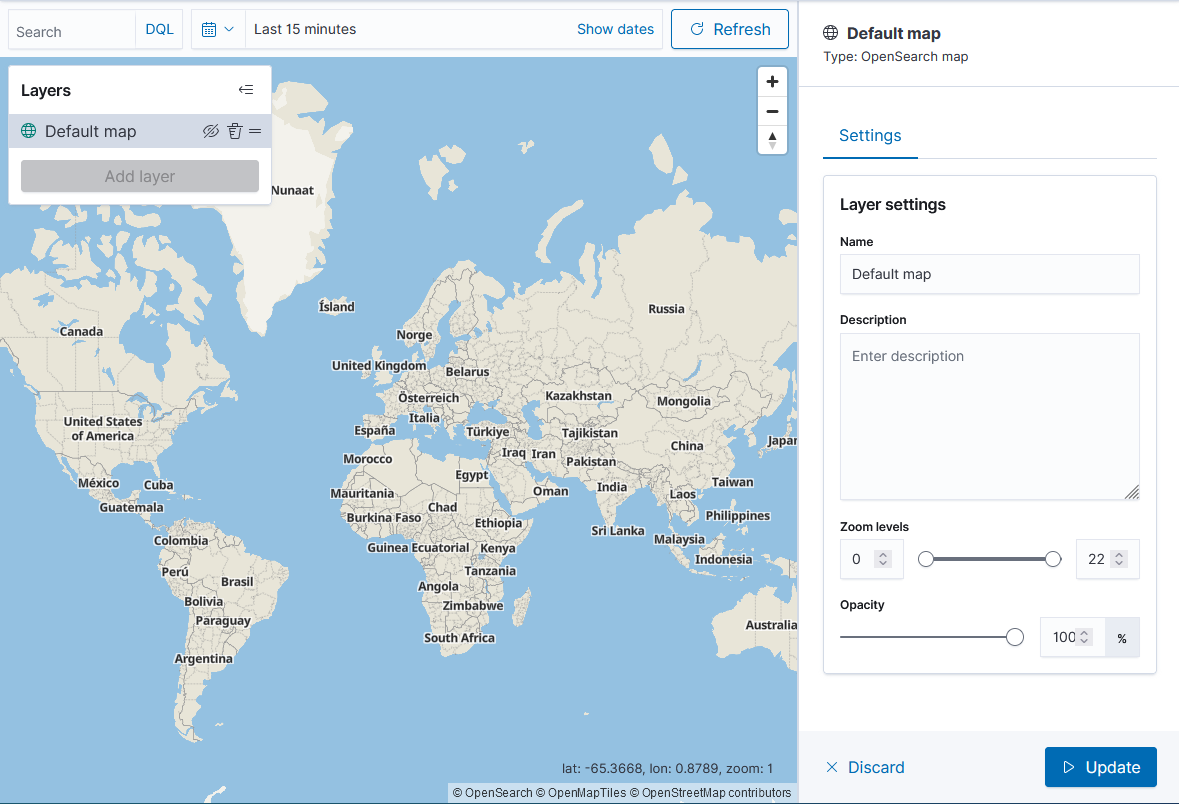
To hide the Layers panel, select the collapse (arrow) icon in the panel’s upper-right corner.
Layer settings
To change the default map settings, select Default map in the Layers panel. Under Layer settings, you can change the layer name and description and configure zoom levels and opacity for your layer:
-
Zoom levels: By default, a layer is visible at all zoom levels. If you want to make a layer visible only for a certain range of zoom levels, you can specify the zoom levels either by entering them in the text boxes or by sliding the range slider to the desired values.
-
Opacity: If your map contains multiple layers, one layer can obscure another one. In this case, you may want to reduce the opacity of the top layer so you can see both layers at the same time.
Adding layers
To add a layer to the map, in the Layers panel, select the Add layer button. The Add layer dialog is shown in the following image.
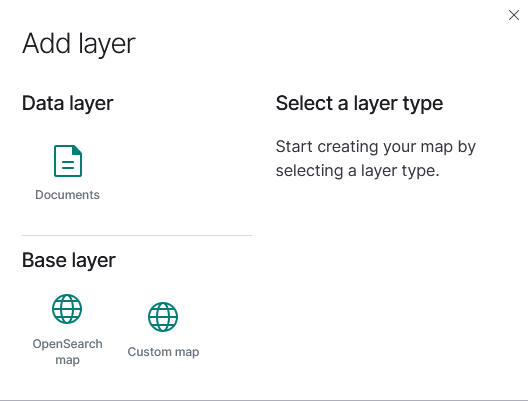
You can add base layers or data layers to the map:
-
A base layer serves as a basemap. To use your own or a third-party map as a base layer, add it as a Custom map.
-
Data layers let you visualize data from various data sources.
Adding a custom map
OpenSearch supports Web Map Service (WMS) or Tile Map Service (TMS) custom maps. To add a TMS custom map, perform the following steps:
- In the Layers panel, select the Add layer button.
-
From the Add layer dialog, select Base layer > Custom map. Follow the next steps in the New layer dialog, which is shown in the following image.
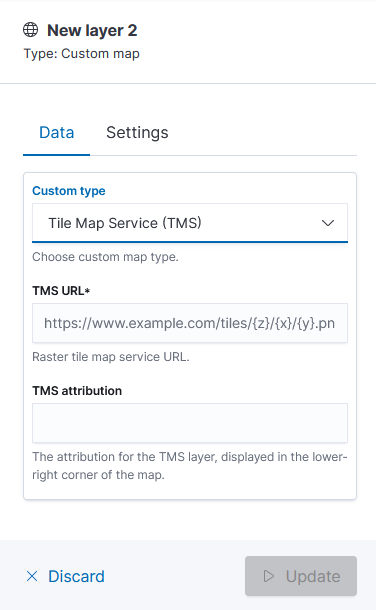
- In the Custom type dropdown list, select Tile Map Service (TMS).
- Enter the TMS URL.
- (Optional) In TMS attribution, enter a TMS attribution for the basemap. For example, if you’re using a custom basemap, enter the custom map name. This name will be displayed in the lower-right corner of the map.
- Select the Settings tab to edit the layer settings.
- Enter the layer name in Name.
- (Optional) Enter the layer description in Description.
- (Optional) Select the zoom levels and opacity for this layer.
- Select the Update button.
Adding a document layer
Adding document layers lets you visualize your data. You can add one index pattern per document layer. To view multiple index patterns, create multiple layers.
Document layers can display geopoint and geoshape document fields.
The following example assumes that you have the opensearch_dashboards_sample_data_flights dataset installed. If you don’t have this dataset installed, perform the following steps:
- On the top left, select the home icon.
- Select Add sample data.
- In the Sample flight data panel, select the Add data button.
Add a document layer as follows:
- In the Layers panel, select the Add layer button.
- From the Add layer dialog, select Data layer > Documents.
- In Data source, select
opensearch_dashboards_sample_data_flights. Alternatively, you can enter another index pattern to visualize. - In Geospatial field, select a geospatial field (geopoint or geoshape) to be displayed in the visualization. In this example, select
DestLocation. - (Optional) Select the Style tab to change the fill color, border color, border thickness, or marker size.
- Select the Settings tab to edit layer settings.
- Enter
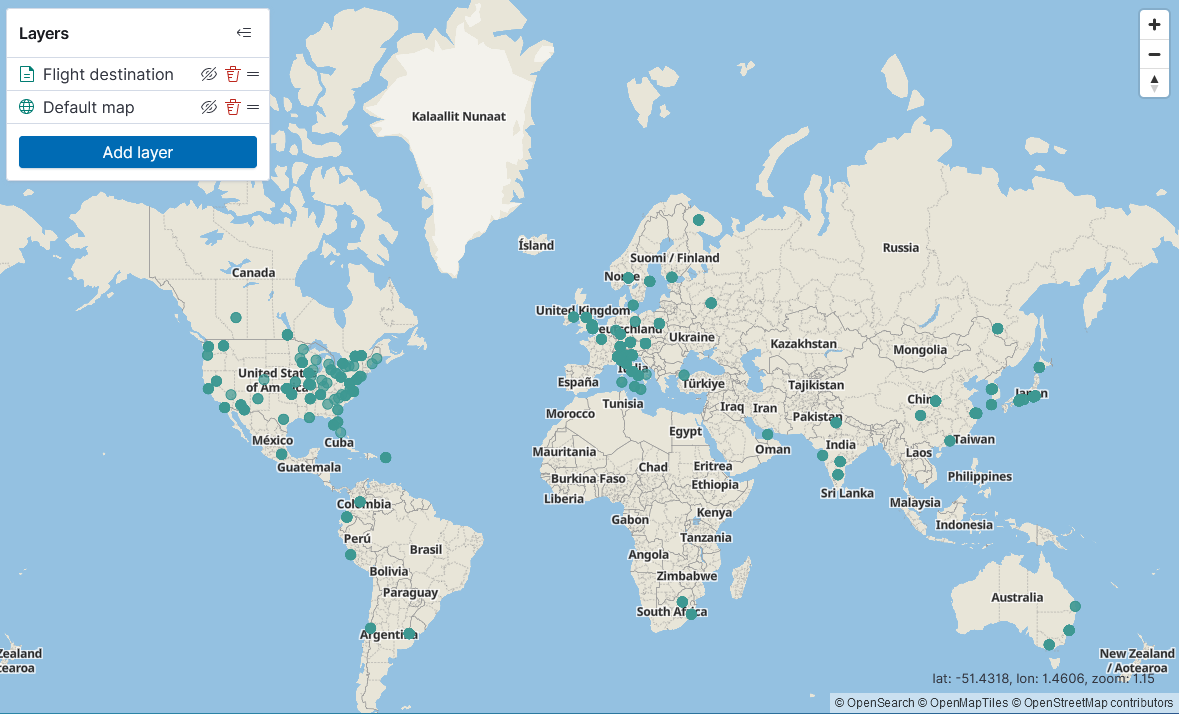
Flight destinationin Name. - Select the Update button.
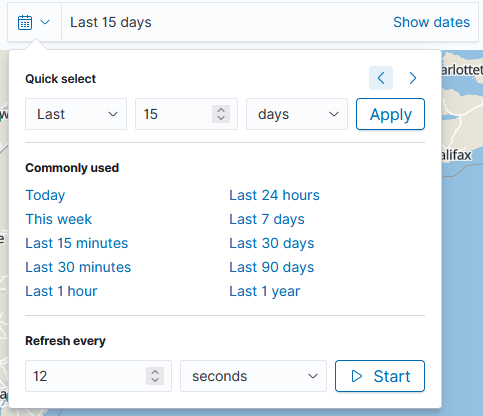
- To see more data, in the upper-right corner select the calendar icon dropdown list, then under Quick select, choose Last 15 days and select the Apply button.
You should see the flight destination data, as in the following image.
Filtering data
To show a subset of the data in the index, filter the data. You can either filter data at the layer level or draw shapes on the map to filter all layer data globally.
Filtering data at the layer level
To filter data at the layer level, select the layer and add a filter to it.
The following example shows how to filter the flight destination data to display only United States destinations:
- In the Layers panel, select Flight destination.
- Select Filters.
- Select Add filter.
- In Edit filter, select DestCountry in Field.
- In Operator, select is.
- In Value, select US.
- Select the Save button.
- Select the Update button.
For large datasets, you may want to avoid loading data for the full map. To load data only for a specific geographic area, select Only request data around map extent.
Drawing shapes to filter data
You can filter your data globally by drawing shapes on the map. To draw a rectangle or polygon on the map, perform the following steps:
- Select the Rectangle or Polygon icon on the right side of the map.
- In the Filter label field, enter a name for the filter.
- Choose a spatial relation type. By default, Intersects is selected. See Spatial relations for more information about spatial relationship types.
- Select the Draw Rectangle or Draw Polygon button.
- Draw the shape over the map area that you want to select:
- For a rectangle, select any starting point on the map (this point becomes a rectangle vertex). Then hover (do not drag) to another point on the map and select it (this point becomes the opposite vertex).
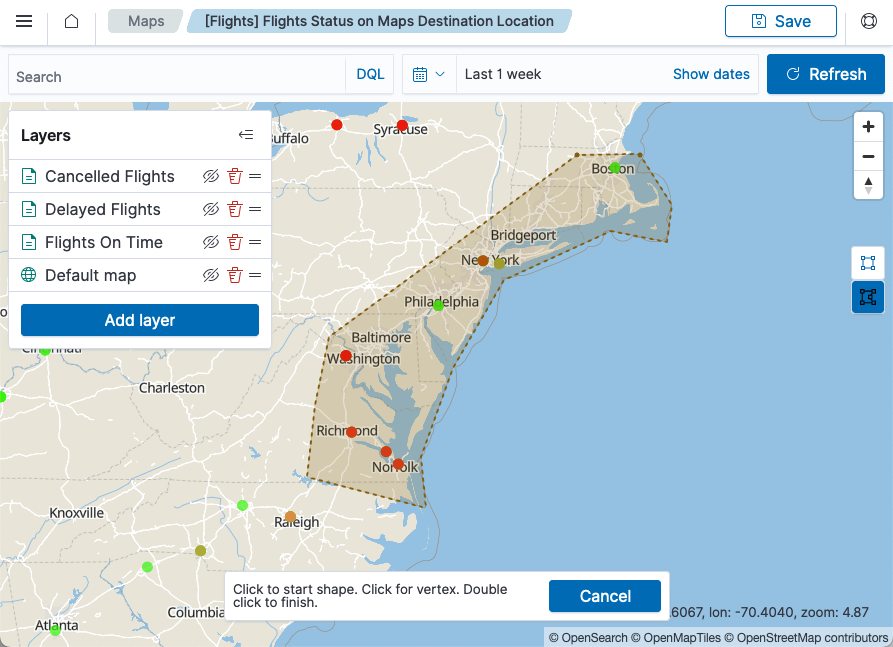
- For a polygon, select any starting point on the map (this point becomes a polygon vertex) and hover (do not drag) to each subsequent vertex and select that point. Finally, make sure to select the starting point again to close the polygon, as shown in the following image.
Disabling the shape filter for a map layer
By default, the shape filter is applied globally to all layers on the map. If you want to disable your shape filter for a map layer, perform the following steps:
- Select the layer from the Layers panel.
- In the Filters section, deselect Apply global filters.
- Select the Update button.
Modifying an existing shape filter
To modify an existing shape filter, select your filter on the top left above the map. You can perform the following operations on an existing filter:
- Edit filter: Change the filter name or modify the shape’s coordinates.
- Exclude results: Negate the filter, that is, show all data points except those to which the filter applies.
- Temporarily disable: Disable the filter until you select Re-enable.
- Delete: Remove your filter completely.
Using tooltips to visualize additional data
Document layers show geopoint and geoshape document fields as locations on the map. To add more information to the locations, you can use tooltips. For example, you may want to show flight delay, destination weather, and destination country information in the Flight destination layer. Perform the following steps to configure tooltips to show additional data:
- In the Layers panel, select Flight destination.
- Select Tooltips.
- Select the Show tooltips checkbox.
- In the Tooltip fields dropdown list, select the fields that you’d like to display. In this example, select
FlightDelay,DestWeather, andDestCountry. - Select the Update button.
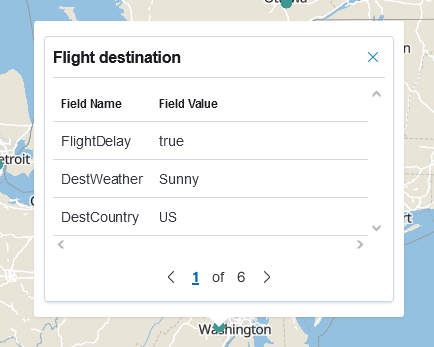
To view tooltips, hover over the geographical point you’re interested in. One tooltip can display many data points. For example, in the Flight destination layer there are multiple flights for a single destination city. To paginate over the flights, select the city you’re interested in and use the arrows in the tooltip, as shown in the following image.
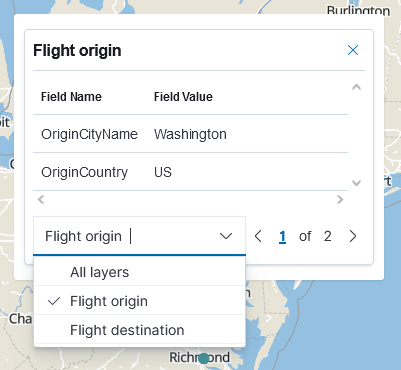
If a point on the map contains data from multiple layers, one tooltip can display data from multiple layers. To see all layers, select All layers. To choose a particular layer, select the layer name in the tooltip layer selection panel, as shown in the following image.
Adding labels to layers
Adding a label to a layer lets you visualize additional data on the map. For example, you may want to see the origin weather in the Flight destination layer. Perform the following steps to add a label to the Flight destination layer:
- In the Layers panel, select Flight destination.
- In the Style tab, select the Add label checkbox.
- You can choose to add a label based on fixed text to all data points in the layer or to use a field value as the label text.
- To add a fixed-text label, under Label text, select Fixed and enter your desired label text.
- To add a label based on a field value, under Label text, select Field value and select the field name. In this example, select
OriginWeather.
- (Optional) Change the label size, color, border color, or border width.
- Select the Update button.
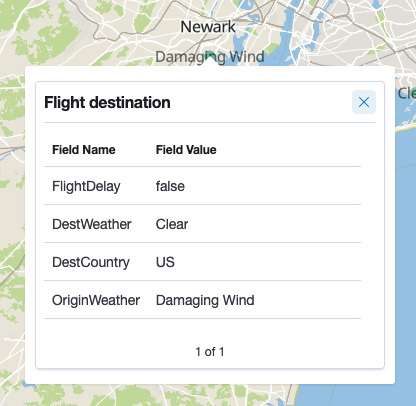
The label with the origin weather is visible on the map and also added to the tooltips, as shown in the following image.
Reordering, hiding, and deleting layers
The Layers panel lets you reorder, hide, and delete layers:
-
Layers on a map are stacked on top of each other. To reorder layers, use the handlebar (two horizontal lines) icon next to the layer name to drag the layer to the desired position.
-
If you’d like to hide a layer, select the show/hide (eye) icon next to the layer name. Toggle the show/hide icon to show the layer again.
-
To delete a layer, select the delete (trash can) icon next to the layer name.
Refreshing data for a real-time dataset
If you want to visualize a real-time dataset, after adding layers to the map, perform the following steps to set the refresh interval:
- Select the calendar icon in the upper-right corner.
- Under Refresh every, select or enter the refresh interval (for example, 1 second).
- Select the Start button.
Saving a map
To save a map with all the layers that you set up, perform the following steps:
- Select the Save button in the upper-right corner.
- In the Save map dialog, enter the map name in the Title text box.
- (Optional) In the Description text box, enter the map description.
- Select the Save button.
To open your saved map, choose Maps in the upper-left corner. The list of saved maps is displayed.
Adding a map to a dashboard
You can add a new or existing map to a new or existing dashboard by performing the following steps:
-
To add a map to a new dashboard, first create the dashboard as follows:
- On the top menu bar, go to OpenSearch Dashboards > Dashboard.
- Choose the Create dashboard button.
- Choose the Create new button.
-
To add a map to an existing dashboard, first open the dashboard as follows:
- On the top menu bar, go to OpenSearch Dashboards > Dashboard.
- Select the dashboard you want to open from the list.
- In the upper-right corner, choose Edit.
Once you’ve opened a dashboard, you can add a new or existing map to it.
Adding an existing map
- From the top menu, choose Add.
- In the Types dropdown list, select Maps.
- Select the map you want to add from the list.
Adding a new map
- From the top menu, choose the Create new button.
- In the New Visualization dialog, choose Maps.
- Edit the default map by adding a basemap, layers, or tooltips.
- In the upper-right corner, choose the Save button.
- In the Save map dialog, enter the Title and optional Description of the map.
- Select Add to Dashboard after saving (this option is selected by default).
- Choose the Save and return button.
Editing a map from a dashboard
- In the dashboard, choose the gear icon in the upper-right corner of the map you want to edit.
- Choose Edit maps.
- Edit the map.
- In the upper-right corner, choose the Save button.
- In the Save map dialog, choose the Save and return button.