Per cluster metrics monitors
Per cluster metrics monitors are a type of alert monitor that collects and analyzes metrics from a single cluster, providing insights into the cluster’s performance and health. You can set alerts to monitor certain conditions, such as when:
- Cluster health reaches yellow or red status.
- Cluster-level metrics—for example, CPU usage and JVM memory usage—reach specified thresholds.
- Node-level metrics—for example, available disk space, JVM memory usage, and CPU usage—reach specified thresholds.
- Total number of documents stored reaches specified thresholds.
Create a cluster metrics monitor
To create a cluster metrics monitor, follow these steps:
- Select Alerting > Monitors > Create monitor.
- Select the Per cluster metrics monitor option.
- In the Query section, pick the Request type from the dropdown list.
- (Optional) If you want to filter the API response to use only certain path parameters, enter those parameters under Query parameters. Most APIs that can be used to monitor cluster status support path parameters as described in their documentation (for example, comma-separated lists of index names).
- In the Triggers section, indicate which conditions will trigger an alert. The trigger condition autopopulates a
painless ctxvariable. For example, a cluster monitor watching for Cluster Stats uses the trigger conditionctx.results[0].indices.count <= 0, which triggers an alert based on the number of indexes returned by the query. For more specificity, add any additional Painless conditions supported by the API. To see an example of the condition response, select Preview condition response. - In the Actions section, indicate how you want your users to be notified when a trigger condition is met.
- Select Create. Your new monitor appears in the Monitors list.
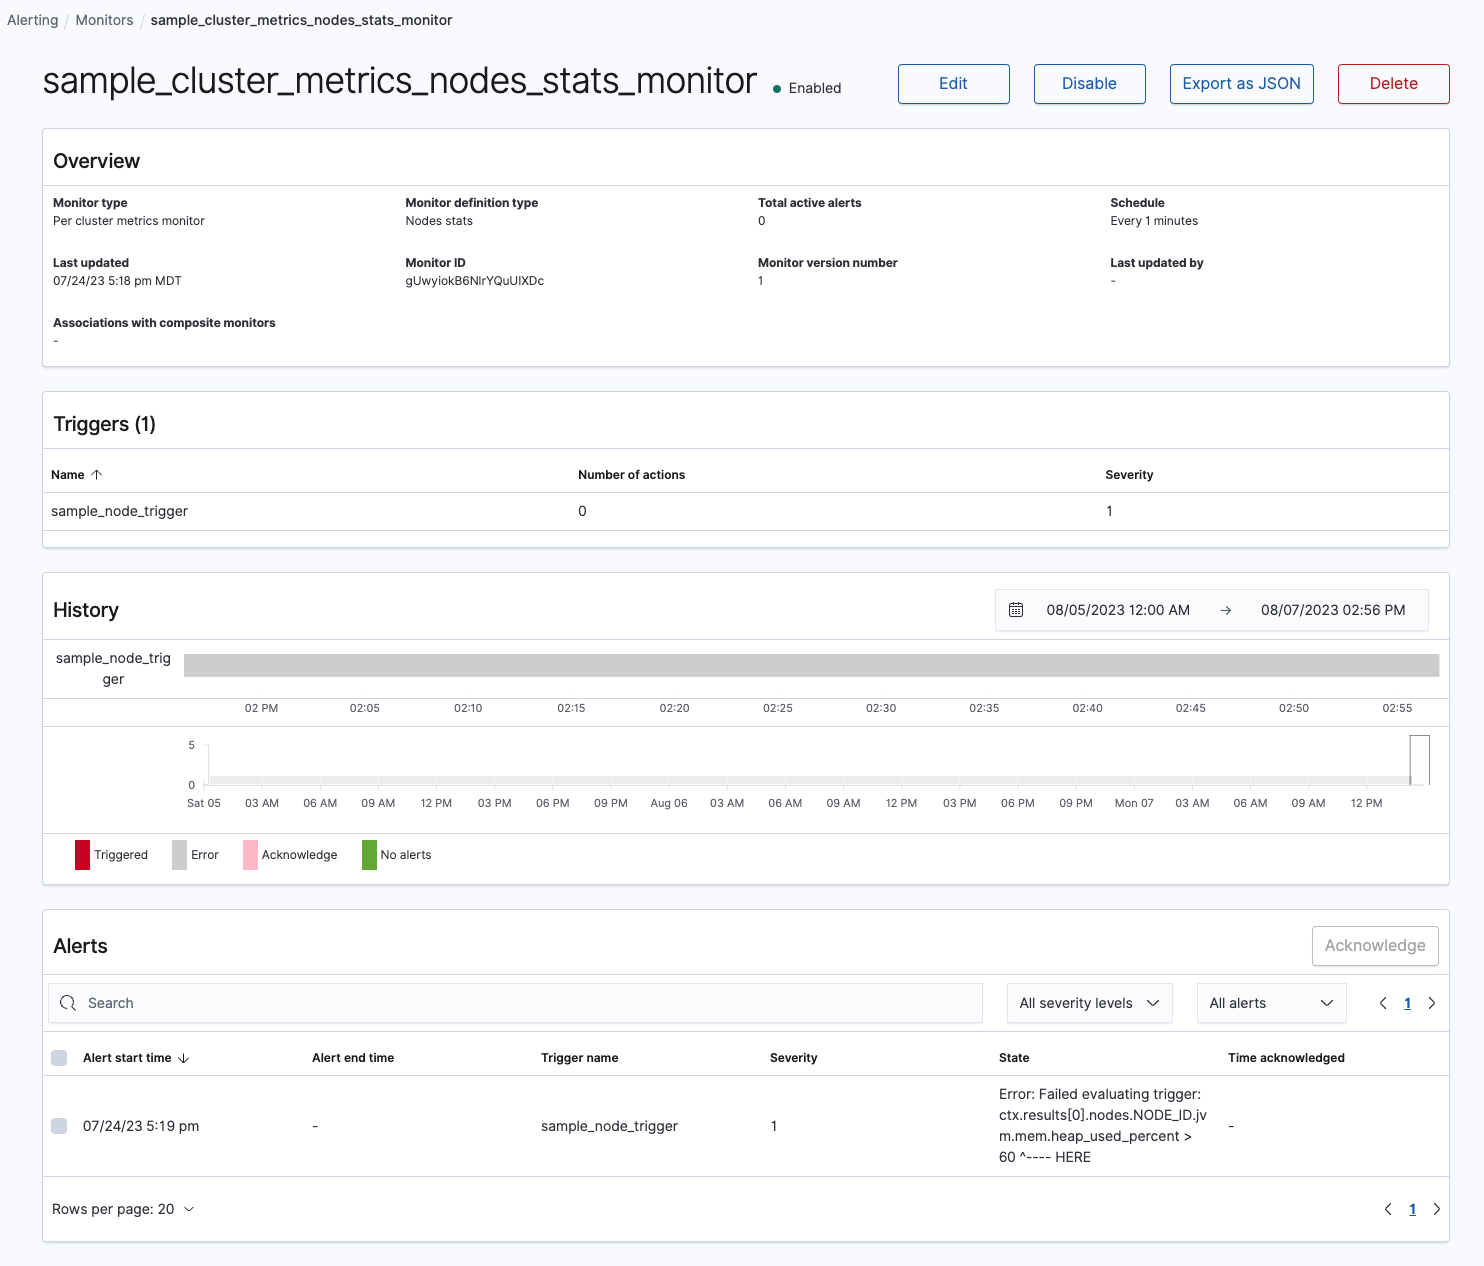
The following example shows a configuration of a cluster metrics monitor.
Supported APIs
Trigger conditions use responses from the following API endpoints. Most APIs that can be used to monitor cluster status support path parameters (for example, comma-separated lists of index names). They do not support query parameters.
- _cluster/health
- _cluster/stats
- _cluster/settings
- _nodes/stats
- _cat/indices
- _cat/pending_tasks
- _cat/recovery
- _cat/shards
- _cat/snapshots
- _cat/tasks
Restrict API fields
If you want to hide fields from the API response and not expose them for alerting, reconfigure the supported_json_payloads.json file inside the Alerting plugin. The file functions as an allow list for the API fields you want to use in an alert. By default, all APIs and their parameters can be used for monitors and trigger conditions.
However, you can modify the file so that cluster metrics monitors can only be created for APIs referenced. Furthermore, only fields referenced in the supported files can create trigger conditions. This supported_json_payloads.json allows for a cluster metrics monitor to be created for the _cluster/stats API, and triggers conditions for the indices.shards.total and indices.shards.index.shards.min fields.
"/_cluster/stats": {
  "indices": [
    "shards.total",
    "shards.index.shards.min"
  ]
}
Painless triggers
Painless scripts define triggers for cluster metrics monitors, similar to per query or per bucket monitors, which are defined using the extraction query definition option. Painless scripts are composed of at least one statement and any additional functions you wish to run.
The cluster metrics monitor supports up to ten triggers.
In the following example, the monitor is configured to call the Cluster Health API for two clusters, cluster-1 and cluster-2. The trigger condition will create an alert when either of the clusters’ status is not green.
The script parameter points the source to the Painless script for (cluster in ctx.results[0].keySet()) if (ctx.results[0][cluster].status != \"green\") return true. See Trigger variables for more painless ctx variable options.
{
  "name": "Cluster Health Monitor",
  "type": "monitor",
  "monitor_type": "query_level_monitor",
  "enabled": true,
  "schedule": {
    "period": {
      "unit": "MINUTES",
      "interval": 1
    }
  },
  "inputs": [
    {
      "uri": {
        "api_type": "CLUSTER_HEALTH",
        "path": "_cluster/health/",
        "path_params": "",
        "url": "http://localhost:9200/_cluster/health/",
        "clusters": ["cluster-1", "cluster-2"]
      }
    }
  ],
  "triggers": [
    {
      "query_level_trigger": {
        "id": "Tf_L_nwBti6R6Bm-18qC",
        "name": "Yellow status trigger",
        "severity": "1",
        "condition": {
          "script": {
            "source": "for (cluster in ctx.results[0].keySet()) if (ctx.results[0][cluster].status != \"green\") return true",
            "lang": "painless"
          }
        },
        "actions": []
      }
    }
  ]
}
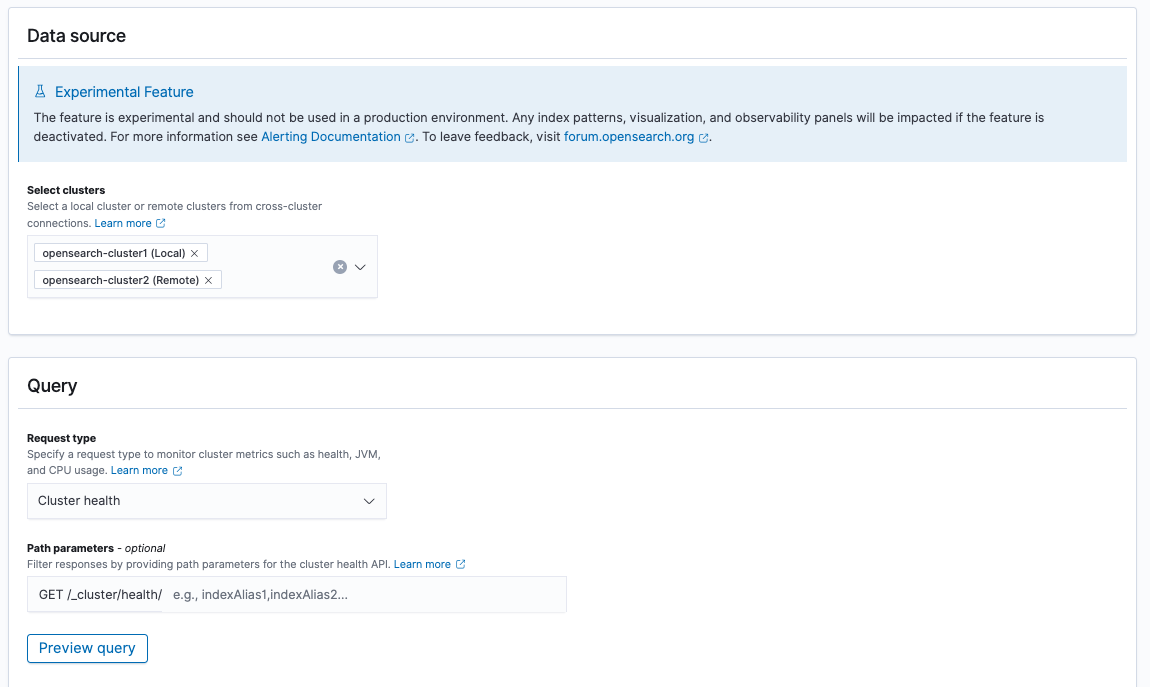
The dashboards interface supports the selection of clusters to be monitored and the desired API. A view of the interface is shown in the following image.
The following permissions are required in order to create a cross-cluster monitor through the dashboards UI: cluster:admin/opensearch/alerting/remote/indexes/get, indices:admin/resolve/index, cluster:monitor/health, and indices:admin/mappings/get.
Limitations
Per cluster metrics monitors have the following limitations:
- The OpenSearch cluster must be in a state where an index’s conditions can be monitored and actions can be executed against the index.
- Removing resource permissions from a user will not prevent that user’s preexisting monitors for that resource from executing.
- Users with permissions to create monitors are not blocked from creating monitors for resources for which they do not have permissions; however, those monitors will not run.