Alerting dashboards and visualizations
Introduced 2.9
Create, manage, and take action on your alerts in a single, consolidated view and identify and resolve issues quickly. Use the Dashboard interface to:
- Set up, add, and adjust rules and conditions that trigger alerts and notifications.
- Create graphs that show trends and patterns and build intuitive dashboards to stay informed of important metrics and data points in real time.
- Monitor your alerts in one place with at-a-glance views.
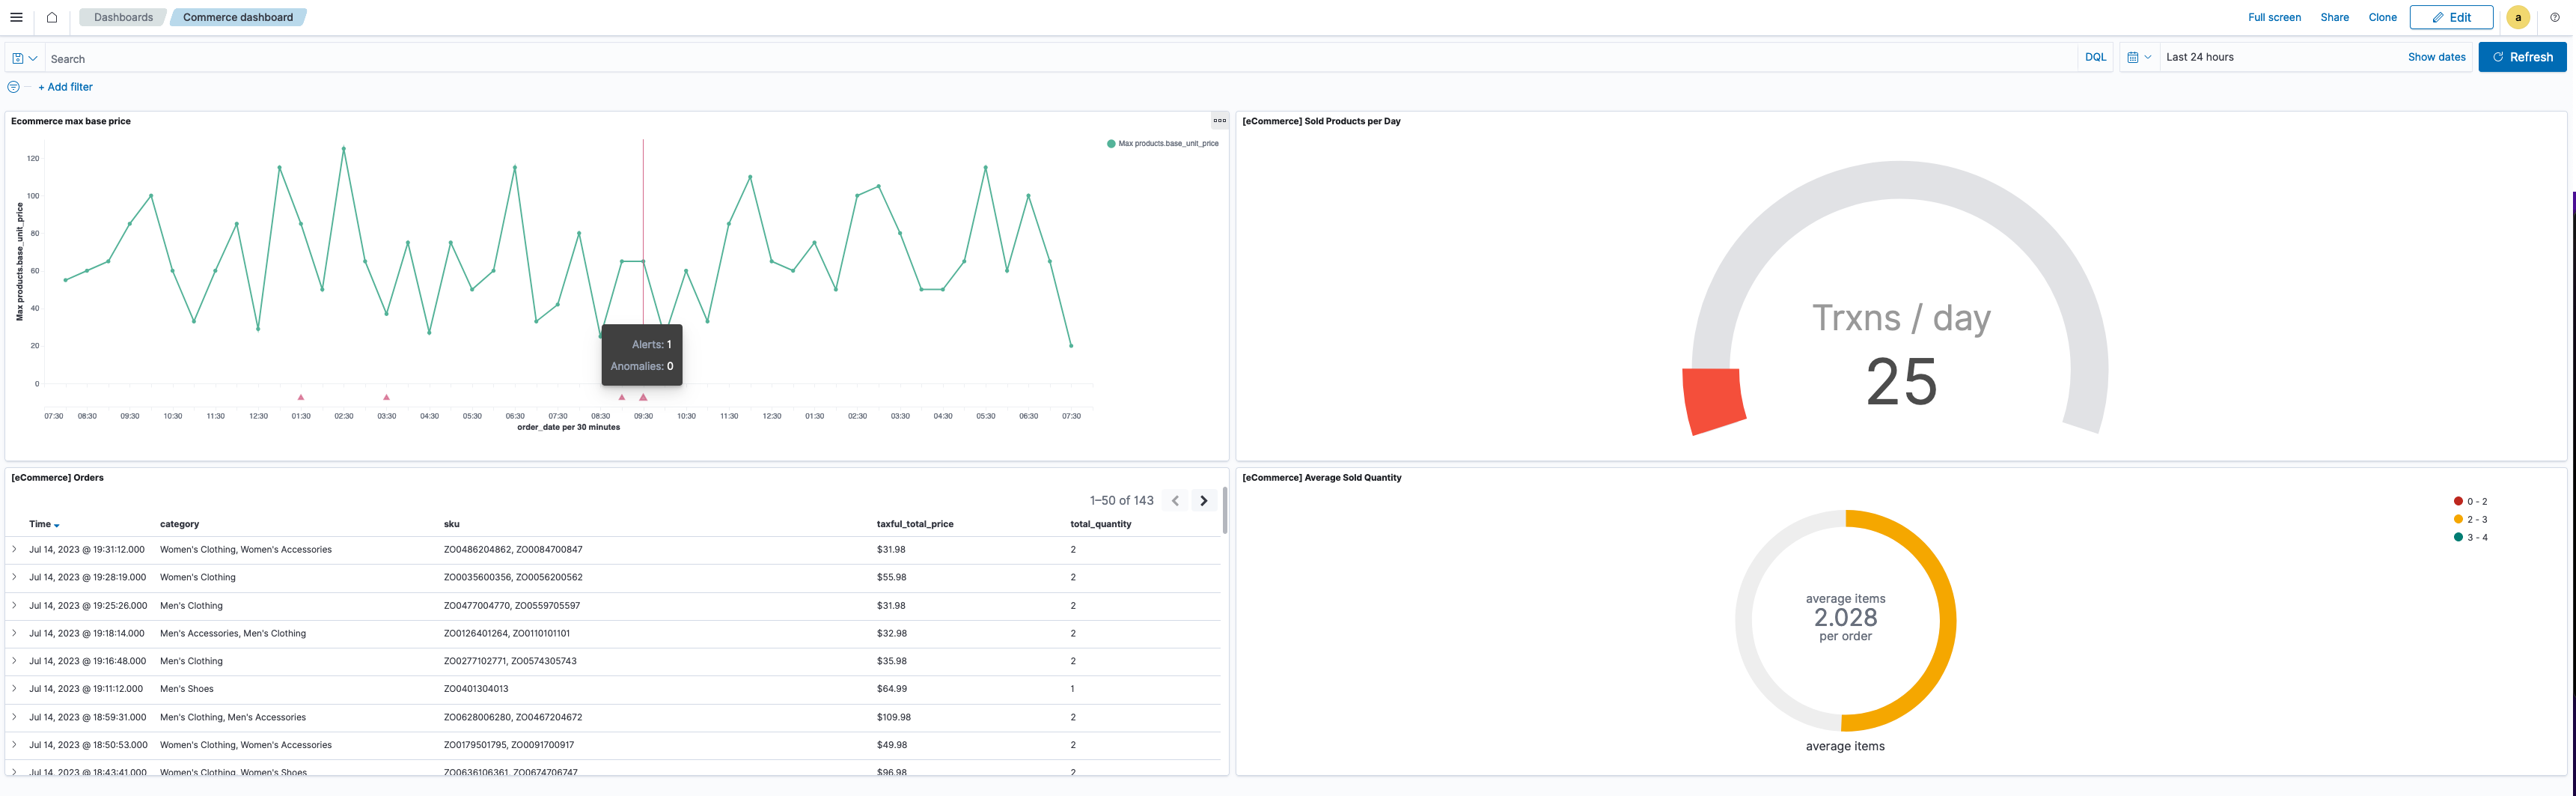
The following image gives you a snapshot of the Dashboard interface.
Getting started
Before getting started, you must have:
- Installed OpenSearch and OpenSearch Dashboards version 2.9 or later. See Installing OpenSearch.
- Installed the Alerting and Notifications Dashboards plugins. See Managing OpenSearch Dashboards plugins to get started.
Configuring admin settings
Users can only access, create, or manage alerts for resources for which they have permissions. Access to alerting dashboards and visualizations is controlled by OpenSearch and OpenSearch Dashboards permissions. It is enabled by default and appears as a feature under Dashboards Management > Advanced Settings > Visualization. If the setting is disabled, it does not appear. You can disable the setting at the cluster level in the opensearch-dashboards.yml file.
General requirements for alerting visualizations
Alerting visualizations are displayed as time-series charts that give you a snapshot of the alert, alert status, last updated time, and reason for the alert. You can display up to 10 metrics on your chart, and each series can be shown as a line on the chart.
Keep in mind the following requirements when setting up or creating alerting visualizations. The visualization:
- Must be a Vizlib line chart
- Must contain at least a Y-axis metric aggregation
- Must not have non-Y-axis metric aggregation types
- Must use the date histogram aggregation type for the X-axis bucket
- Must have an X-axis on the bottom
- Must define one X-axis aggregation bucket
- Must have a valid time-based X-axis
Creating alerting monitors
By default, when you begin to create the alert monitor workflow using the Dashboard interface, you are presented with a menu-driven interface. This interface provides a range of options that are displayed in full screen, in pop-ups, in pull-downs, or in dropdowns. They allow you to define the metrics that can be monitored, set thresholds, customize triggers that automate workflows, and generate actions when conditions are met. Currently, you can only create per query monitors.
To create an alerting monitor:
- Choose Dashboard from the OpenSearch Dashboards main menu.
- From the Dashboards window, select Create and then choose Dashboard.
- Select Add an existing, then select the appropriate alerting visualization from the Add panels list. The visualization is added to the dashboard.
- From the visualization panel, choose the ellipsis icon (
 ).
). - From the Options menu, select Add alerting monitor.
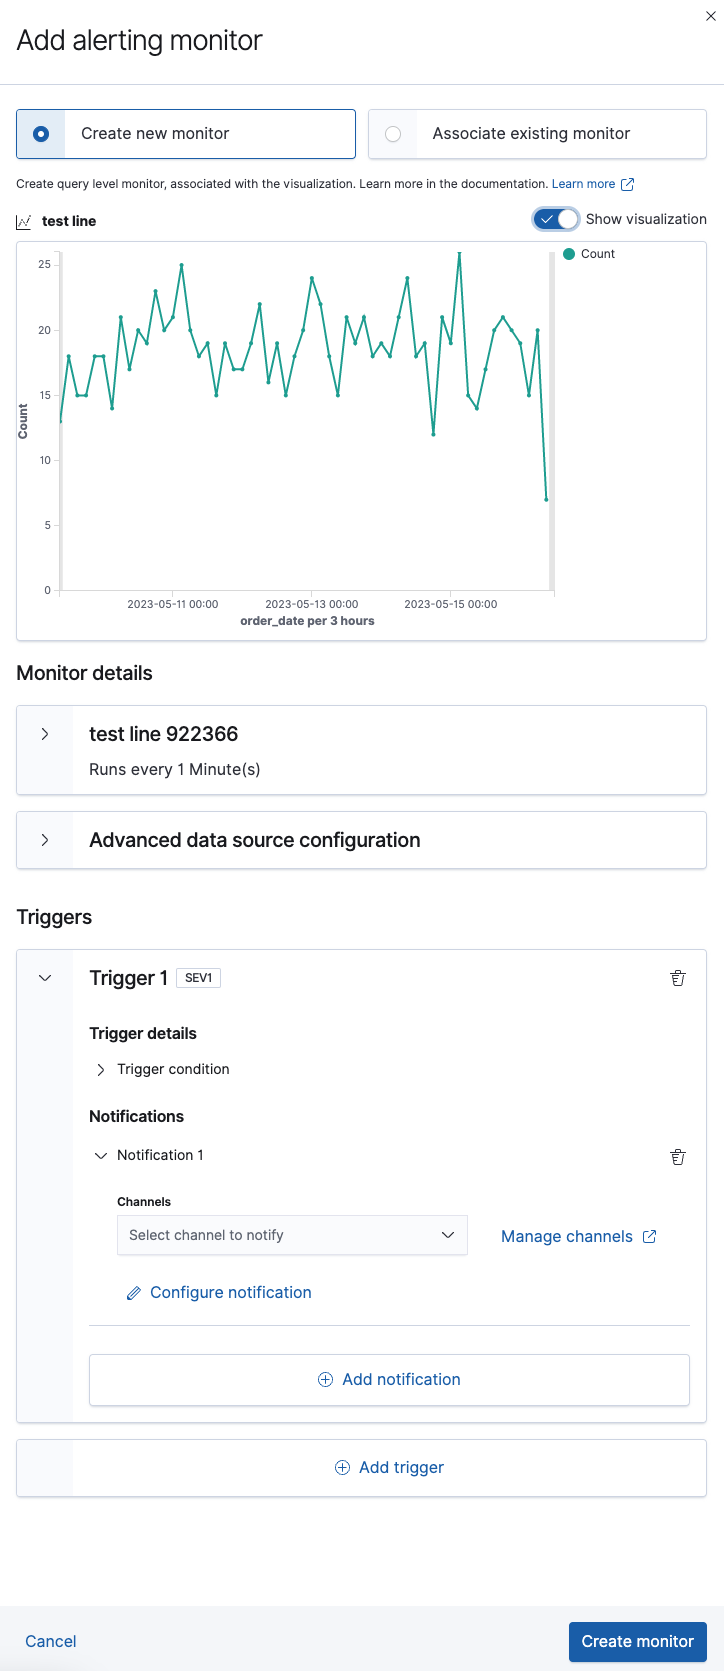
- Input information for Monitor details and Triggers.
- Choose Create monitor. The monitor is added to the visualization.
An example of these steps is shown in the following screenshot.
Associating monitors
You can associate certain monitor types with a visualization using the Dashboard interface instead of the plugin page, giving you a single interface through which to add, view, and edit monitor data.
Continuing with the alerting visualization and dashboard created in the preceding section, associate an existing monitor with a visualization by following these steps:
- From the visualization panel, choose the ellipsis icon ().
- Select Associated monitors.
- From the Select monitor to associate dropdown menu, select the monitor. Only eligible monitors are listed in the dropdown menu.
- View the monitor’s basic information. To view comprehensive details, select View monitor page to open the Alerting plugin page.
- Select Associate monitor. An existing monitor is associated with the visualization.
Exploring alerting monitor details
Once you’ve created or associated alerting monitors, verify that the monitor is generating alerts and explore alert details by following these steps:
- Open the alerting dashboard. Alerts are indicated on the visualization with a triangle icon (
 ).
). - Hover over the triangle icon () to view high-level data, such as number of alerts. To investigate alert details, select the triangle icon () to open a flyout with more detailed monitor information. Alternatively, select the ellipsis icon () in the visualization panel and choose View events.
- Select the ellipsis icon (), then Alerting > Associated monitors.
- Choose an alerting monitor from the list. Information such as history, alerts, and associated visualizations is shown within the visualization panel.
- Unlink or edit a monitor.
- Unlink a monitor from the visualization by selecting the link icon (
 ) under Actions. This only unlinks the monitor from the visualization; it does not delete the monitor.
 - Edit the monitor’s metrics by selecting the edit icon (
 ).
).
- Unlink a monitor from the visualization by selecting the link icon (