
OpenSearch
One platform. Full visibility.
Faster insights.
Unify logs, metrics, traces, APM, and dashboards in a single, OpenTelemetry native platform built for modern applications and AI agents. Eliminate fragmented tools and gain end-to-end visibility across your entire stack from infrastructure to microservices, distributed systems, and AI agents.
Quick start
With the OpenSearch Observability Stack you can deploy a pre-configured, full-stack solution in minutes.
Observability webinars
Learn more from our series of webinars hosted by the OpenSearch Software Foundation and its members.
Learn more from our series of webinars hosted by the OpenSearch Software Foundation and its members.
Observability for every layer of your stack
OpenSearch observability spans interconnected capability areas, each purpose-built for a different layer of your stack, but designed to work together as a unified, OpenTelemetry-native experience.
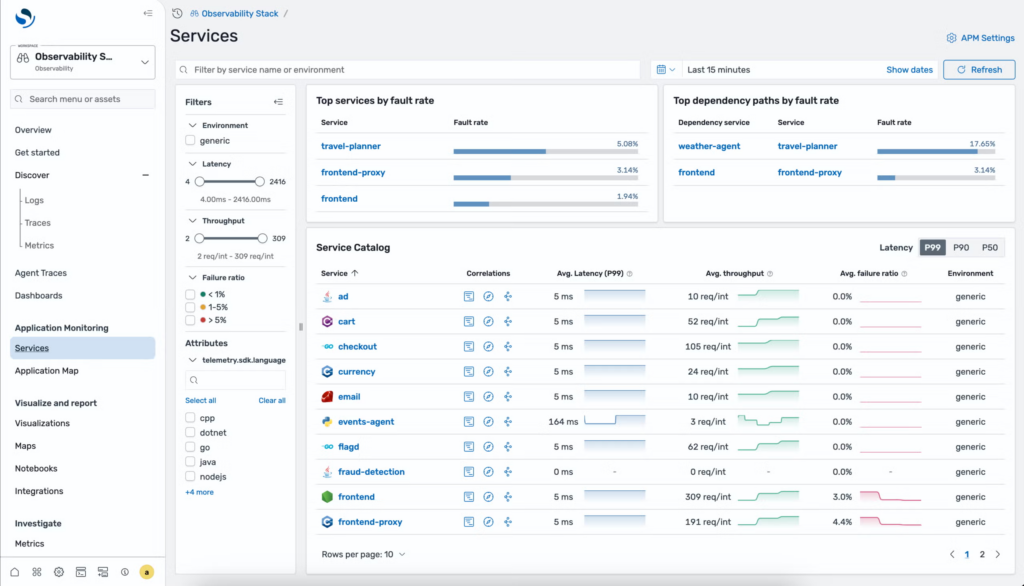
Distributed tracing and APM
See inside your applications with distributed tracing, service maps, latency breakdowns, and error tracking across microservices. OTel-native instrumentation provides automatic RED metrics (Rate, Errors, Duration) computed from your trace data. Correlate traces with logs in a single click to move from “this request was slow” to “here’s the error log that explains why.”
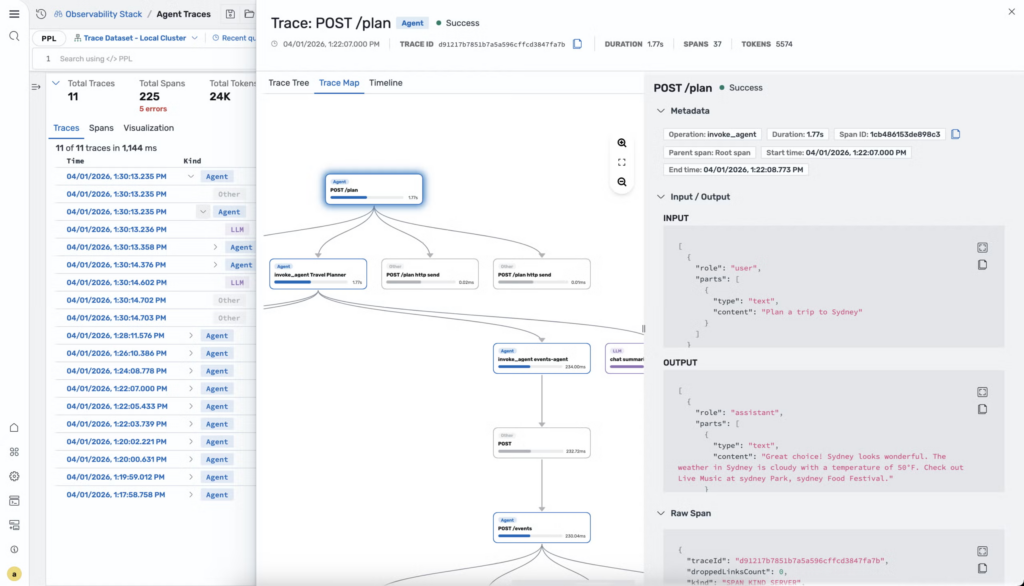
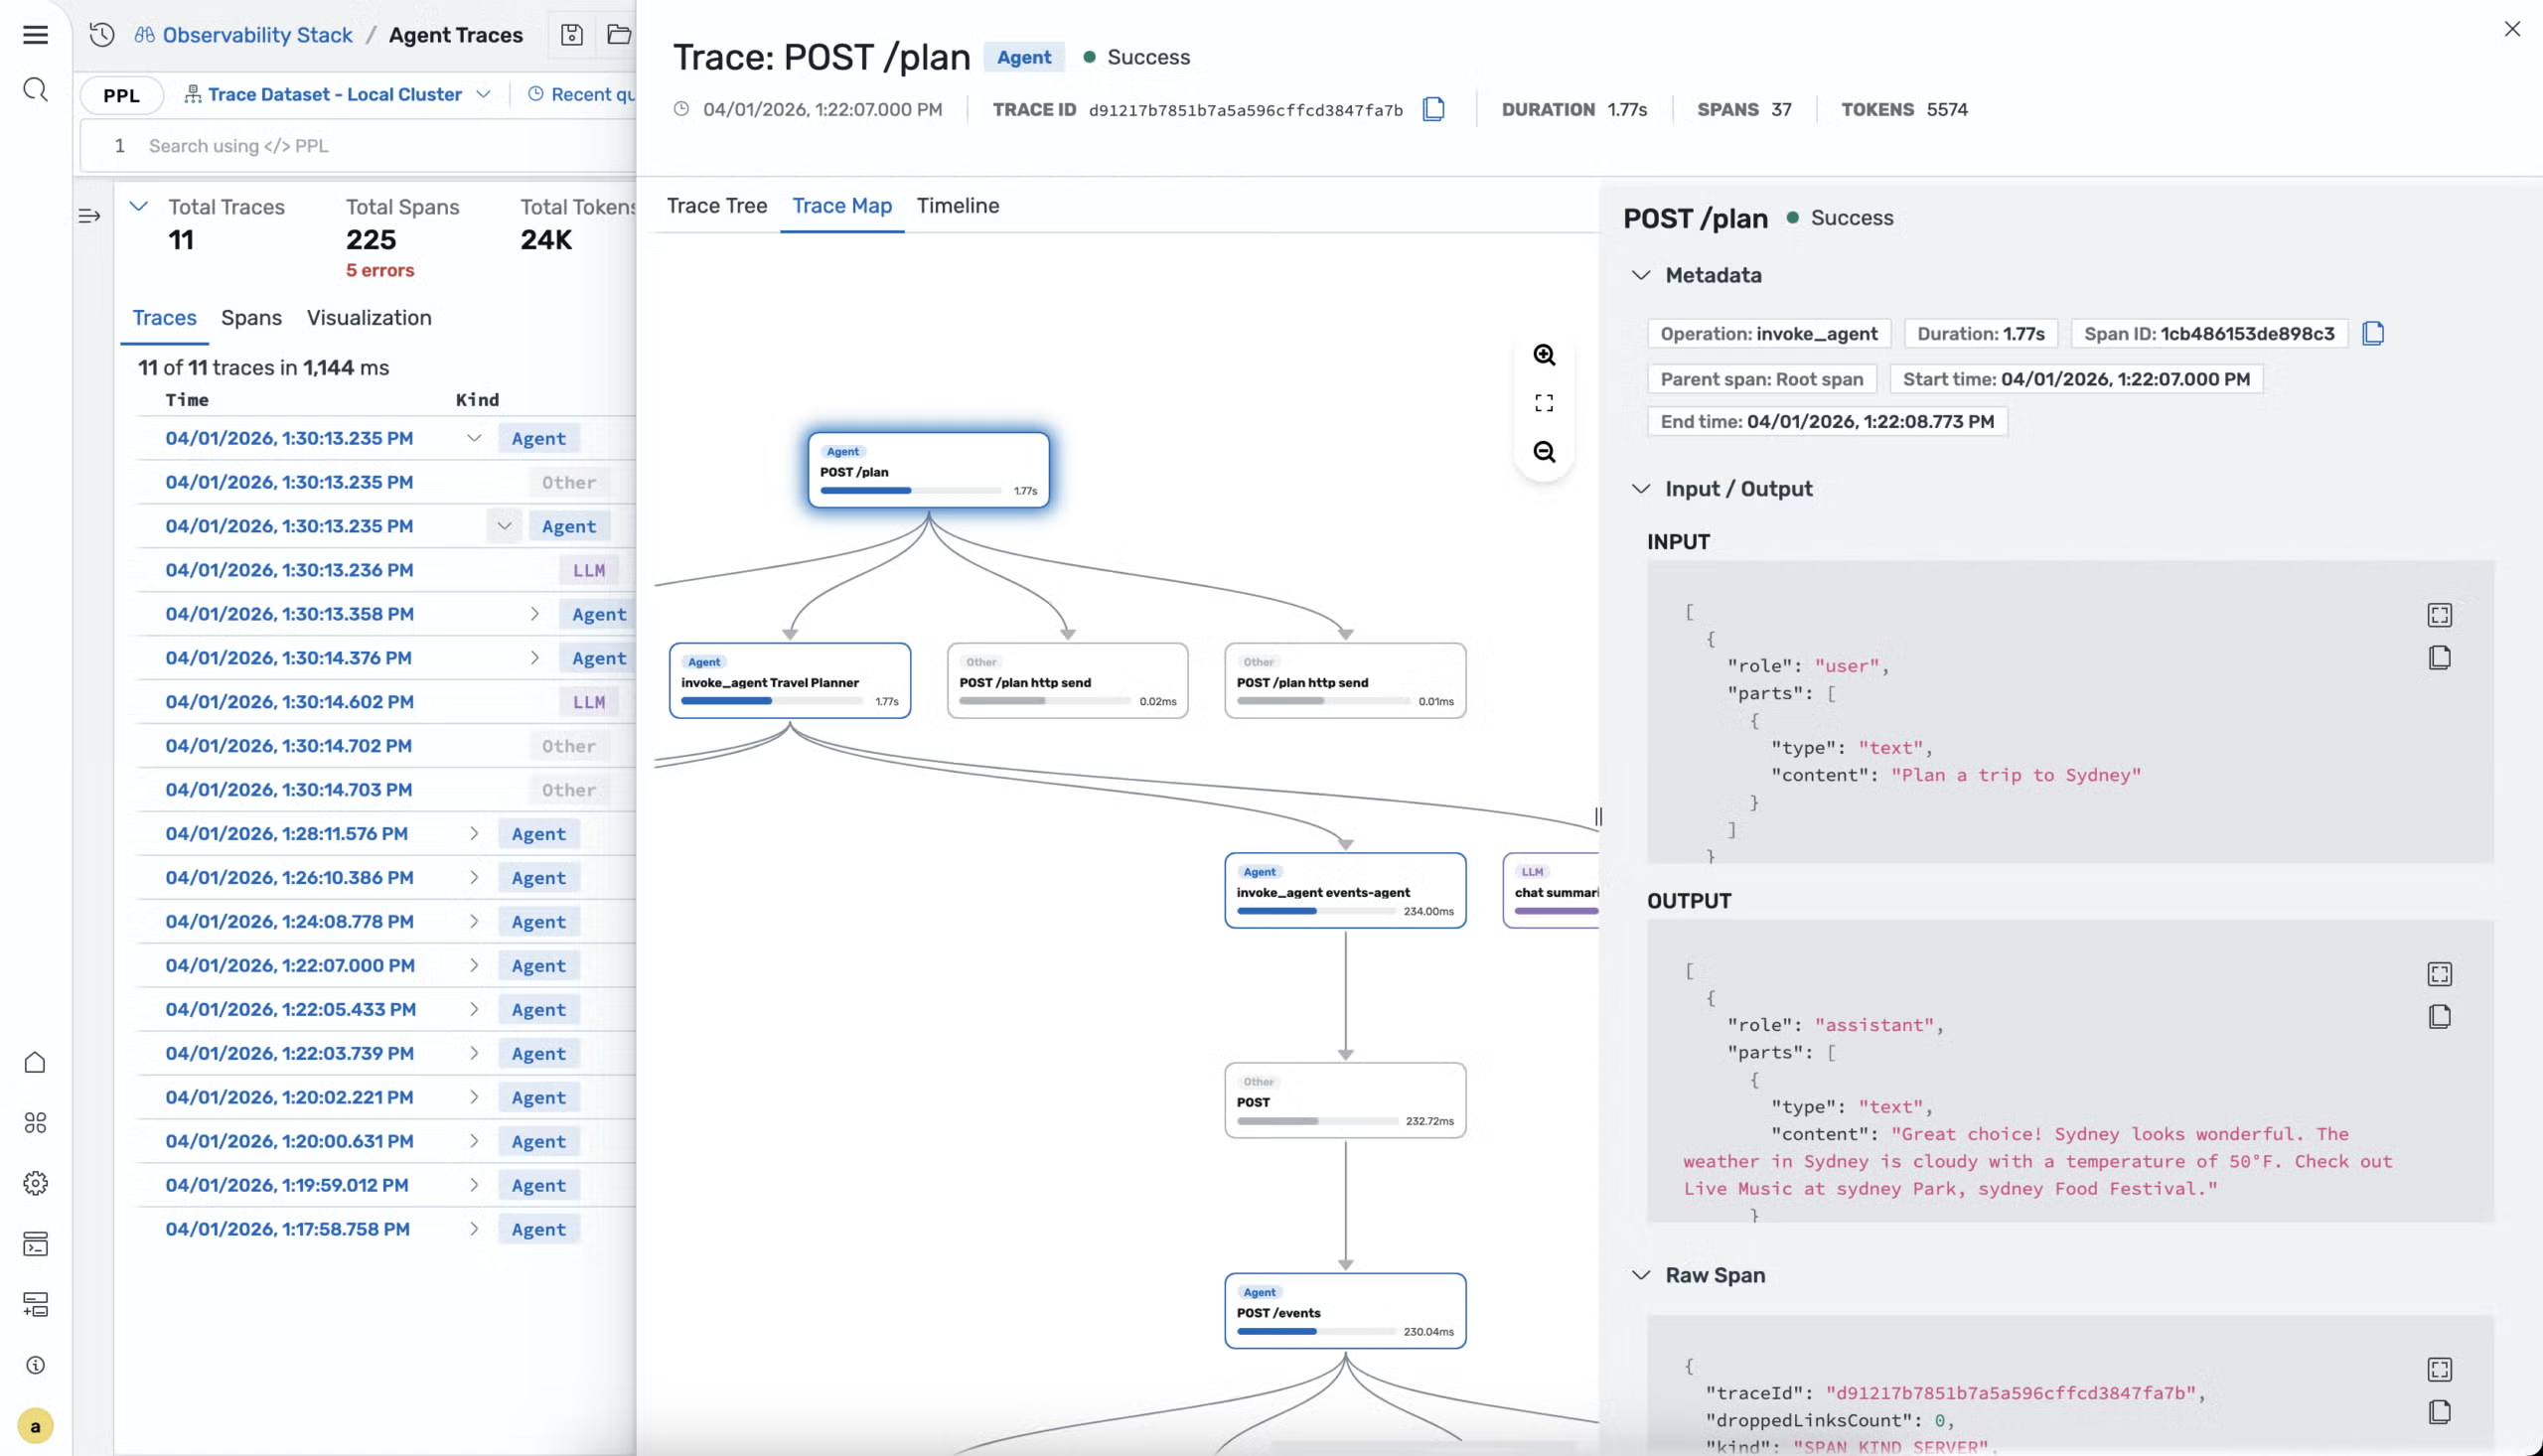
AI agent observability
Trace agent reasoning chains, visualize tool-call sequences and decision flows, benchmark correctness with LLM-as-judge evaluation, and compare agent performance across models and configurations.
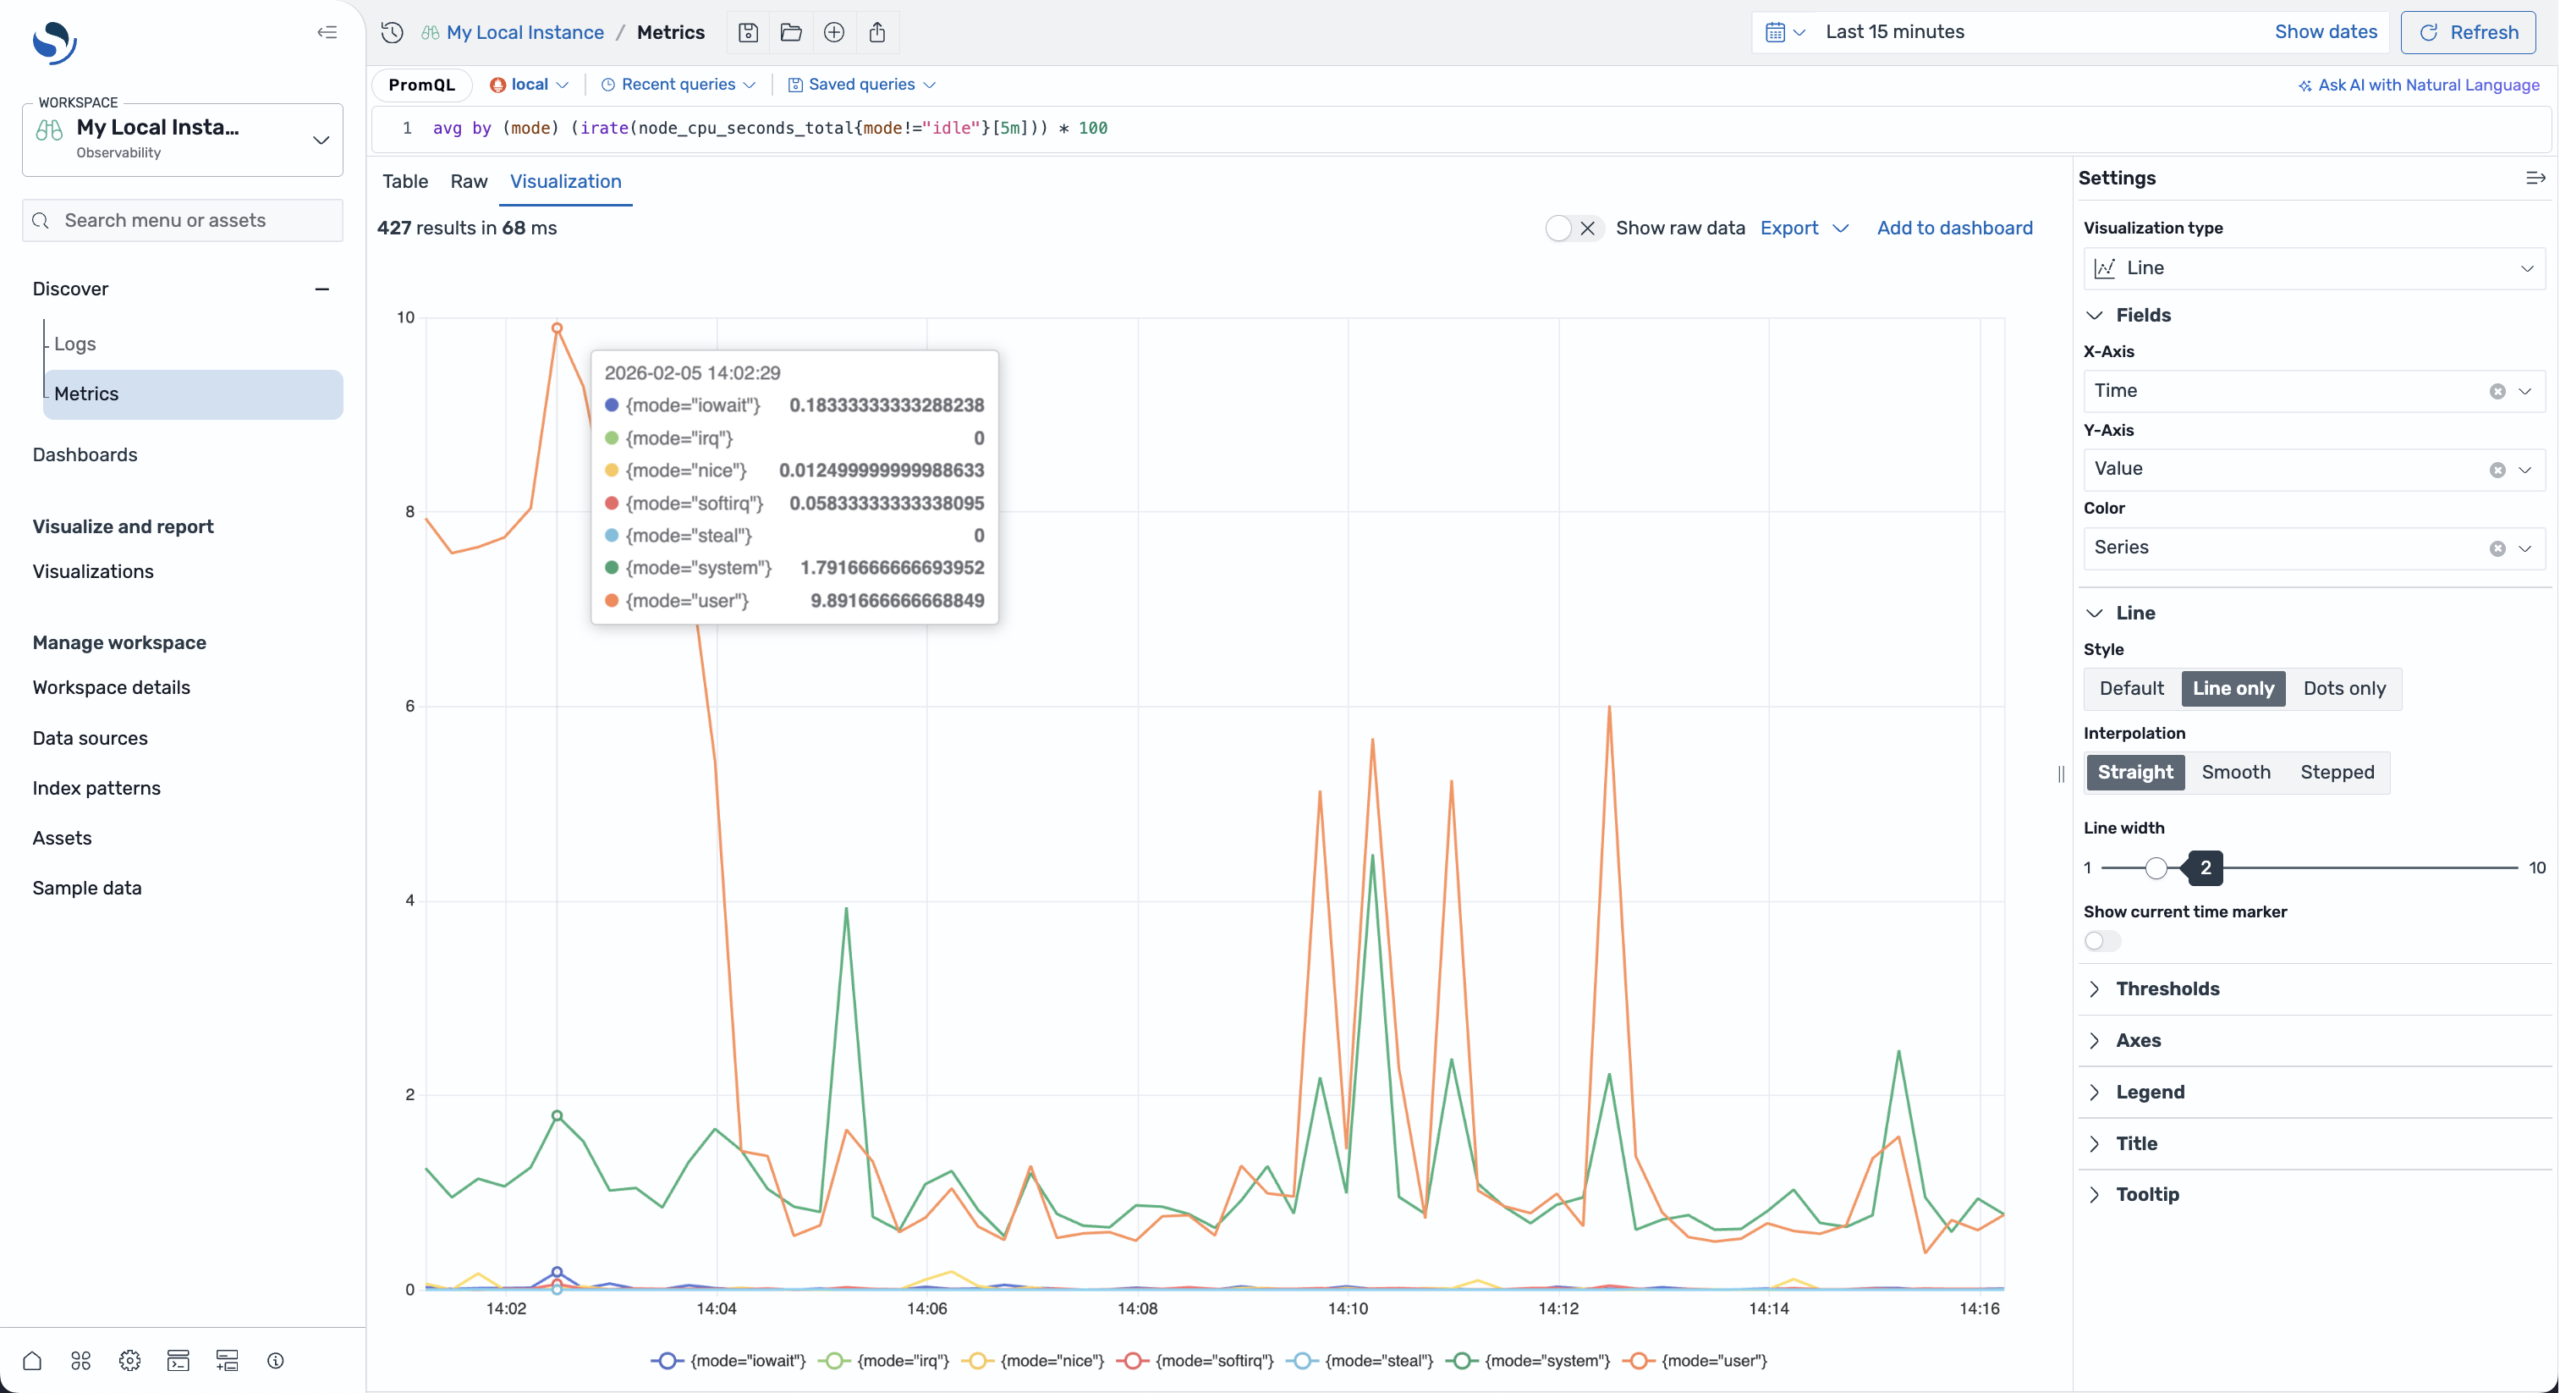
Metrics and Prometheus
Gather all signals in a single platform. Create PromQL-powered metrics dashboards with custom panels, alerting, and auto-computed RED metrics. Compatible with Prometheus remote-write.
Log analytics
Search, correlate, and get alerts on your logs. Full-text search with PPL, structured log ingestion via OpenSearch Data Prepper and Fluent Bit, and log-to-trace correlation through shared context.
OpenTelemetry
OpenSearch Observability is built on OTel from the ground up. All data ingestion uses OTel semantic conventions and protocols, making your existing instrumentation portable across any OTel-compatible backend.
Observability architecture in OpenSearch
OpenSearch observability is powered by a unified platform architecture — a core search and analytics engine, a pipeline processor for ingestion, and a visualization layer — working together to collect, store, analyze, and act on logs, metrics, and traces.
Anomaly detection, log analytics, trace correlation, and alerting all run as plugins inside a single distributed engine, sharing the same indexes, the same security model, and the same query language. The architecture diagram below shows how this works: a small number of components that combine to cover use cases that typically require three or four separate tools.
OpenTelemetry Collector →
A vendor-neutral telemetry pipeline that collects, processes, and exports logs, metrics, and traces from applications and infrastructure.
OpenSearch Data Prepper →
An OpenSearch-native ingestion and transformation service that parses, enriches, and routes telemetry data enabling correlation (such as logs with traces) and computing RED metrics from trace data automatically.
Prometheus Metrics →
A metrics collection and monitoring system that OpenSearch integrates with to provide time-series observability data including CPU, memory, RPS, error rates, and latency.
OpenSearch Core →
The scalable data platform and analytics engine. Stores, indexes, and queries logs, metrics, traces, and AI telemetry for the single source of truth for observability.
AI and Machine Learning →
The intelligent control plane. Uses AI to interpret user intent, orchestrate queries across data sources, correlate signals, and automatically identify root causes.
OpenSearch Dashboards →
The visualization layer. Interactive dashboards, observability views (logs, metrics, traces, APM), and increasingly natural-language-driven investigation.
Piped Processing Language →
A query language designed for log and event analysis. Chain commands to filter, transform, and analyze data efficiently across all observability data and can query across the different signal types.
Why OpenSearch?
The truly open source
observability suite
OpenSearch is a distributed, community-driven, fully open source search and analytics suite. Built-in security, scalable capacity and performance, and support for high availability help make OpenSearch a solid foundation for enterprise-grade applications across search, observability, security analytics, and more. You can run OpenSearch on premises or in hybrid or multicloud environments and put its broad and deep feature set to work as you see fit—with no licensing fees.
Self-host anywhere without vendor lock-in
OpenSearch is Apache 2.0 licensed and governed by the Linux Foundation. Build without fear of feature gating or risk of relicensing.
Unified platform instead of fragmented tools
Logs, metrics, traces, and AI agent observability in one platform with a common query language. No need to operate four separate systems with four separate operational burdens.
OpenTelemetry-native
Use OpenTelemetry standard instrumentation across all your workflows. OpenSearch observability is built on OTEL from the ground up — all data ingestion uses OTel protocols and the same semantic conventions, making your existing instrumentation portable across any OTel-compatible backend.
GenAI-first
Purpose-built views for AI agent tracing using standard GenAI semantic conventions. GenAI trace visualizations. LLM-as-judge evaluation. No other open source observability platform offers these capabilities natively.
Predictable costs
Self-hosted with predictable costs. No per-host, per-GB, or per-seat cost surprises.
Fast time to value
Deploy full-stack observability with minimal setup and achieve value in minutes instead of weeks.
OpenSearch platform capabilities for observability
OpenSearch provides core platform capabilities that underpin every observability workflow. These tools work across all observability use cases from traditional infrastructure monitoring to AI agent evaluation.
Take data from raw to RED
OpenSearch Data Prepper transforms raw telemetry into structured, enriched, and correlated data making observability faster, easier, and AI-ready. For observability, Data Prepper transforms telemetry data to enable correlation (such as logs with traces) and prepare data for efficient indexing. It computes RED metrics from trace data automatically.
Raw logs are often unstructured, hard to search, and inconsistent across services. Data Prepper parses logs into structured fields and extracts key attributes like service, error code, and latency.
{
  "service": "checkout",
  "error": "timeout",
  "latency": 123
}
Investigate with intuitive, powerful queries
Piped Processing Language (PPL) is an intuitive query language for observability workflows. You can use it to filter, transform, aggregate, and visualize telemetry data.
PPL is the OpenSearch platform standard query language and its used across all OpenSearch solution areas including observability, search, and security analytics.
source = ss4o_logs-*
| where severity = "ERROR"
| stats count() by service.name
| sort -
count()
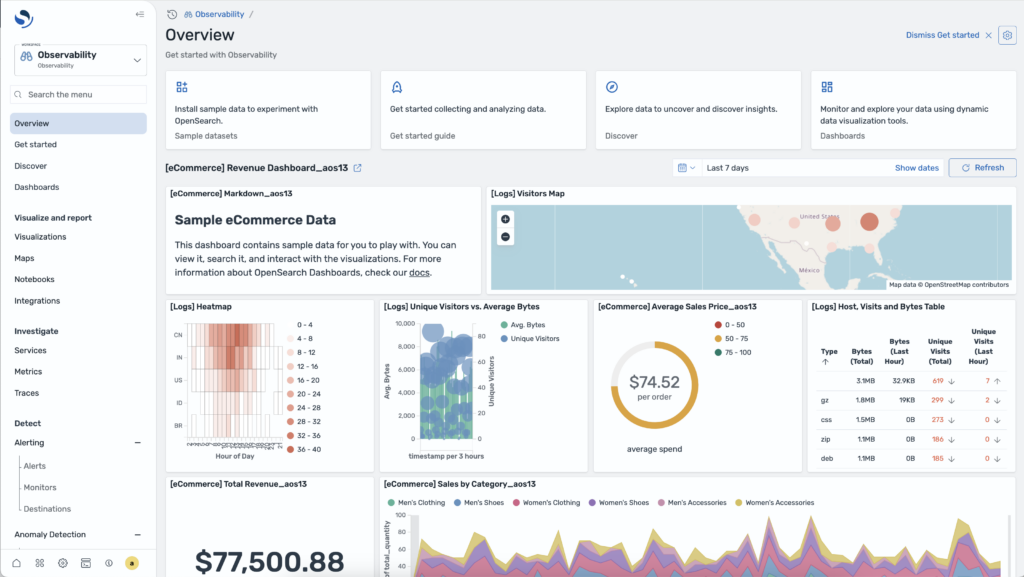
Visualizations, simplified
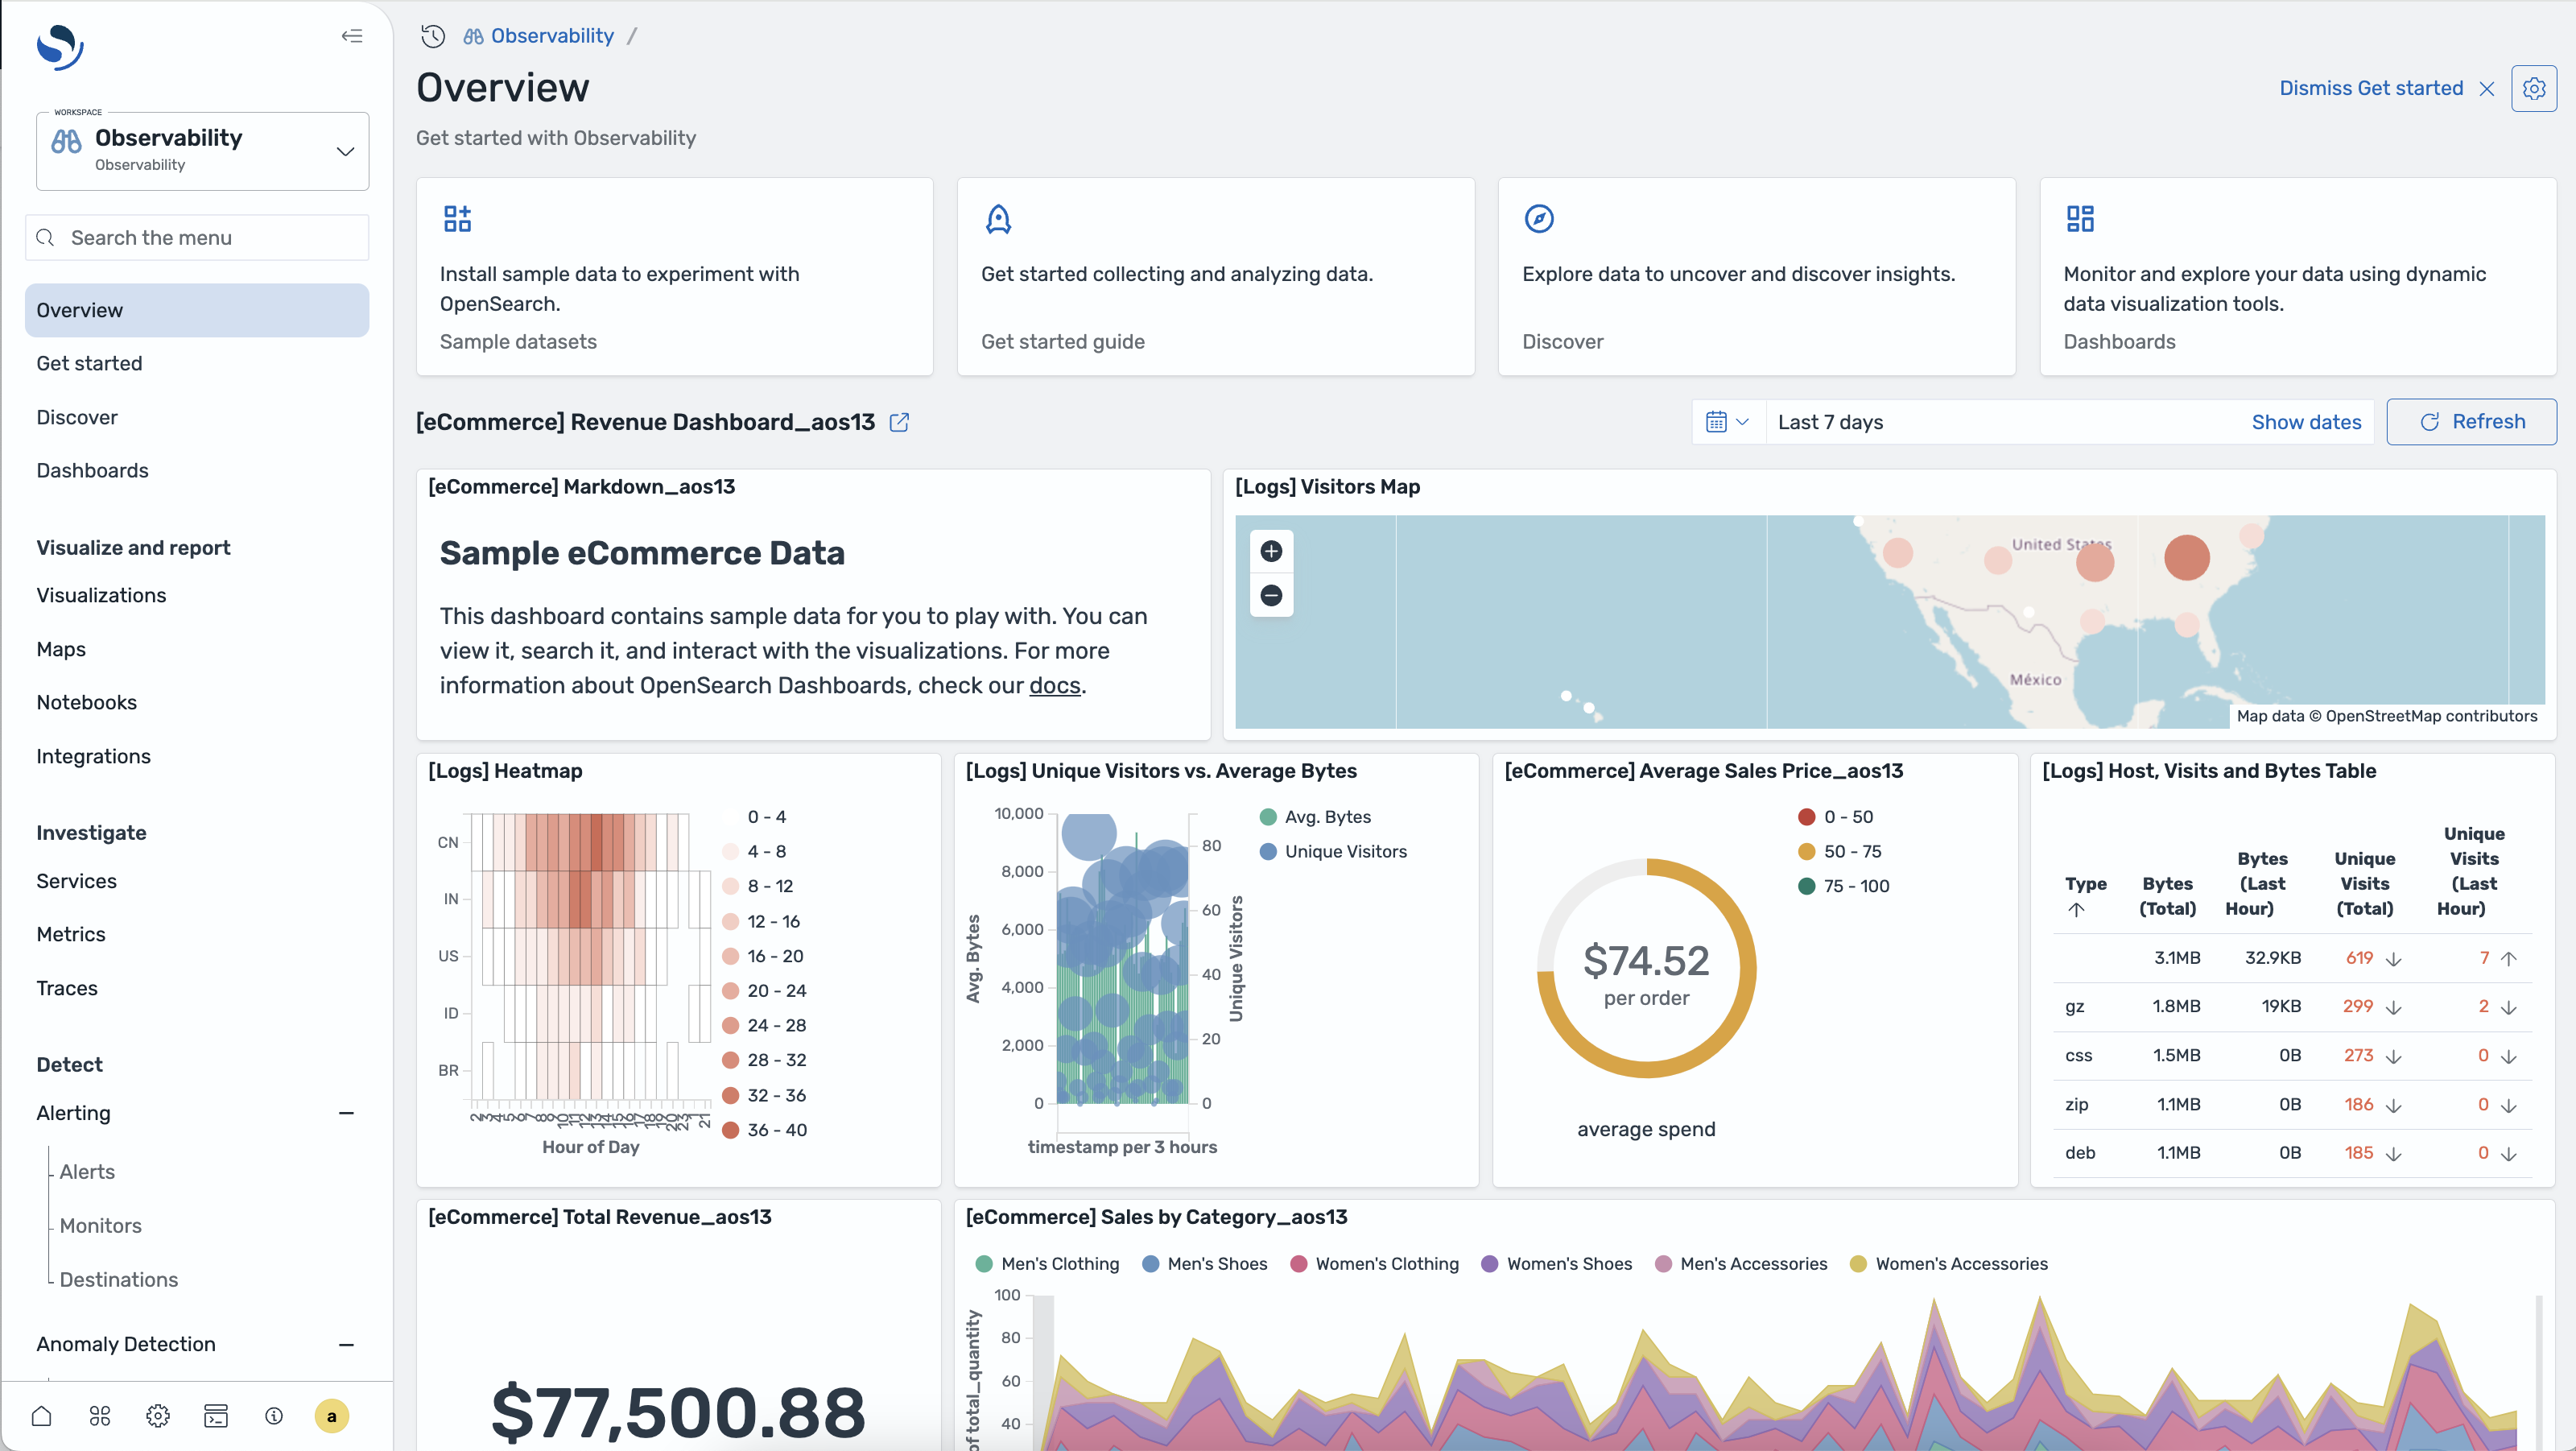
OpenSearch Dashboards is the visual and interaction layer of the platform where users explore data, monitor systems, and investigate issues. It provides out-of-the-box visualization components for trace analytics, log exploration, metric panels, and alerting. Build custom dashboards with drag-and-drop panels, or start from pre-built templates.
Simplify observability with a single dashboard that brings together real-time monitoring, system topology, and deep debugging tools. Monitor metrics, logs, and traces to boost performance and resolve issues in near-real time to keep your systems running smoothly.

Observability in Action
| When you need to… | Use | |
|---|---|---|
| Debug a slow microservice | APM and distributed tracing | APM docs → |
| Monitor AI agent behavior | AI agent observability | Agent Health → |
| Centralize application logs | Log analytics | Log ingestion docs → |
| Track infrastructure metrics | Metrics and Prometheus | Metrics docs → |
| Build a custom dashboard | OpenSearch Dashboards | Dashboards docs → |
| Set up anomaly-based alerts | Alerting plugin | Alerting docs → |
| Query across clusters | Cross-cluster search | CCS docs → |
| Deploy on Kubernetes | K8s Operator | K8s Operator docs → |
Are you ready to go zero to full-stack in minutes?
With the OpenSearch Observability Stack you can deploy in minutes a pre-configured, full-stack solution that bundles OpenTelemetry Collector, Prometheus, OpenSearch Data Prepper, and OpenSearch Dashboards. Own your data completely — no vendor lock-in, no licensing surprises.
QUICK START
$
curl -fsSL https://raw.githubusercontent.com/opensearch-project/observability-stack/main/install.sh | bash
Choose your integration style
Three paths to production observability. Pick the one that fits your workflow.
GenAI SDK
One-line setup with automatic OpenTelemetry instrumentation. Decorators for agents, tools, and workflows.
example.py
PYTHON
from opensearch_genai_sdk_py import register, agent, tool
# One-line setup — configures OTEL pipeline automatically
register(service_name="my-app")
@tool(name="get_weather")
def get_weather(city: str) -> dict:
    return {"city": city, "temp": 22, "condition": "sunny"}
@agent(name="weather_assistant")
def assistant(query: str) -> str:
    data = get_weather("Paris")
    return f"{data['condition']}, {data['temp']}C"
# Automatic OTEL traces, metrics, and logs
result = assistant("What's the weather?")
Key benefits

Zero configuration required
Automatic instrumentation of popular frameworks
Instant OTEL traces and metrics
Works with existing code
Production-ready in 5 minutes
Manual OTEL instrumentation
Full control over your observability. Use standard OTEL APIs directly.
example.py
PYTHON
from opentelemetry import trace
from opentelemetry.sdk.trace import TracerProvider
from opentelemetry.sdk.trace.export import BatchSpanProcessor
from opentelemetry.exporter.otlp.proto.grpc.trace_exporter import OTLPSpanExporter
# Configure OTEL with Observability Stack
provider = TracerProvider()
exporter = OTLPSpanExporter(endpoint="http://localhost:4317")
provider.add_span_processor(BatchSpanProcessor(exporter))
trace.set_tracer_provider(provider)
# Use standard OTEL APIs
tracer = trace.get_tracer(__name__)
with tracer.start_as_current_span("agent_task"):
    response = llm.generate(prompt)
    span = trace.get_current_span()
    span.set_attribute("gen_ai.request.model", "gpt-4")
    span.set_attribute("gen_ai.usage.output_tokens", 150)
Key benefits
Standard OTEL APIs – no vendor lock-in
Full control over spans and attributes
Custom instrumentation for your use case
Works with any OTEL-compatible backend
Easy migration to/from other OTEL tools
Bring your own OTEL setup
Already using OTEL? Just point your exporter to Observability Stack. Keep your existing setup.
example.py
PYTHON
from opentelemetry.sdk.trace.export import BatchSpanProcessor
from opentelemetry.exporter.otlp.proto.grpc.trace_exporter import OTLPSpanExporter
# Add Observability Stack as an additional exporter
# Keep your existing OTEL configuration
exporter = OTLPSpanExporter(
    endpoint="http://localhost:4317"
)
# Add to your existing trace provider
trace_provider.add_span_processor(
    BatchSpanProcessor(exporter)
)
# Your existing OTEL instrumentation continues to work
# Traces now flow to both your existing backend AND Observability Stack
Key Benefits
Keep your existing OTEL setup
Multi-backend support (send to multiple destinations)
No code changes required
Works with any OTEL collector
Key benefits
Keep your existing OTEL setup
Multi-backend support (send to multiple destinations)
No code changes required
Works with any OTEL collector
Gradual migration path