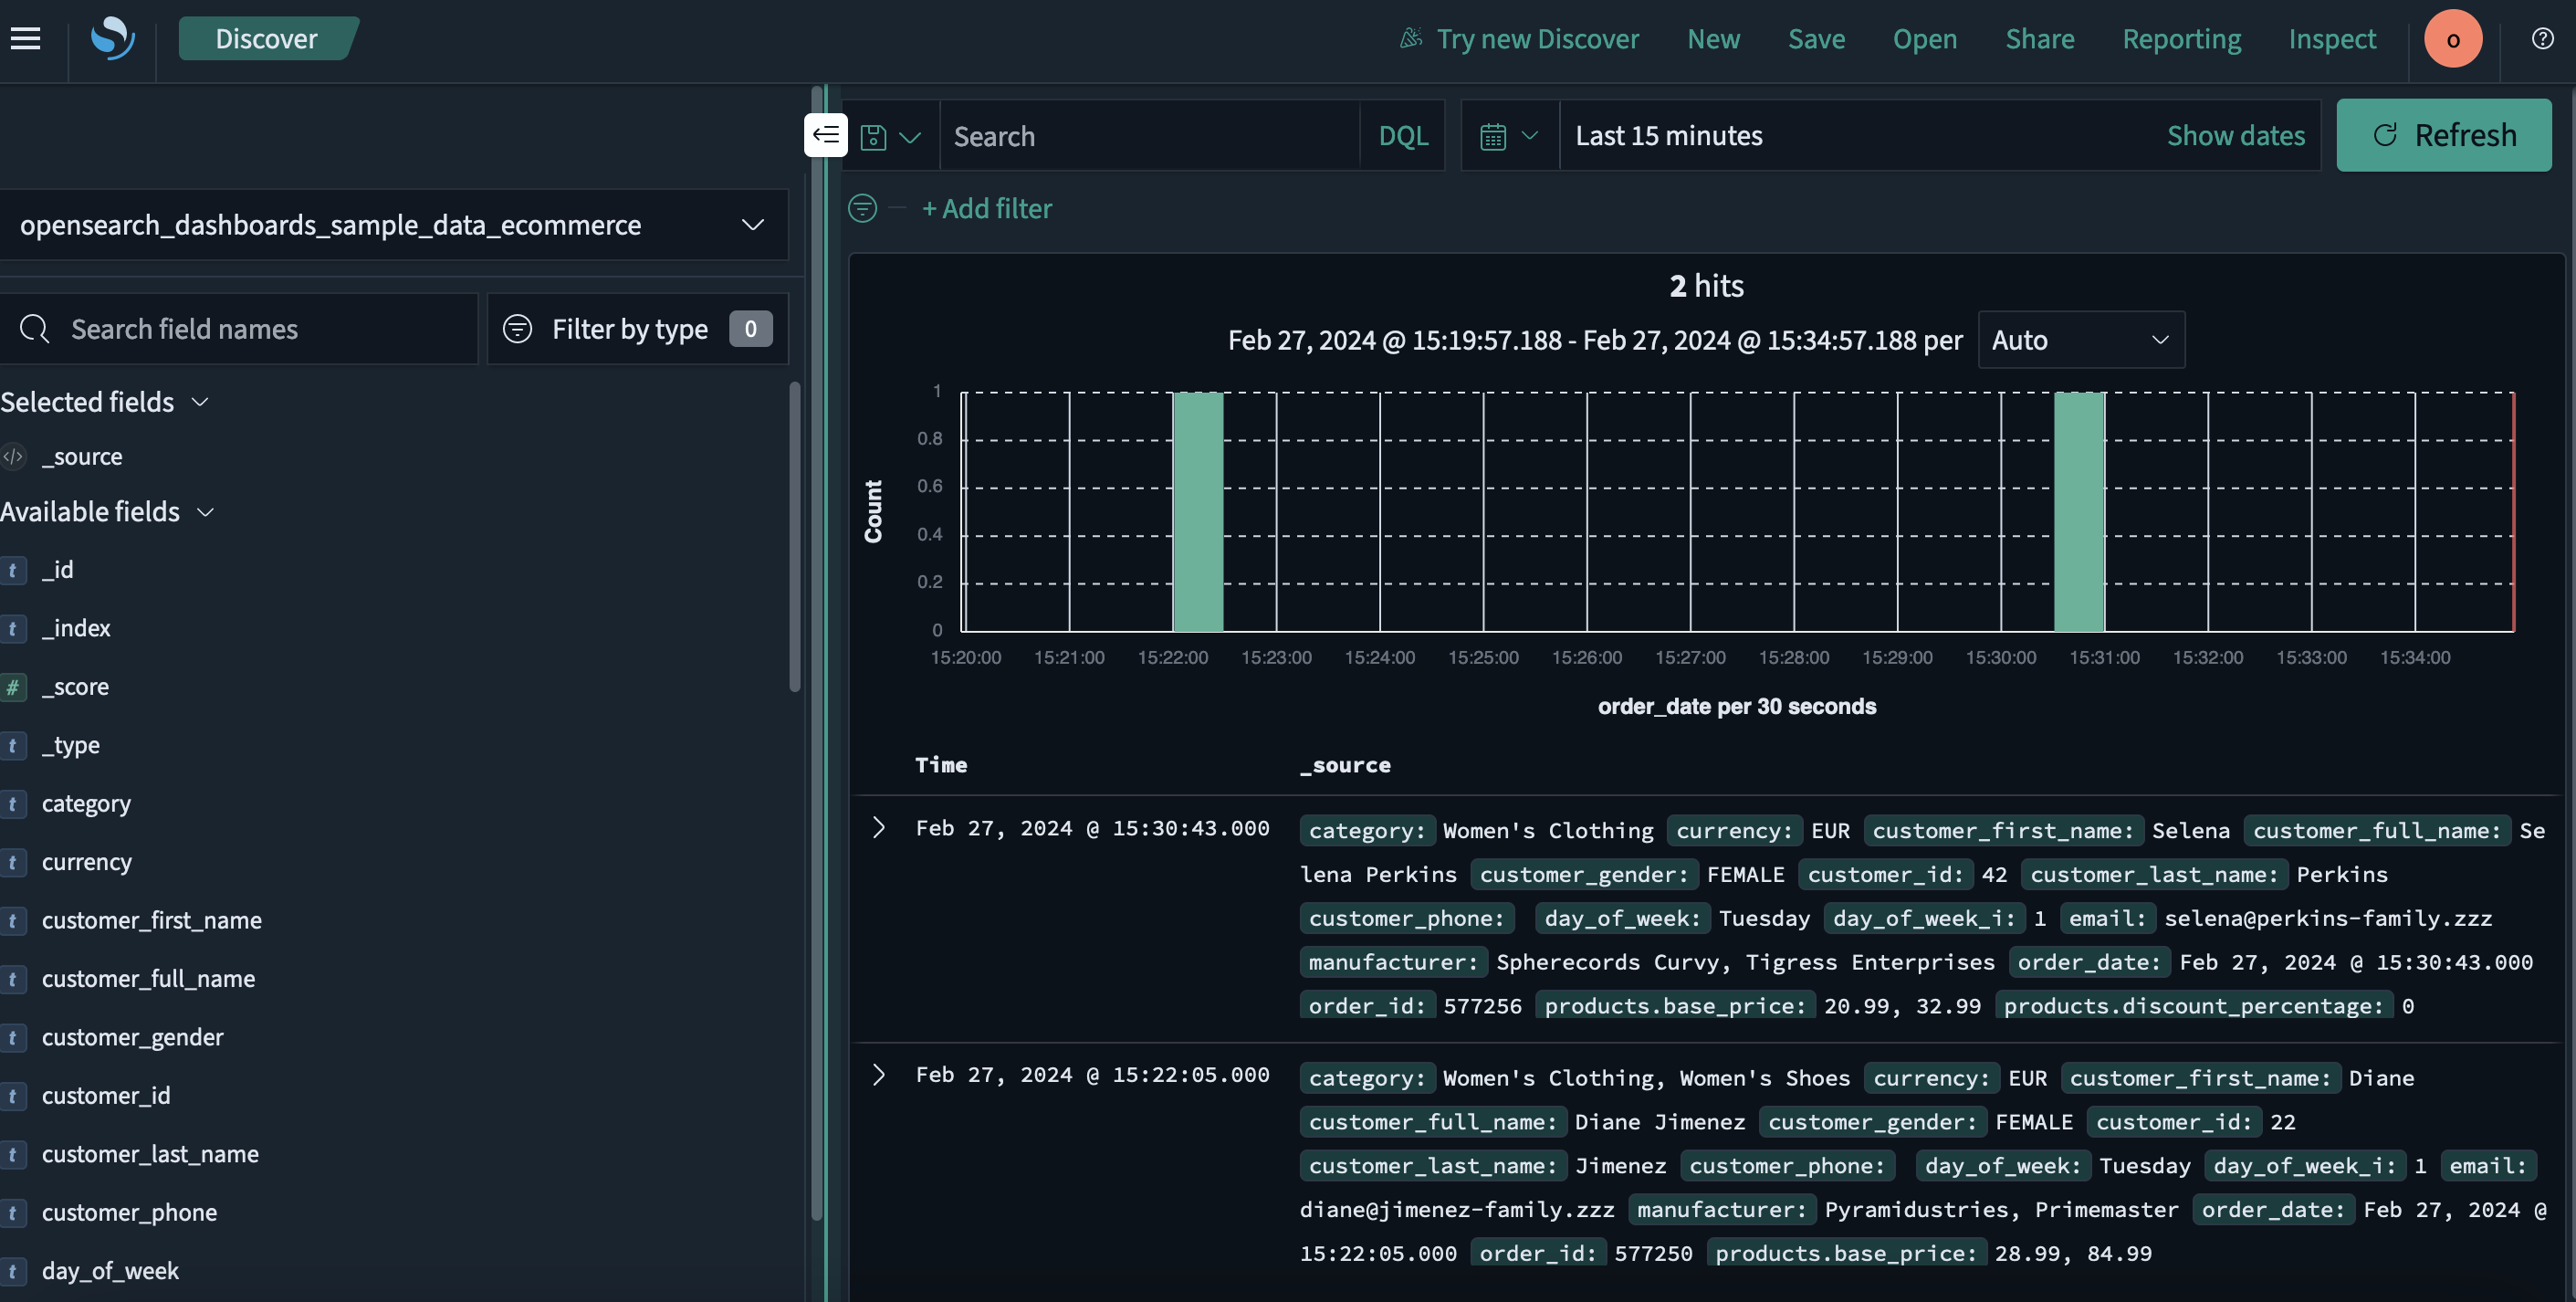
Analyzing data
To analyze your data in OpenSearch and visualize key metrics, you can use the Discover application in OpenSearch Dashboards. An example of data analysis in Discover is shown in the following image.
Getting started
In this tutorial, you’ll learn about using Discover to:
- Add data.
- Interpret and visualize data.
- Share data findings.
- Set alerts.
Before getting started, make sure you:
- Install OpenSearch Dashboards.
- Add sample data or import your own data into OpenSearch. Go to the OpenSearch Dashboards quickstart guide to learn about adding sample datasets. Go to Managing indexes to learn about importing your own data.
- Have a foundational understanding of OpenSearch documents and indexes.
Defining the search
To define a search, follow these steps:
- On the OpenSearch Dashboards navigation menu, select Discover.
- Choose the data you want to work with. In this case, choose
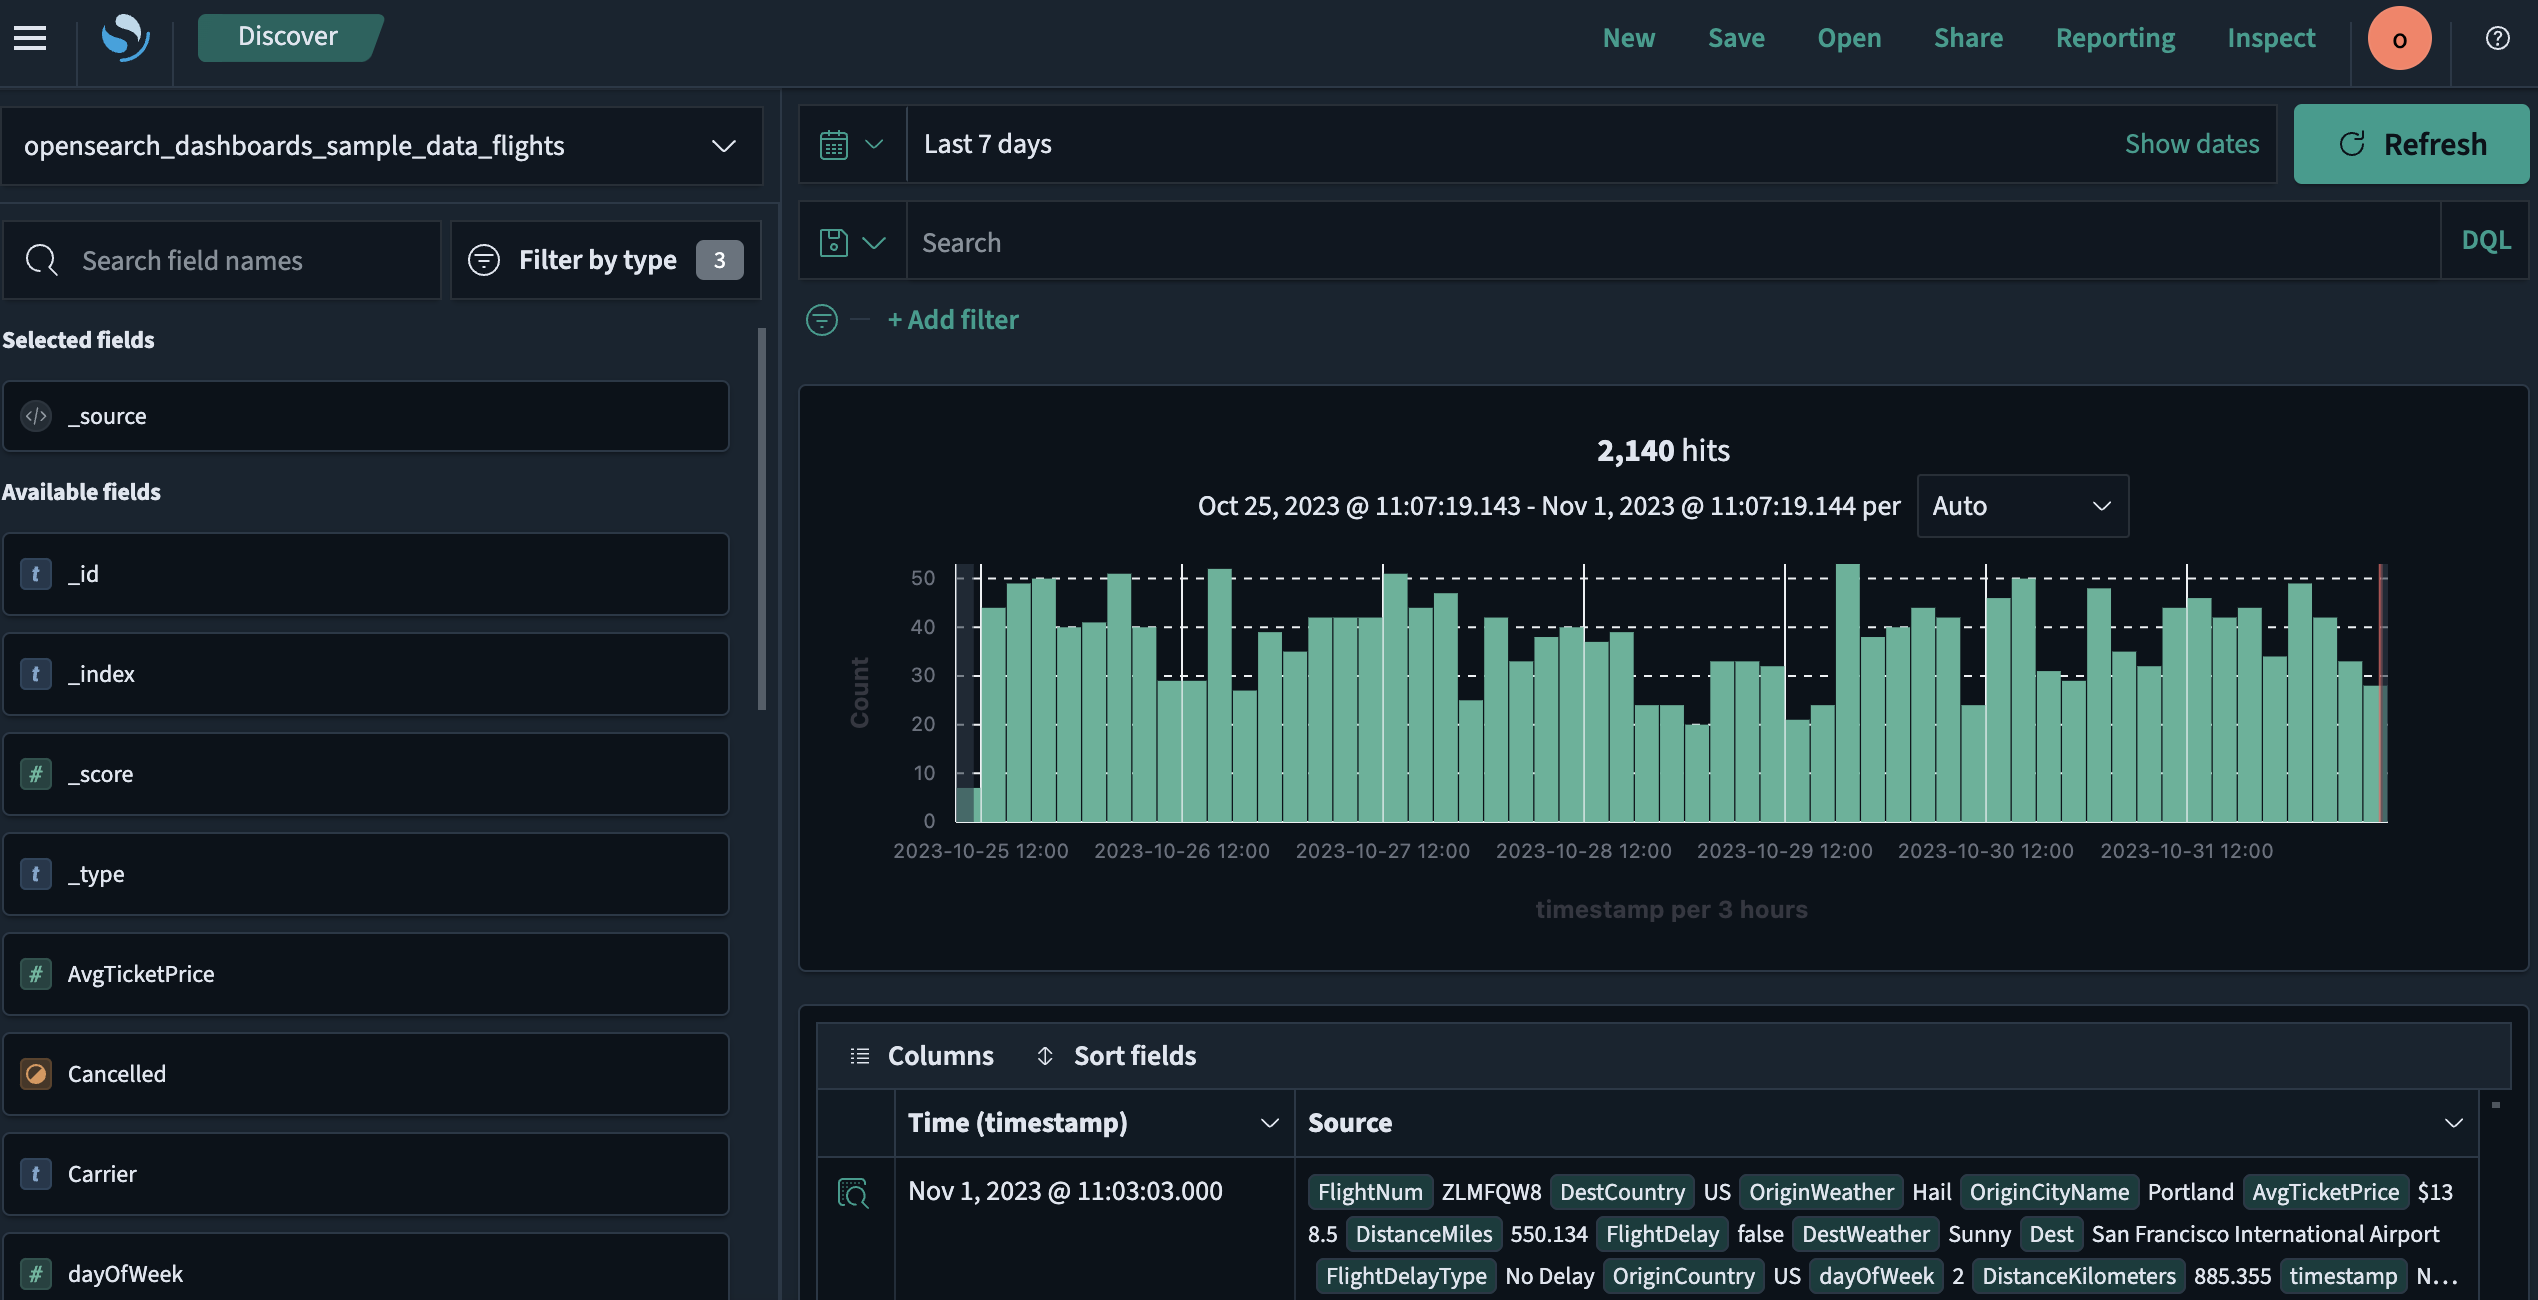
opensearch_dashboards_sample_data_flightsfrom the upper-left dropdown menu. - Select the
 icon to change the time range of your search and then select Refresh.
The resulting view is shown in the following image.
Analyzing document tables
In OpenSearch, a document table stores unstructured data. In a document table, each row represents a single document, and each column contains document attributes.
To examine document attributes, follow these steps:
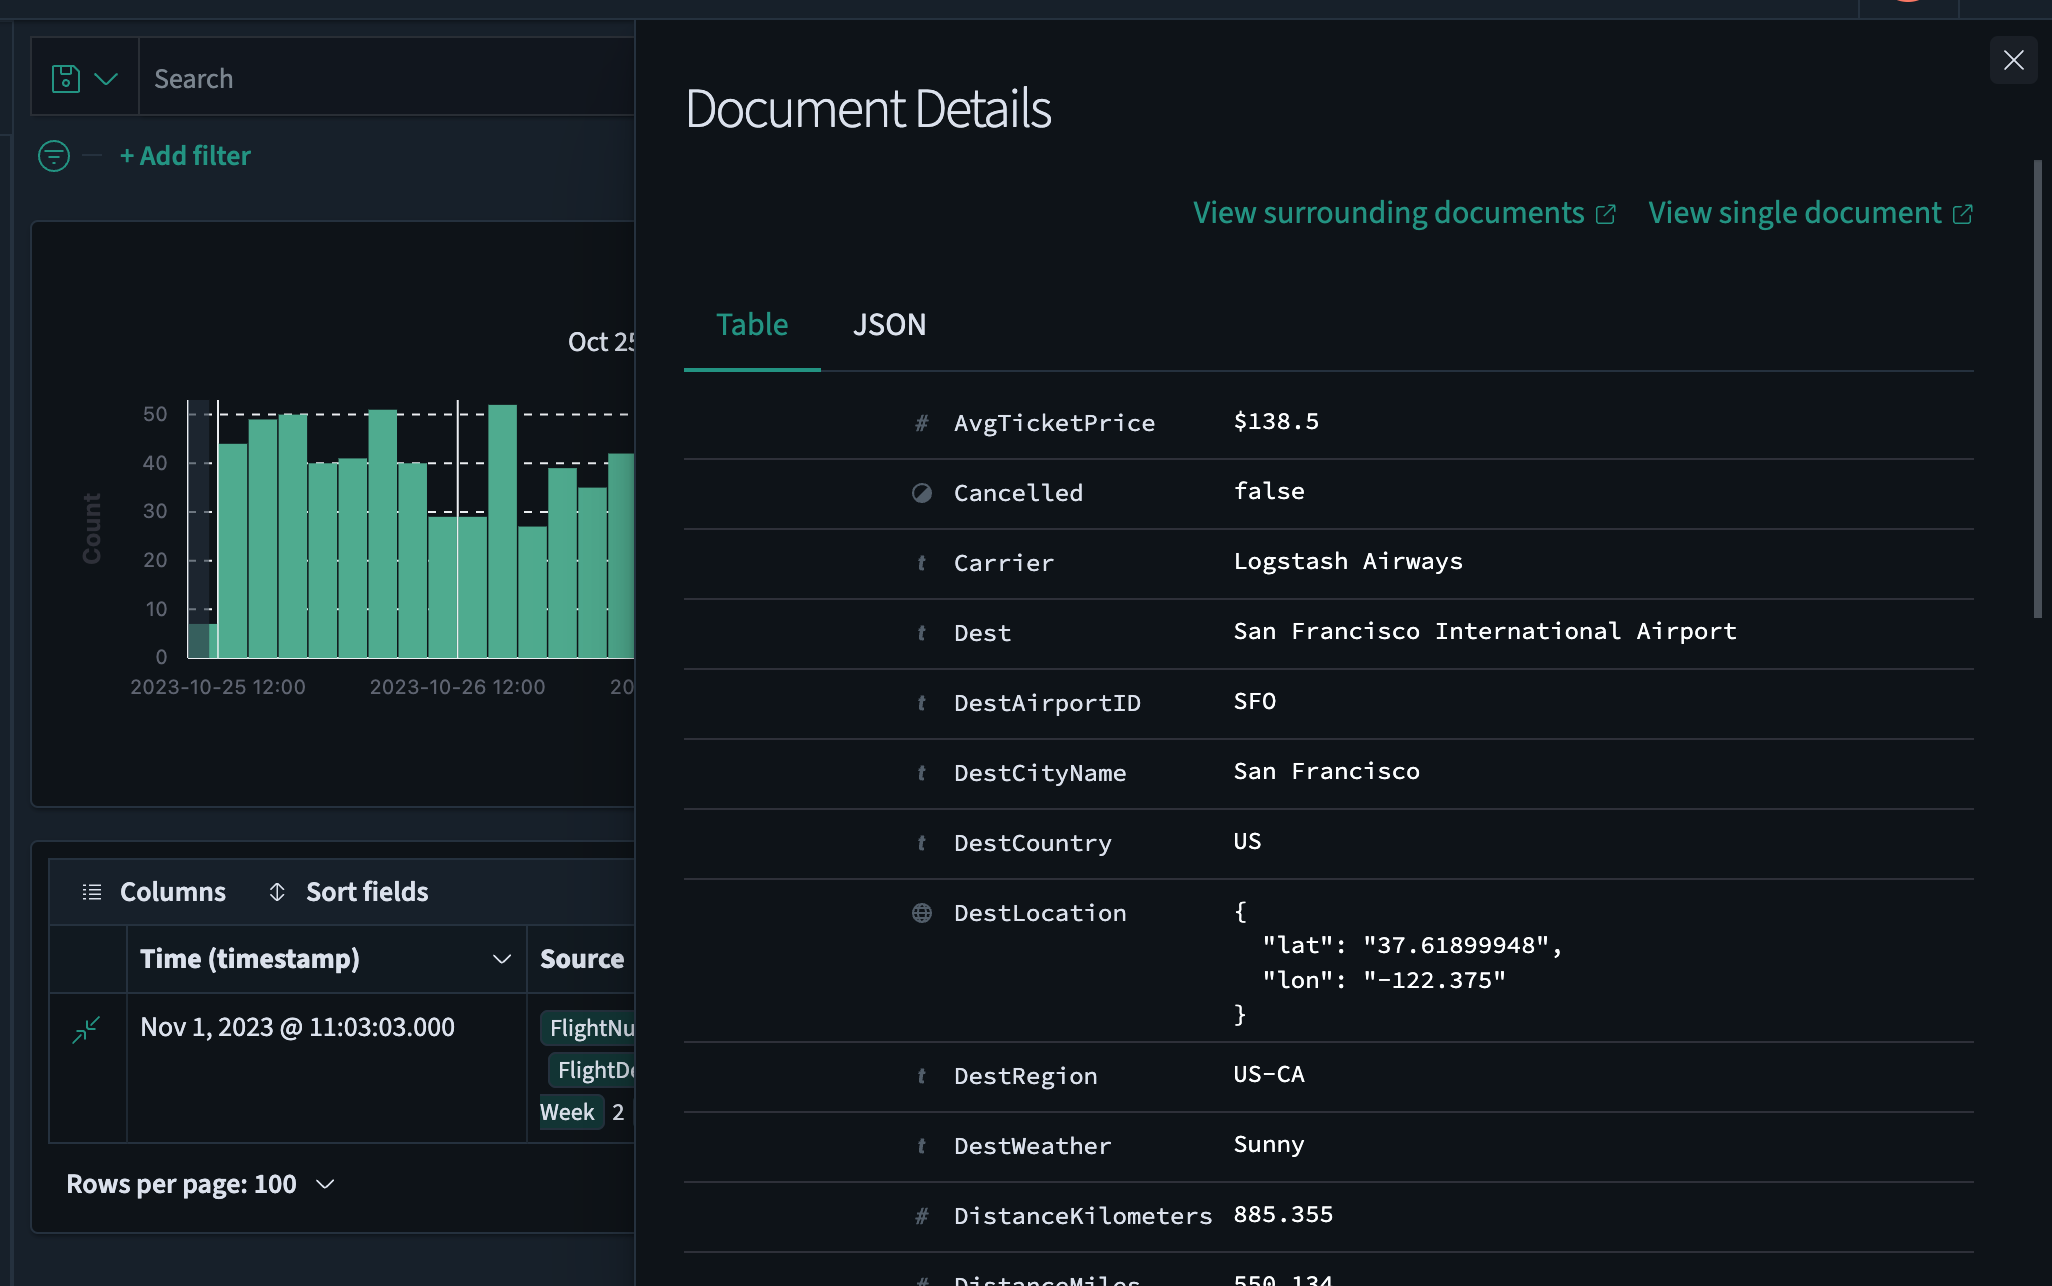
- From the data table’s left column, choose the
 icon to open the Document Details window. Select the
  icon to close the Document Details window.
 - Examine the metadata. You can switch between the Table and JSON tabs to view the data in your preferred format.
- Select View surrounding documents to view data for other log entries either preceding or following your current document or select View single document to view a particular log entry.
The resulting view is shown in the following image.
To add or delete fields in a document table, follow these steps:
- View the data fields listed under Available fields and select the
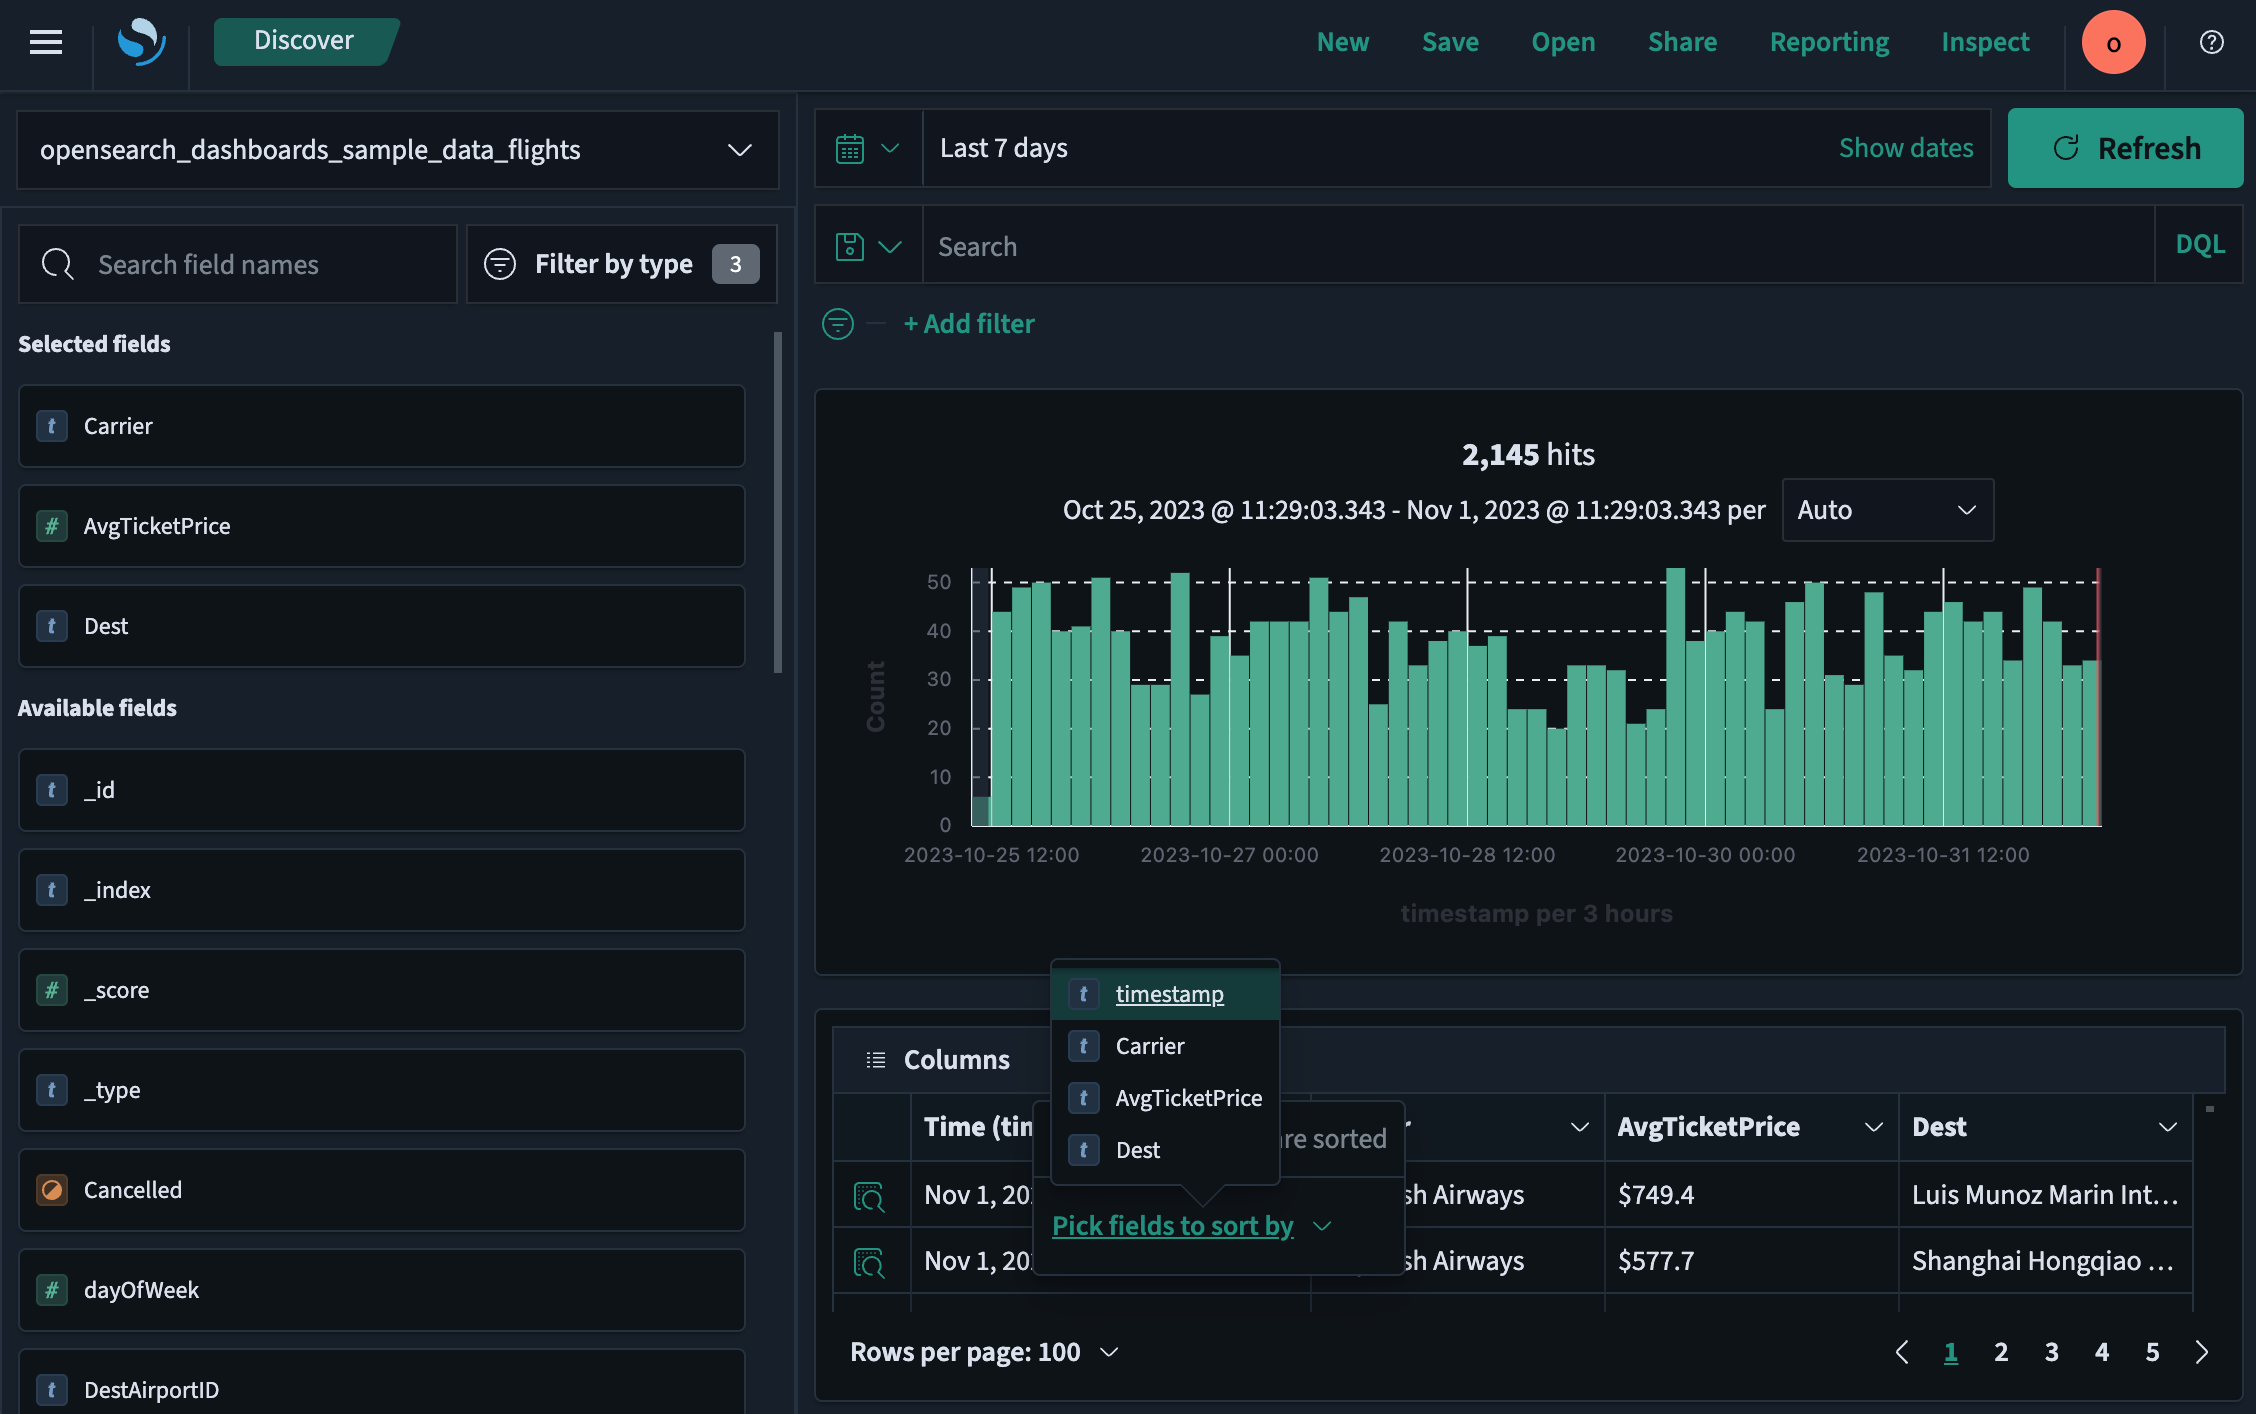
 icon to add the desired fields to the document table. The field will be automatically added to both Selected fields and the document table. For this example, choose the fields
 Carrier,AvgTicketPrice, andDest. - Select Sort fields > Pick fields to sort by. Drag and drop the chosen fields in the desired sort order.
The resulting view is shown in the following image.
Searching data
You can use the search toolbar to enter a DQL or query string query. The search toolbar is best for basic queries; for full query and filter capability, use query domain-specific language (DSL) in the Dev Tools console.
For more information, see Discover and Dashboard search toolbar.
Filtering data
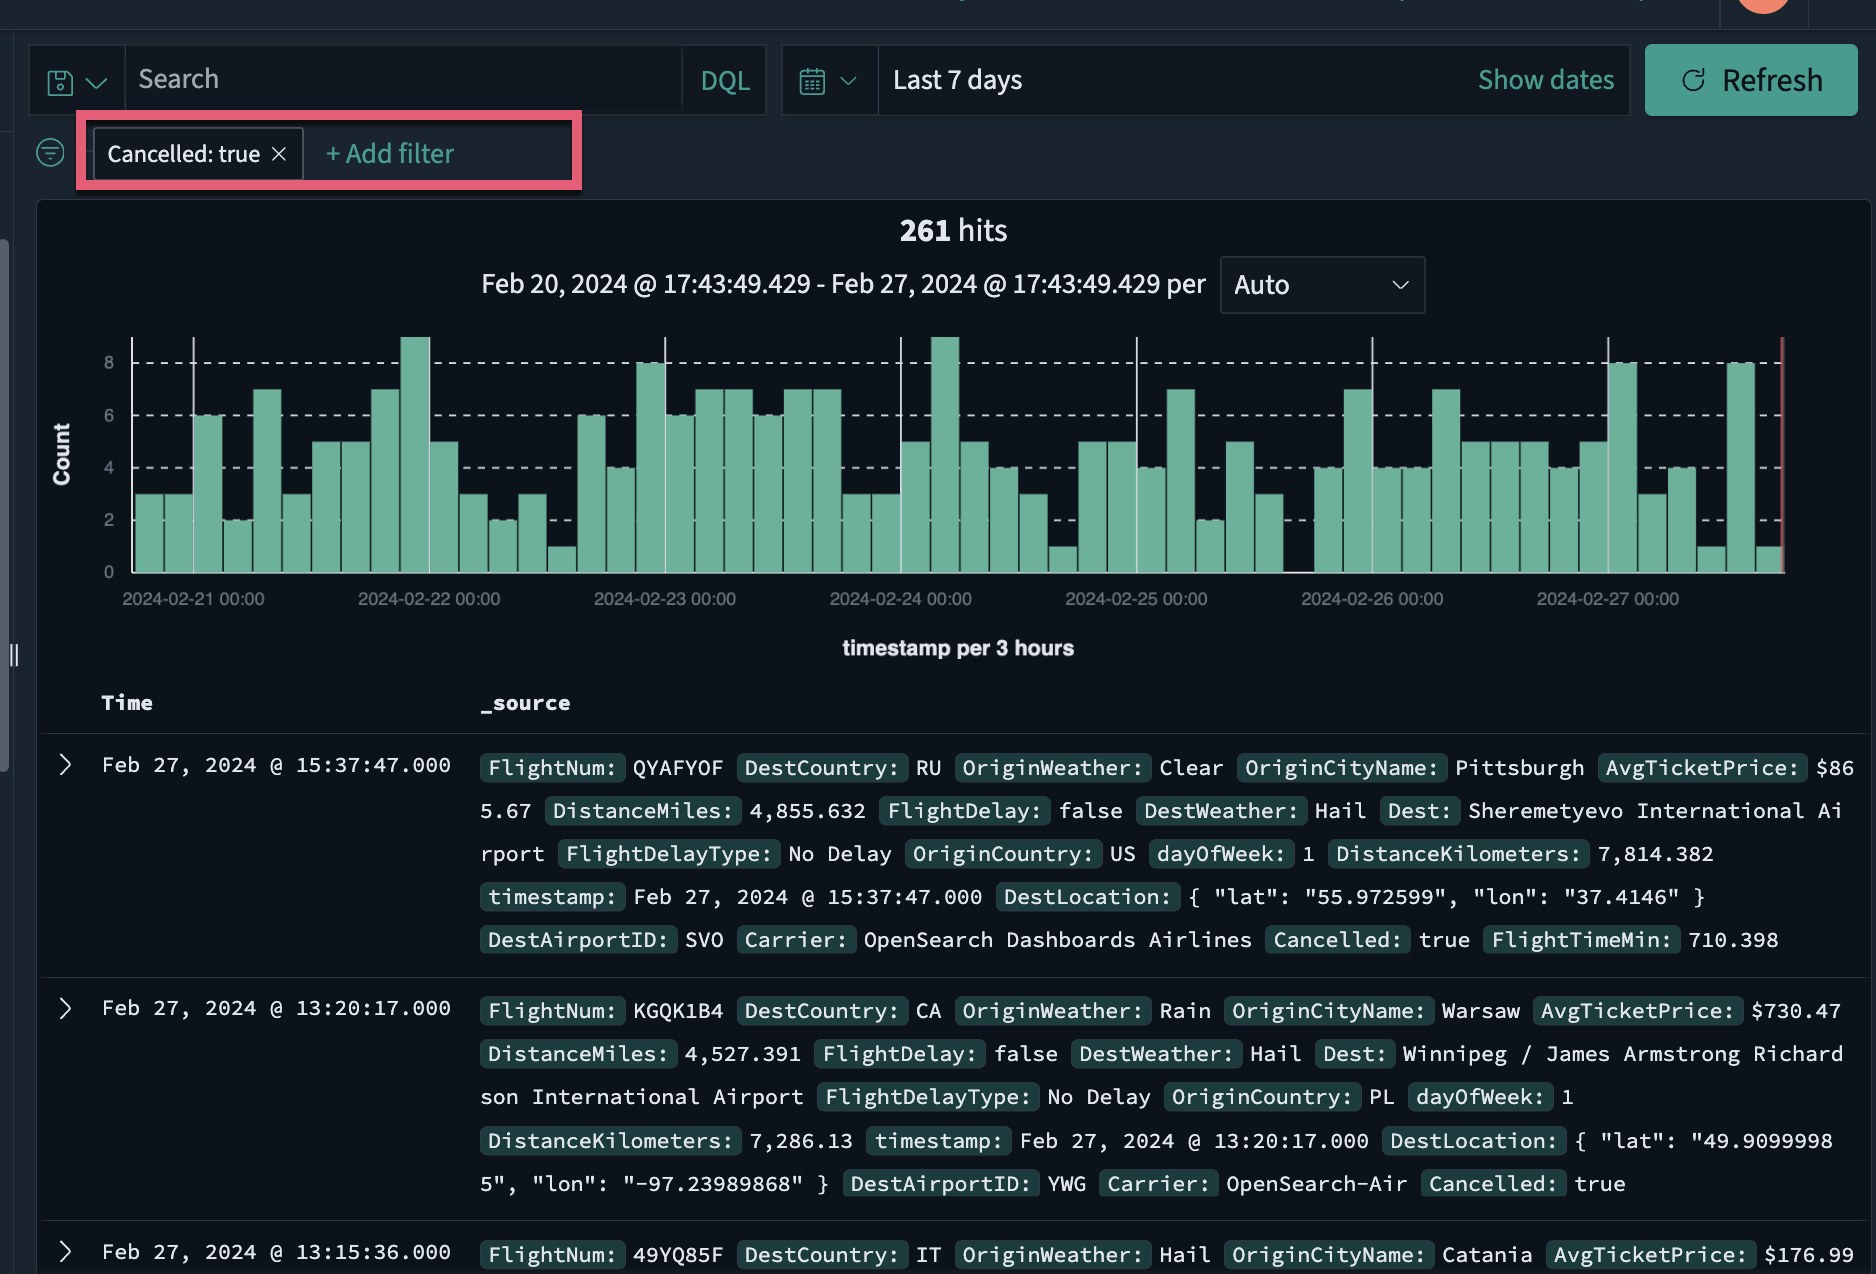
Filters allow you to narrow the results of a query by specifying certain criteria. You can filter by field, value, or range. The Add filter pop-up suggests the available fields and operators.
To filter your data, follow these steps:
- Under the DQL search bar, choose Add filter.
- Select the desired options from the Field, Operator, and Value dropdown lists. For example, select
Cancelled,is, andtrue. - Choose Save.
- To remove a filter, choose the
 icon to the right of the filter name.
The resulting view is shown in the following image.
Saving a search
To save your search, including the query text, filters, and current data view, follow these steps:
- Select Save on the upper-right toolbar.
- Add a title, and then choose Save.
- Select Open on the upper-right toolbar to access your saved searches.
Visualizing data findings
To visualize your data findings, follow these steps:
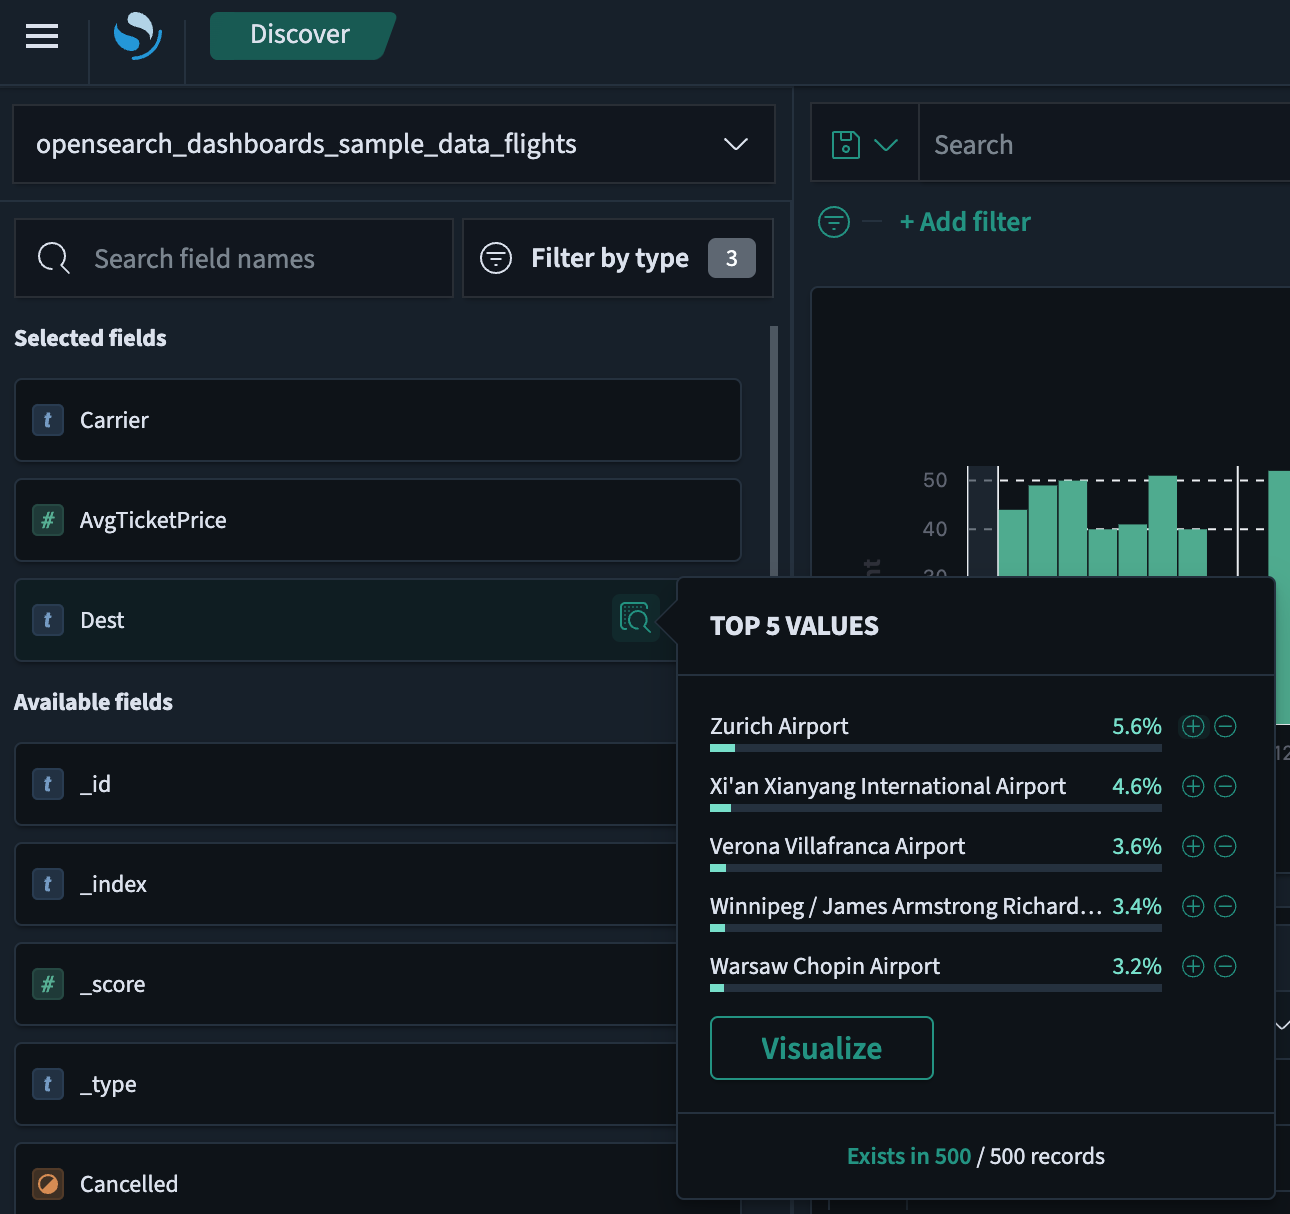
-
Select the
icon to the right of the field you want to visualize.The resulting view is shown in the following image.
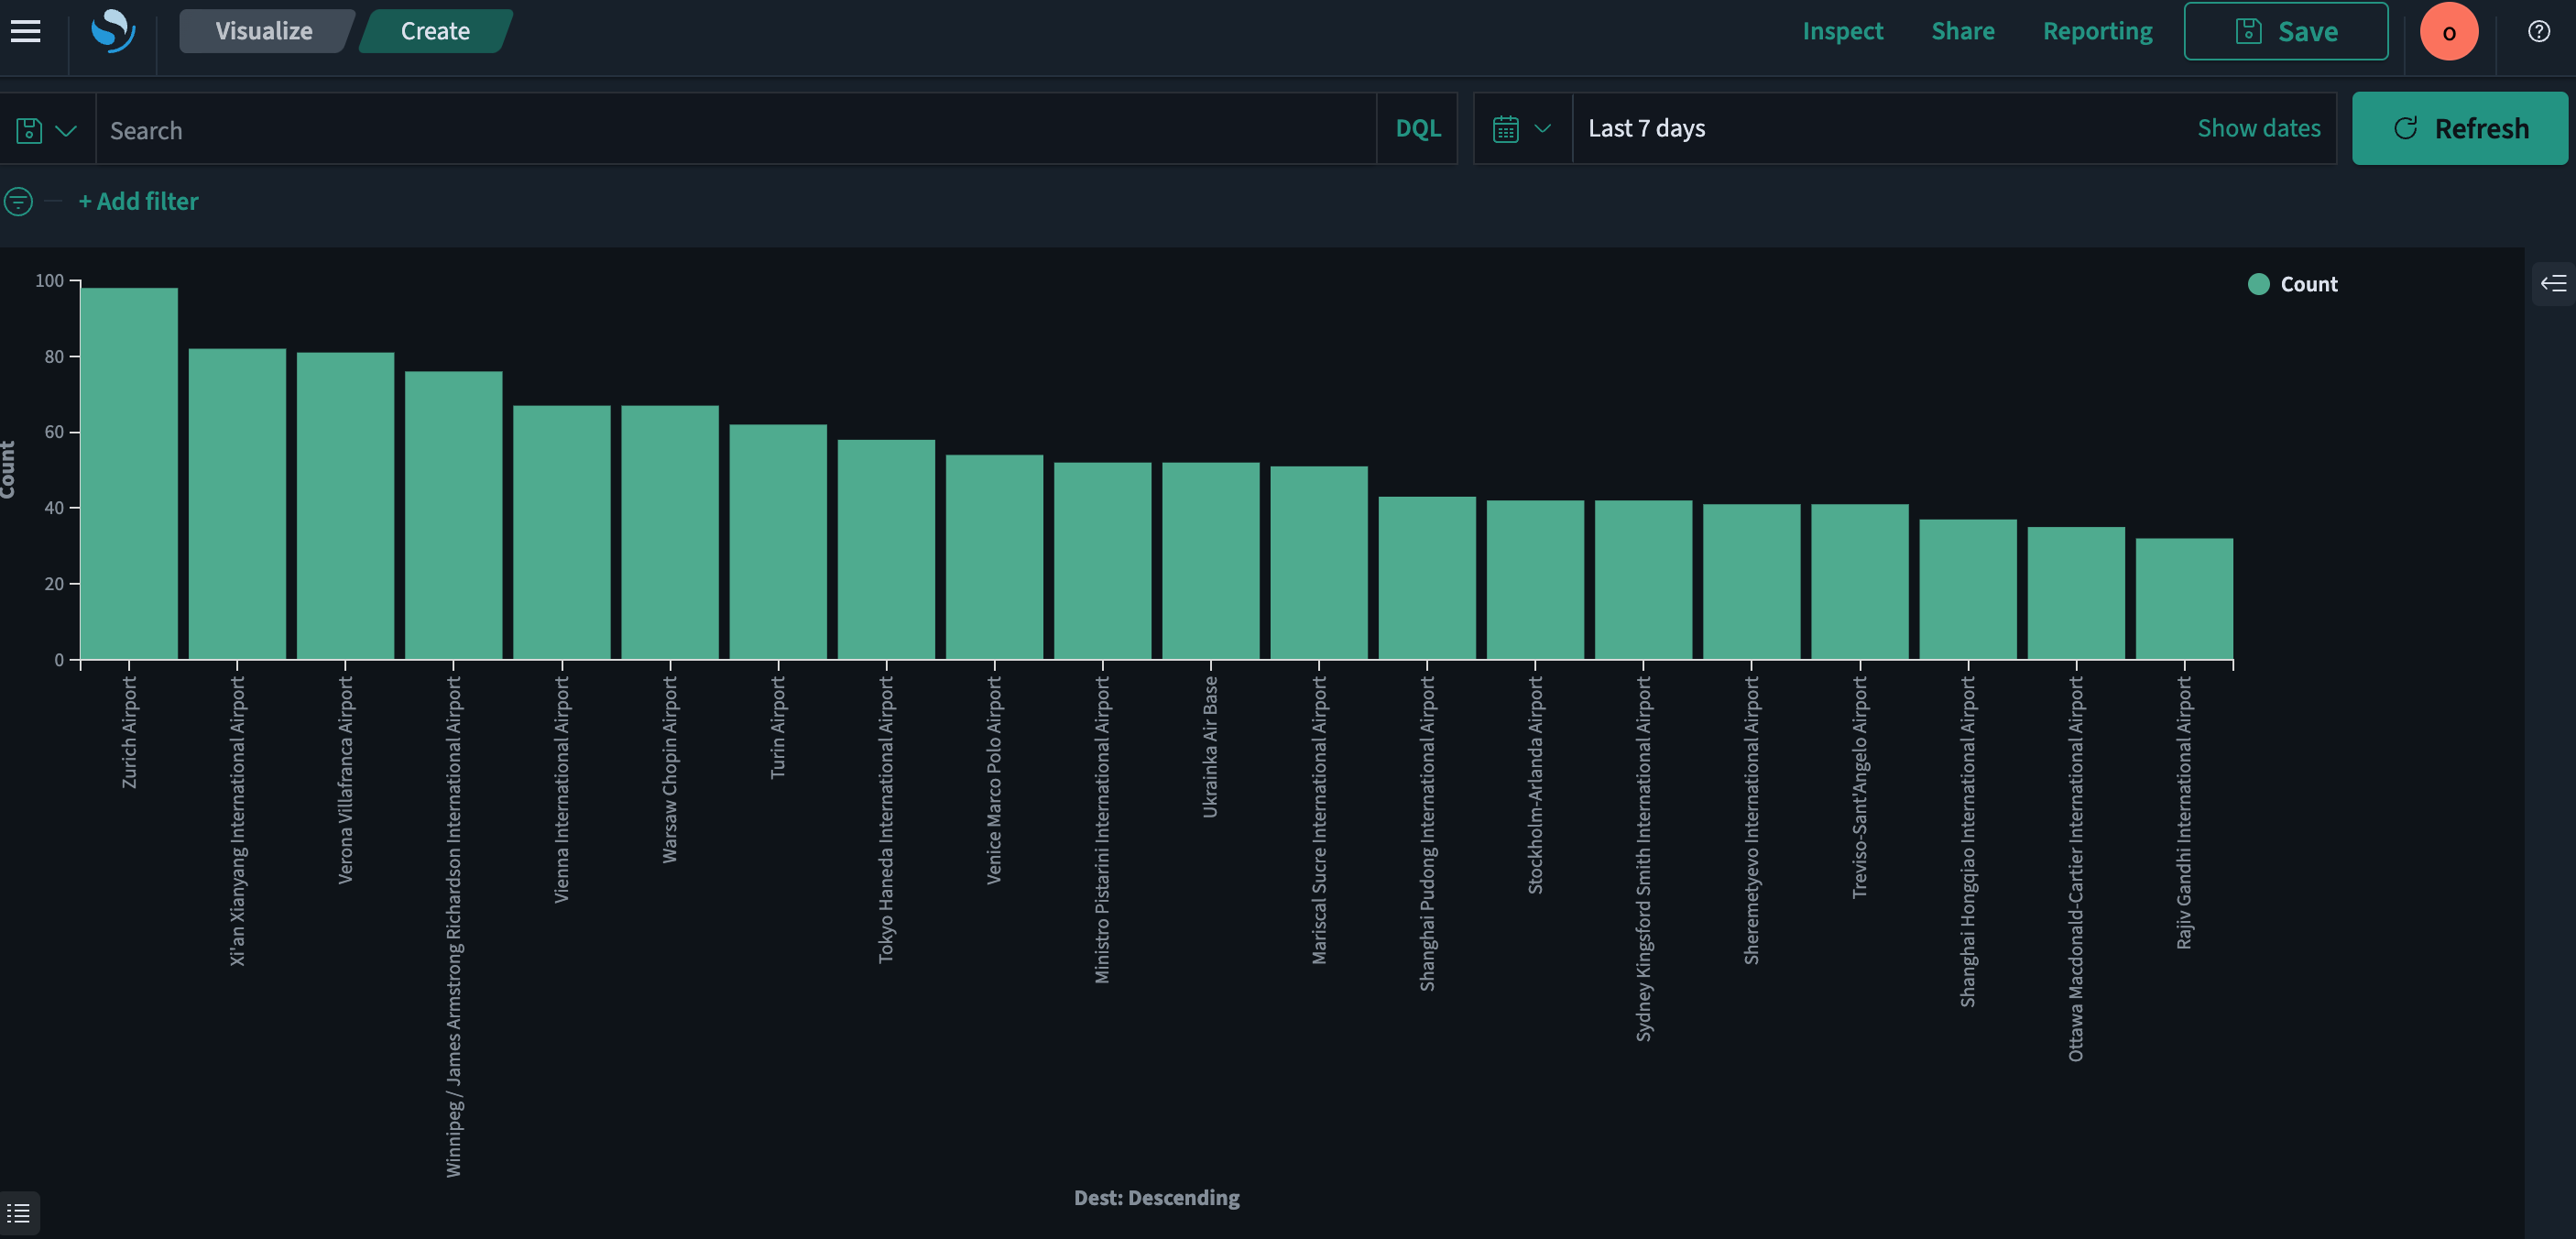
-
Select the Visualize button. When the Visualize application is launched, a visualization appears.
The resulting view is shown in the following image.
Setting alerts
Set alerts to notify you when your data exceeds your specified thresholds. Go to Alerting dashboards and visualizations to learn about creating and managing alerts.