The Overview page
When you select Security Analytics from the top menu, the Overview page is displayed. The Overview page consists of five sections:
- Findings and alert count
- Recent alerts
- Recent findings
- Most frequent detection rules
- Detectors
Each section provides a summary description for each element of Security Analytics, along with controls that let you take action for each item.
Overview and getting started
The upper portion of the Overview page contains two control buttons for refreshing information and getting started with Security Analytics. You can select the Refresh button to refresh all of the information on the page.
You can also select the Getting started link to expand the Get started with Security Analytics window, which includes a summary of the setup steps as well as control buttons that allow you to jump to any of the steps.
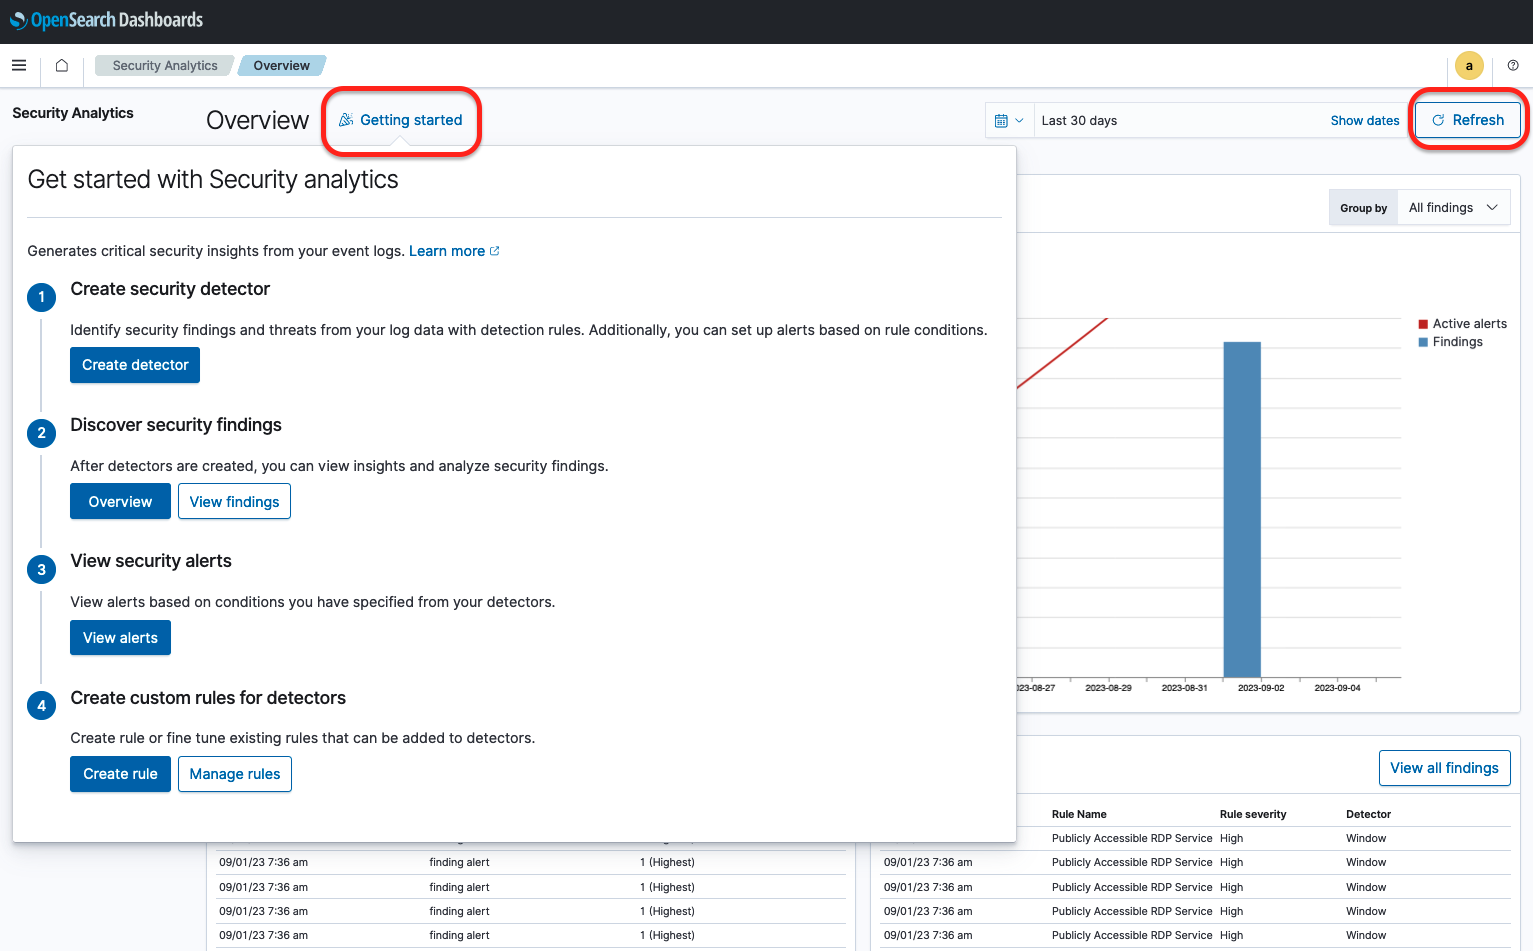
- In step 1 of setup, select Create detector to define a detector.
- In step 2, select View findings to go to the Findings page. For details about this page, see Working with findings.
- In step 3, select View alerts to go to the Security alerts page. For details about this page, see Working with alerts.
- In step 4, select Manage rules to go to the Rules page. For more on rules, see Working with rules.
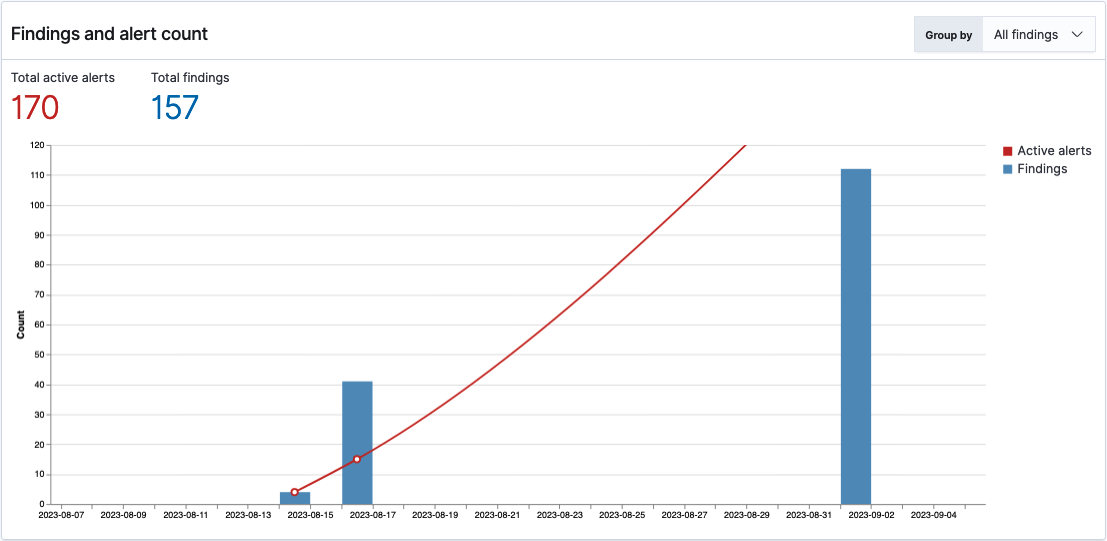
Findings and alert count
The Findings and alert count section provides a graph showing data on the latest findings. Use the Group by dropdown list to select either All findings or Log type.
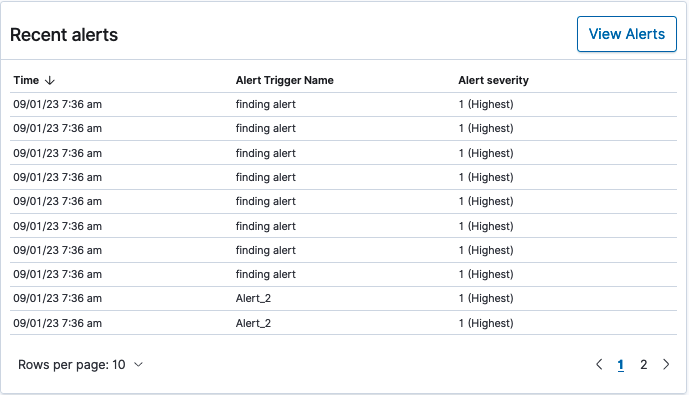
Recent alerts
The Recent alerts table displays recent alerts by time, trigger name, and alert severity. Select View alerts to go to the Alerts page.
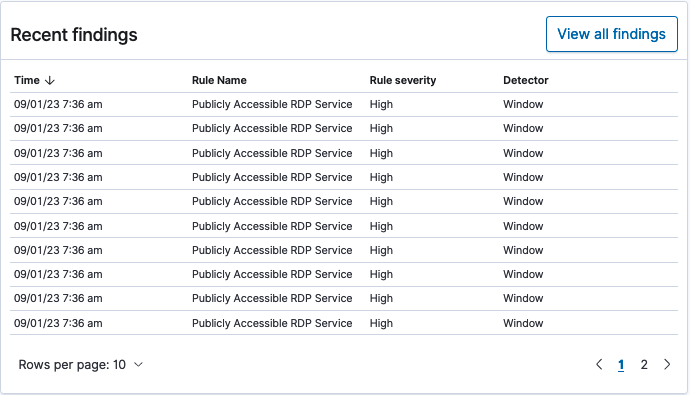
Recent findings
The Recent findings table displays recent findings by time, rule name, rule severity, and detector. Select View all findings to go to the Findings page.
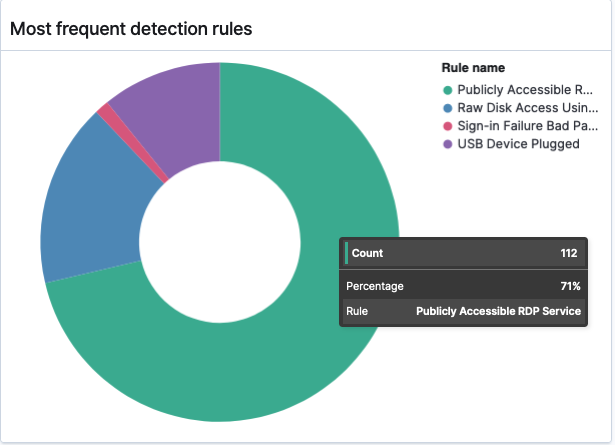
Most frequent detection rules
This section provides a graphical representation of detection rules that trigger findings most often and how they compare to others as a percentage of the whole. The rule names represented by the graph are listed to the right. You can hover over each color on the graph to see details about the detection rule it represents.
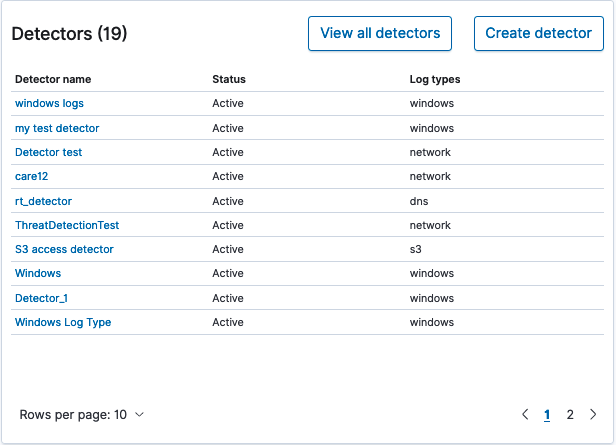
Detectors
The Detectors section displays a list of available detectors by detector name, status (active/inactive), and log type. Select View all detectors to go to the Detectors page. Select Create detector to go directly to the Define detector page.