OpenSearch is a community-driven, open-source search and analytics suite used by developers to ingest, search, visualize, and analyze data. Introduced in January 2021, the OpenSearch Project originated as an open-source fork of Elasticsearch 7.10.2. OpenSearch 1.0 was released for production use in July 2021 and is licensed under the Apache License, Version 2.0 (ALv2), with the complete codebase published to GitHub. The project has consistently focused on improving the performance of its core open-source engine for high-volume indexing and low-latency search operations. OpenSearch aims to provide the best experience for every user by reducing latency and improving efficiency.
In this blog post, we’ll share a comprehensive view of strategic enhancements and performance features that OpenSearch has delivered to date. Additionally, we’ll provide a look forward at the Performance Roadmap. We’ll compare the core engine performance of the latest OpenSearch version (OpenSearch 2.11) to the state just before the OpenSearch fork, with a specific focus on the advancements made since then. With this goal in mind, we have chosen Elasticsearch 7.10.2 to represent the baseline from which OpenSearch was forked, allowing us to measure all changes that have been delivered after the fork (in OpenSearch 1.0–2.11). These improvements were made in collaboration with the community; thus, the OpenSearch Project is actively seeking to enhance community engagement, specifically in the area of performance improvement.
Performance improvements to date
OpenSearch performance improvements can be categorized into three high-level buckets:
- Indexing performance
- Query performance
- Storage
The following image summarizes OpenSearch performance improvements since launch.
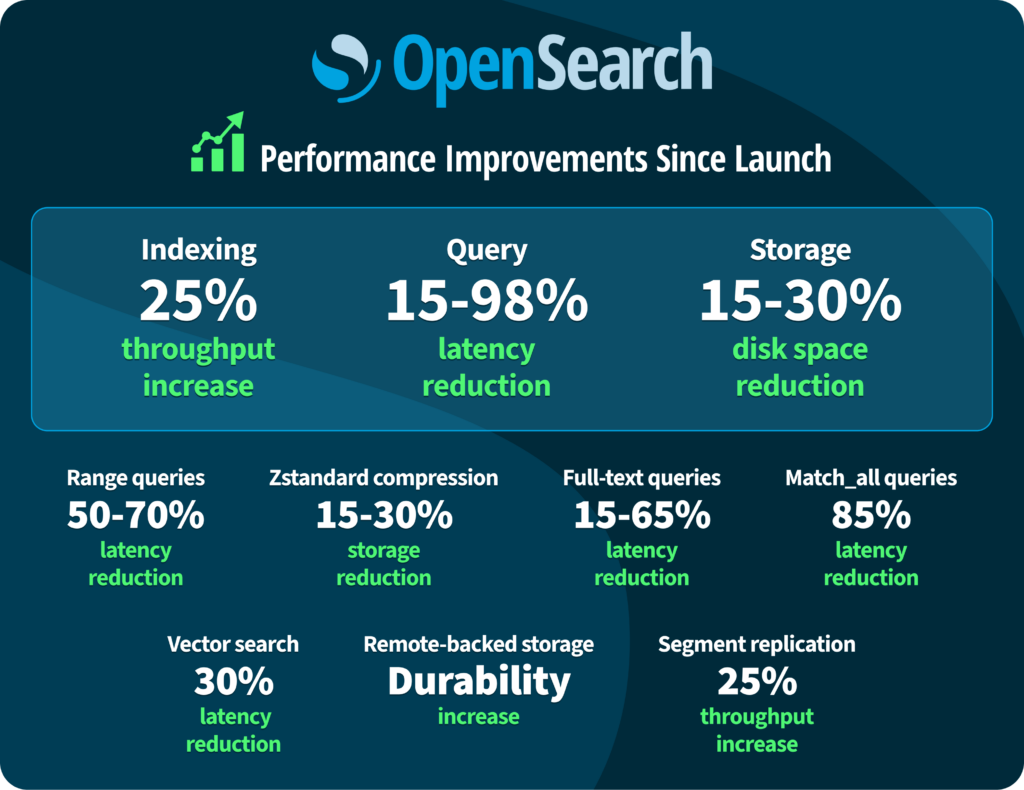
Log analytics workloads are typically indexing heavy, often relying on specific resource-intensive queries. In contrast, search workloads have a more balanced distribution between indexing and query operations. Based on the analysis we’ll detail below comparing Elasticsearch 7.10.2 to OpenSearch 2.11, we have seen a 25% improvement in indexing throughput, a 15–98% decrease in query latencies among some of the most popular query types, and, now with Zstandard compression, a 15–30% reduction in on-disk data size.
Indexing performance investments
Some of the key OpenSearch features launched this year delivered efficiency improvements in indexing performance. OpenSearch rearchitected the way indexing operations are performed in order to deliver segment replication—a physical replication method that replicates index segments rather than source documents. Segment replication, a new replication strategy built on Lucene’s Near-Real-Time (NRT) Segment Index Replication API, was released as generally available in OpenSearch 2.7. Segment replication showed increased ingestion rate throughput of up to 25% when compared to default document replication. You can find a more detailed look at segment replication in this blog post.
In version 2.10, OpenSearch introduced remote-backed storage, allowing users to directly write segments to object storage, such as Amazon Simple Storage Service (Amazon S3) or Oracle Cloud Infrastructure (OCI) Object Storage, to improve data durability. With remote-backed storage, in addition to storing data on a local disk, all the ingested data is stored in the configured remote store. At every refresh, the remote store also automatically becomes a point-in-time recovery point, helping users achieve a recovery point objective (RPO) of zero with the same durability properties of the configured remote store. To learn more, see this blog post.
Query performance investments
OpenSearch supports an extensive array of query types for different use cases, from comprehensive search capabilities to a broad spectrum of aggregations, filtering options, and sorting functionalities. One of the major query performance areas in which OpenSearch has improved is in helping vector queries perform at scale, given the rise in vector search popularity. OpenSearch’s vector engine offers fast, billion-scale vector searches with efficient latency and recall.
Recent additions like scalar and product quantization reduced the cluster memory footprint by up to 80%. The incorporation of native libraries (nmslib and faiss) and HNSW with SIMD instructions has expedited vector indexing and search queries. At a large scale, tested with billions of documents, OpenSearch delivered a roughly 30% lower latency compared to Lucene ANN searches. For more information, see this partner highlight.
We’ve also continued to invest broadly in core query performance for popular query types used for log analytics, time-series data, and search. OpenSearch has demonstrated significant improvement since the fork from Elasticsearch 7.10.2 for many query types. The benchmarking we performed showed a 15%–98% increase in performance across popular query operations such as match all, range queries, aggregation queries, and full-text queries. You can review key benchmarking findings in the following sections.
Storage investments
Storage is another major factor that affects the overall efficiency of log analytics and search workloads. In OpenSearch 2.9 and later, customers can use Zstandard compression, resulting in a 30% reduction in on-disk data size while maintaining a near-identical CPU utilization pattern compared to the default compression. Some of the ongoing work, such as the addition of a match_only_text field (see #11039), has shown a promising reduction of about 25% in data on disk, primarily with text data field optimization, and should be available to users in the upcoming OpenSearch 2.12 release.
Measured performance improvements
To compare performance between Elasticsearch 7.10.2 and OpenSearch 2.11, we ran query operations for widely used scenarios in log analytics, time series, and search. We ran the queries across clusters running each version and documented the resulting performance. The following subsections provide the key findings from this exercise.
Log analytics
For log analytics use cases, we used the http_logs workload from OpenSearch Benchmark—a macro-benchmark utility within the OpenSearch Project—to replicate some of the common query operations. Here are the key highlights:
match_allqueries with sorting showed a more than 20x performance boost across the board because of multiple improvements made in the area (see #6321 and #7244) and other Lucene enhancements.- Queries for ascending and descending sort-after-timestamp saw a significant performance improvement of up to 70x overall. The optimizations introduced (such as #6424 and #8167) extend across various numeric types, including
int,short,float,double,date, and others. - Other popular queries, such as
search_after, saw about a 60x reduction in latency, attributed to the improvements made in the area involving optimally skipping segments during search (see #7453). Thesearch_afterqueries can be used as the recommended alternative to scroll queries for a better search experience. - Implementation support for
match_only_textfield optimization on storage and indexing/search latency for text queries is in progress (see #11039).
Time series
In the context of aggregations over range and time-series data, we used the nyc_taxis and http_logs workloads from OpenSearch Benchmark to benchmark various popular use cases. Here are the key highlights:
- Range queries, popular for aggregation use cases, exhibited about a 50%–75% improvement, attributed to system upgrades such as Lucene (from v8.8 in Elasticsearch 7.10.2 to v9.7 in OpenSearch 2.11) and JDK (from JDK15 in Elasticsearch 7.10.2 to JDK17 in OpenSearch 2.11).
- Hourly aggregations and multi-term aggregations also demonstrated improvement, varying from 5% to 35%, attributed to the time-series improvements discussed previously.
date_histogramsanddate_histogram_aggqueries exhibited either comparable or slightly decreased performance, ranging from 5% to around 20% in multi-node environments. These issues are actively being addressed as part of ongoing project efforts (see #11083).- For date histogram aggregations, there are upcoming changes aiming to improve performance by rounding down dates to the nearest interval (such as year, quarter, month, week, or day) using SIMD (see #11194).
Search
In the realm of text queries, we used pmc workloads from OpenSearch Benchmark to emulate various common use cases. Here are the noteworthy highlights:
- Phrase and term queries for text search showed improved latency, with a 25% to 65% reduction, underscoring their improved effectiveness.
- Popular queries related to scrolling exhibited about 15% lower latency, further improving the overall user experience.
Additional optional performance-enhancing features available in version 2.11
The core engine optimizations discussed in the previous sections are available by default. Additionally, OpenSearch 2.11 includes a few key performance-enhancing features that can be optionally enabled by users. These features were not available in prior versions, so we separately benchmarked performance with those features individually enabled, resulting in the following findings:
- LogByteSize merge policy: Showed a 40–70% improvement in ascending and descending sort queries, which is advantageous for time-series data with timestamp sorting and minimal timestamp overlap between segments.
- Zstandard compression: This addition empowers OpenSearch users with the new Zstandard compression codecs for their data, resulting in a 30% reduction in on-disk data size while maintaining a near-identical CPU utilization pattern compared to the default compression.
- Concurrent segment search: Enabling every shard-level request to concurrently search across segments during the query phase resulted in latency reduction across multiple query types. Aggregate queries showed a 50%–70% improvement, range queries showed a 65% improvement, and aggregation queries with hourly data aggregations showed a 50% improvement.
Future roadmap
The OpenSearch Project remains steadfast in its commitment to continuously improving the core engine performance in search, ingestion, and storage operations. The OpenSearch Project roadmap on GitHub is constantly evolving, and we are excited to share it with you. This roadmap places a special emphasis on the core engine advancements while also encompassing critical areas like benchmarking and query visibility. As part of our ongoing commitment, we plan to consistently update this roadmap with both short- and long-term improvement plans. We’re keeping performance excellence at the forefront of our investments, and OpenSearch users can anticipate a series of impactful improvements in new releases in 2024, starting with OpenSearch 2.12.
In the upcoming releases, we will continue to improve the core engine by targeting specific query types. We will also undertake broad strategic initiatives to further enhance the core engine through Protobuf integration, query rewrites, tiered caching, and SIMD and RUST implementations. In addition to improving the core engine, we are committed to improving OpenSearch tooling capabilities. One such improvement that we’re currently working on is the query insights functionality, which helps identify the top N queries that impact performance. Additionally, OpenSearch is working on making benchmarks easier for community members to use. For a comprehensive list of investments and additional improvements, or to provide feedback, please check out the OpenSearch Performance Roadmap on GitHub.
This concludes the main summary of OpenSearch performance improvements to date. The following appendix sections provide the benchmarking details for readers interested in replicating any run.
Appendix: Detailed execution and results
If you’re interested in the details of the performance benchmarks we used, exploring the methodologies behind their execution, or examining the comprehensive results, keep reading. For OpenSearch users interested in establishing benchmarks and replicating these runs, we’ve provided comprehensive setup details alongside each result. This section provides the core engine performance comparison between the latest OpenSearch version (OpenSearch 2.11) and the state just before the OpenSearch fork, Elasticsearch 7.10.2, with a mid-point performance measurement on OpenSearch 2.3.
OpenSearch Benchmark and workloads
OpenSearch Benchmark serves as a macro-benchmark utility within the OpenSearch Project. With the help of this tool, OpenSearch users and developers can generate and visualize performance metrics from an OpenSearch cluster for various purposes, including:
- Monitoring the overall performance of an OpenSearch cluster.
- Evaluating the benefits of and making decisions about upgrading the cluster to a new version.
- Assessing the potential impact on the cluster resulting from changes to the workflows, such as modifications to the index mappings or changes in queries.
The OpenSearch Benchmark workloads are comprised of one or multiple benchmarking scenarios. A workload typically includes the ingestion of one or more data corpora into indexes and a collection of queries and operations that are executed as a part of the benchmark.
We used the following workloads for performance evaluation, encompassing aspects such as text/term queries, sorting, aggregations, histograms, and ranges:
- HTTP logs workload: This workload is based on web server logs from the 1998 Football World Cup. It is used for evaluating the performance of (web) server logs, which is most in line with the OpenSearch log analytics use case.
- NYC taxis workload: This workload contains the rides taken in yellow taxis in New York in 2015. It is used for evaluating the performance of highly structured data. It is useful for aggregation and date histogram use cases for time-series data.
- PMC workload: This workload contains data retrieved from PubMed Central (PMC). It is used for evaluating the performance of full-text search, in line with the OpenSearch search use case.
The configurations specific to the setup for each evaluation are provided along with the results in the following sections.
Comparative baseline analysis: Elasticsearch 7.10.2 vs. OpenSearch 2.3 vs. OpenSearch 2.11
We compared the performance of Elasticsearch 7.10.2 (pre-fork), OpenSearch 2.3 (an interim release), and OpenSearch 2.11 (latest version at the time of testing). This analysis covers three workloads (http-logs, nyc-taxis, and pmc) used to assess performance across different use cases. The goal is to provide comparable core engine performance metrics since the Elasticsearch 7.10.2 fork. The benchmarks in the following sections show averages from 7 days of data, generated during nightly runs using OpenSearch Benchmark, intentionally excluding outliers. In the detailed results section, each table contains a percentage improvement column. This column emphasizes the improvements to OpenSearch 2.11 over the previous releases, with positive values indicating improvement and negative values indicating regression.
Detailed results: Elasticsearch 7.10.2 vs. OpenSearch 2.3 vs. OpenSearch 2.11—deep dive into single-shard performance
Objective: To eliminate variables introduced at the coordination level and concentrate on data node query performance.
Setup: 1 data node (r5.xlarge) with 32 GB RAM and 16 GB heap. Index settings: 1 shard and 0 replicas.
http_logs workload results: The following table provides a benchmark comparison for the http_logs workload between Elasticsearch 7.10.2, OpenSearch 2.3, and OpenSearch 2.11. It includes the 90th percentile of took time latency measurements for each (p90) and the observed percentage improvements.
| Operations | ES 7.10.2 (p90_value) | OS 2.3.0 (p90_value) | OS 2.11.0 (p90_value) | OS 2.11.0 improvement (vs. OS 2.3.0) | OS 2.11.0 improvement (vs. ES 7.10.2) |
|---|---|---|---|---|---|
200s-in-range | 13 | 5 | 5.33 | -7% | 59% |
400s-in-range | 2.73 | 2 | 2.53 | -26% | 7% |
asc_sort_size | 4,262.2 | 4,471 | 4.6 | 100% | 100% |
asc_sort_timestamp | 10.73 | 785 | 6.47 | 99% | 40% |
asc_sort_with_after_timestamp | 4,576 | 5,368 | 34.47 | 99% | 99% |
default | 2.91 | 3 | 3 | 0% | -3% |
desc_sort_size | 3,800.4 | 3,994 | 9.53 | 100% | 100% |
desc_sort_timestamp | 39.18 | 5,228 | 58.8 | 99% | -50% |
desc_sort_with_after_timestamp | 5,824.27 | 6,925 | 87.8 | 99% | 98% |
hourly_agg | 9,387.55 | 9,640 | 9,112.4 | 5% | 3% |
multi_term_agg | N/A | 14,703 | 9,669.8 | 34% | N/A |
range | 28.18 | 12 | 13.4 | -12% | 52% |
scroll | 213.91 | 173 | 197.4 | -14% | 8% |
term | 3.45 | 3 | 3.4 | -13% | 1% |
nyc_taxis workload results: The following table provides a benchmark comparison for the nyc_taxis workload between Elasticsearch 7.10.2, OpenSearch 2.3, and OpenSearch 2.11. It includes the 90th percentile of took time latency measurements for each (p90) and the observed percentage improvements.
| Operations | ES 7.10.2 (p90_value) | OS 2.3.0 (p90_value) | OS 2.11.0 (p90_value) | OS 2.11.0 improvement (vs. OS 2.3.0) | OS 2.11.0 improvement (vs. ES 7.10.2) |
|---|---|---|---|---|---|
autohisto_agg | 559.13 | 596 | 554.6 | 7% | 1% |
date_histogram_agg | 562.4 | 584 | 545.07 | 7% | 3% |
default | 4.73 | 6 | 5.07 | 15% | -7% |
distance_amount_agg | 13181 | 12796 | 15285 | -19% | -16% |
range | 654.67 | 213 | 213.4 | 0% | 67% |
pmc workload results: The following table provides a benchmark comparison for the pmc workload between Elasticsearch 7.10.2, OpenSearch 2.3, and OpenSearch 2.11. It includes the 90th percentile of took time latency measurements for each (p90) and the observed percentage improvements.
| Operations | ES 7.10.2 (p90_value) | OS 2.3.0 (p90_value) | OS 2.11.0 (p90_value) | OS 2.11.0 improvement (vs. OS 2.3.0) | OS 2.11.0 improvement (vs. ES 7.10.2) |
|---|---|---|---|---|---|
articles_monthly_agg_cached | 2 | 2 | 2.4 | -20% | -20% |
articles_monthly_agg_uncached | 26.5 | 27 | 27.8 | -3% | -5% |
default | 6.5 | 6 | 5.2 | 13% | 20% |
phrase | 8.25 | 6 | 6.4 | -7% | 22% |
scroll | 894.5 | 857 | 753.8 | 12% | 16% |
term | 9 | 5 | 5.6 | -12% | 38% |
Detailed results: Elasticsearch 7.10.2 vs. OpenSearch 2.3 vs. OpenSearch 2.11—deep dive into multiple-shard performance
Objective: To introduce the coordination layer with parallel search operations extending across multiple nodes with primary shards.
Setup: 3 data nodes (r5.xlarge) with 32 GB RAM and 16 GB heap. 3 cluster manager nodes (c5.xlarge) with 8 GB RAM and 4 GB heap. Index settings: 3 shards and 0 replicas.
http_logs workload results: The following table provides a benchmark comparison for the http_logs workload between Elasticsearch 7.10.2, OpenSearch 2.3, and OpenSearch 2.11. It includes the 90th percentile of took time latency measurements for each (p90) and the observed percentage improvements.
| Operations | ES 7.10.2 (p90_value) | OS 2.3.0 (p90_value) | OS 2.11.0 (p90_value) | OS 2.11.0 improvement (vs. OS 2.3.0) | OS 2.11.0 Improvement (vs. ES 7.10.2) |
|---|---|---|---|---|---|
200s-in-range | 9.8 | 6 | 6.85 | -14% | 30% |
400s-in-range | 5.8 | 5 | 5.5 | -10% | 5% |
asc_sort_size | 1,451.13 | 1,602 | 8.35 | 99% | 99% |
asc_sort_timestamp | 10.4 | 291.5 | 10.58 | 96% | -2% |
asc_sort_with_after_timestamp | 1,488.25 | 1,910.5 | 25.38 | 99% | 98% |
default | 6 | 6 | 6.3 | -5% | -5% |
desc_sort_size | 1,281.3 | 1,431 | 13.91 | 99% | 99% |
desc_sort_timestamp | 34.4 | 1,878.5 | 91.9 | 95% | -167% |
desc_sort_with_after_timestamp | 1,887.7 | 2,480 | 85.78 | 97% | 95% |
hourly_agg | 2,566.9 | 3,115 | 2,937 | 6% | -14% |
multi_term_agg | N/A | 5205 | 3603 | 31% | N/A |
range | 18.1 | 9 | 8.95 | 1% | 51% |
scroll | 340.1 | 267 | 323.85 | -21% | 5% |
term | 5.8 | 6 | 6.45 | -8% | -11% |
nyc_taxis workload results: The following table provides a benchmark comparison for the nyc_taxis workload between Elasticsearch 7.10.2, OpenSearch 2.3, and OpenSearch 2.11. It includes the 90th percentile of took time latency measurements for each (p90) and the observed percentage improvements.
| Operations | ES 7.10.2 (p90_value) | OS 2.3.0 (p90_value) | OS 2.11.0 (p90_value) | OS 2.11.0 Improvement (vs. OS 2.3.0) | OS 2.11.0 Improvement (vs. ES 7.10.2) |
|---|---|---|---|---|---|
autohisto_agg | 208.92 | 217 | 212.93 | 2% | -2% |
date_histogram_agg | 198.77 | 218 | 209.4 | 4% | -5% |
default | 8.46 | 7 | 9.67 | -38% | -14% |
distance_amount_agg | 4,131 | 4,696 | 5,067.4 | -8% | -23% |
range | 281.62 | 73 | 79.53 | -9% | 72% |
pmc workload results: The following table provides a benchmark comparison for the pmc workload between Elasticsearch 7.10.2, OpenSearch 2.3, and OpenSearch 2.11. It includes the 90th percentile of took time latency measurements for each (p90) and the observed percentage improvements.
| Operations | ES 7.10.2 (p90_value) | OS 2.3.0 (p90_value) | OS 2.11.0 (p90_value) | OS 2.11.0 improvement (vs. OS 2.3.0) | OS 2.11.0 improvement (vs. ES 7.10.2) |
|---|---|---|---|---|---|
articles_monthly_agg_cached | 3.55 | 3 | 3.71 | -24% | -5% |
articles_monthly_agg_uncached | 12 | 12 | 12.43 | -4% | -4% |
default | 9 | 6 | 6.79 | -13% | 25% |
phrase | 8.18 | 7 | 7.14 | -2% | 13% |
scroll | 755.18 | 593 | 642.79 | -8% | 15% |
term | 9 | 7 | 7.14 | -2% | 21% |
Elevating performance with new features available in OpenSearch 2.11
The following sections present OpenSearch 2.11 features that improve performance.
LogByteSize merge policy
In the realm of log analytics, the Tiered merge policy has been a cornerstone of efficient shard merges. In OpenSearch 2.11 we introduced the LogByteSize merge policy. This new approach consistently merges adjacent segments, proving especially advantageous for time-series data characterized by timestamp sorting and minimal timestamp overlap between segments.
The following are the key findings from this exercise.
- Timestamp queries with ascending sort had an improvement of over 75%. This transformation is attributable to the impactful contribution of enhancement #9241.
- About a 40% enhancement in descending sort timestamp queries, surpassing the Tiered merge policy.
- Use cases around ascending and descending sort with an after timestamp saw regression, which is a known case for smaller workloads with this merge policy.
- Other common use cases for log analytics, such as multi-term aggregation,
hourly_agg, range, and scroll queries exhibited comparable performance, with a subtle improvement of less than 5% attributed to the new segment merge policy.
Detailed results: OS 2.11 Tiered merge policy vs OS 2.11 LogByteSize merge policy
Setup: 3 data nodes (r5.xlarge) with 32 GB RAM and 16 GB heap. 3 cluster manager nodes (c5.xlarge) with 8 GB RAM and 4 GB heap. Index settings: 3 shards and 0 replicas, max_segment_size: 500 MB, refresh_interval: 1 s.
http_logs workload results: The following table provides a benchmark comparison for the http_logs workload for OpenSearch 2.11 with the Tiered merge policy vs. the LogByteSize merge policy. It includes the 90th percentile of took time latency measurements for each (p90) and the observed percentage improvements.
| Operations | OS 2.11—Tiered (p90_value) | OS 2.11—LogByteSize (p90_value) | % improvement (vs. Tiered merge policy) |
|---|---|---|---|
200s-in-range | 6 | 6 | 0% |
400s-in-range | 5 | 6 | -20% |
asc_sort_size | 9 | 8 | 11% |
asc_sort_timestamp | 34 | 8 | 76% |
asc_sort_with_after_timestamp | 13 | 68 | -423% |
default | 7 | 6 | 14% |
desc_sort_size | 11 | 10 | 9% |
desc_sort_timestamp | 29 | 17 | 41% |
desc_sort_with_after_timestamp | 35 | 130 | -271% |
hourly_agg | 2816 | 2809 | 0% |
multi_term_agg | 2739 | 2800 | -2% |
range | 7 | 8 | -14% |
scroll | 349 | 344 | 1% |
term | 7 | 6 | 14% |
Zstandard codec compression
This addition empowers OpenSearch users with the new Zstandard compression codecs for their data. Users can specify zstd or zstd_no_dict in the index.codec setting during index creation or modify the codecs for existing indexes. OpenSearch will continue to support the existing zlib and lz4 codecs, with the default as lz4.
The following sections contain benchmarking results representing the average of 5 days of data from nightly runs using OpenSearch Benchmark.
Highlights
Here are the key highlights:
- A notable increase in the ingestion throughput, ranging from 5% to 8%, attributed to the new
zstdcodec. This enhancement owes its success to codec-related pull requests (#7908, #7805, and #7555). - About a 30% reduction in on-disk data size, surpassing the default
lz4codec for unparalleled efficiency, all while maintaining a near-identical CPU utilization pattern compared to the default compression. - The search p90 latencies remained virtually unchanged, with negligible differences of less than 2% in a few areas.
Detailed results: OpenSearch 2.11 default (lz4) compression vs. OpenSearch 2.11 zstd compression using multiple shards
Setup: 3 data nodes (r5.xlarge) with 32 GB RAM and 16 GB heap. 3 cluster manager nodes (c5.xlarge) with 8 GB RAM and 4 G heap. Index settings: 3 shards and 0 replicas.
Indexing throughput results (docs/sec): The following table provides an indexing throughput comparison of the http_logs and nyc_taxis workloads for OpenSearch 2.11 with the default codec vs. the zstd codec enabled and includes the percentage improvement observed when using zstd.
| Workload | OS 2.11—default codec (mean_value) | OS 2.11—zstd codec (mean_value) | % improvement (vs. default codec) |
|---|---|---|---|
http_logs | 209,959.75 | 220,948 | 5% |
nyc_taxis | 118,123.5 | 127,131 | 8% |
nyc_taxis search workload results: The following table illustrates a benchmark comparison for the nyc_taxis workload for OpenSearch 2.11 with default codec vs. zstd codec enabled, including percentage improvement.
| Operations | OS 2.11—default codec (p90_value) | OS 2.11—zstd codec (p90_value) | % improvement (vs. default codec) |
|---|---|---|---|
autohisto_agg | 216.75 | 208 | 4% |
date_histogram_agg | 211.25 | 205.5 | 3% |
default | 8 | 7.5 | 6% |
distance_amount_agg | 5,012 | 4,980 | 1% |
range | 74.5 | 77.5 | -4% |
Detailed results: Index data size on disk (bytes) with zstd compression using a single shard
Setup: OpenSearch 2.11.0, single node (r5.xlarge) with 32 GB RAM and 16 GB heap. Index settings: 1 shard and 0 replicas.
Data size of disk results (bytes): The following table illustrates a benchmark comparison of the on-disk data size for the http_logs and pmc workloads for OpenSearch 2.11 with default vs. zstd codec enabled, including percentage improvement.
| Default compression (bytes) | ZSTD (bytes) | ZSTD_NO_DICT (bytes) | ZSTD improvement (vs. default codec) | ZSTD_NO_DICT improvement (vs. default codec) | |
|---|---|---|---|---|---|
http_logs | 20,056,770,878.5 | 15,800,734,037 | 16,203,187,551 | 21% | 19% |
pmc | 20,701,211,614.5 | 15,608,881,718.5 | 15,822,040,185 | 25% | 24% |
Concurrent search improvements (Experimental in 2.11)
OpenSearch users can now achieve better execution speed with concurrent segment search, launched as experimental in OpenSearch 2.11. By default, OpenSearch processes a request sequentially across all the data segments on each shard during the query phase of a search request execution. With concurrent search, every shard-level request can concurrently search across segments during the query phase. Each shard divides its segments into multiple slices, where each slice serves as a unit of work executed in parallel on a separate thread. Therefore, the slice count governs the maximum degree of parallelism for a shard-level request. After all the slices finish their tasks, OpenSearch executes a reduce operation on the slices, merging them to generate the final result for the shard-level request.
The following benchmarking results show the benefits of concurrent search in action. These are the averages of data generated from over 4 days of nightly runs using OpenSearch Benchmark.
Highlights
Here are the key highlights:
- An increase in performance with aggregate queries on workloads such as the
nyc_taxisworkload, showcasing an improvement ranging between 50% and 70% over the default configuration. - The log analytics use cases for range queries demonstrated an improvement of around 65%.
- Aggregation queries with hourly data aggregations, such as those for the
http_logsworkload, demonstrated a boost of up to 50% in performance. - Comparable latencies for auto or date histogram queries, with no noteworthy improvement or regression in performance.
multi_term_agg,asc_sort_size,dec_sort_size, andscrollqueries showed regression. To delve deeper into the intricacies, the concurrent search contributors are proactively addressing this in the upcoming OpenSearch 2.12 GA release.
Detailed results: OpenSearch 2.11 with concurrent search enabled vs. disabled
Setup: OpenSearch 2.11.0 single node (r5.2xlarge) with 64 GB RAM and 32 GB heap. Index settings: 1 shard and 0 replicas.
nyc_taxis workload results: The following table provides a benchmark comparison of the nyc_taxis workload for OpenSearch 2.11 with concurrent search disabled and enabled (with 0 slices and with 4 slices). It includes the 90th percentile of took time latency measurements for each (p90) and the observed percentage improvements.
| Operations | CS disabled (p90_value) | CS enabled—0-slice (p90_value) | CS enabled—4-slice (p90_value) | % improvement (with 0 slices) | % improvement (with 4 slices) |
|---|---|---|---|---|---|
autohisto_agg | 575 | 295 | 287 | 49% | 50% |
date_histogram_agg | 563 | 292 | 288 | 48% | 49% |
default | 6 | 6 | 5 | 0% | 17% |
distance_amount_agg | 15,043 | 4,691 | 4744 | 69% | 68% |
range | 201 | 73 | 77 | 64% | 62% |
http_logs workload results: The following table provides a benchmark comparison of the http_logs workload for OpenSearch 2.11 with concurrent search disabled and enabled (with 0 slices and with 4 slices). It includes the 90th percentile of latency measurements for each (p90) and the observed percentage improvements.
| Operations | CS disabled (p90_value) | CS enabled—0-slice (p90_value) | CS enabled—4-slice (p90_value) | % improvement (with 0 slices) | % improvement (with 4 slices) |
|---|---|---|---|---|---|
200s-in-range | 6 | 4 | 4 | 33% | 33% |
400s-in-range | 2 | 2 | 2 | 0% | 0% |
asc-sort-timestamp-after-force-merge-1-seg | 20 | 20 | 22 | 0% | -10% |
asc-sort-with-after-timestamp-after-force-merge-1-seg | 85 | 86 | 86 | -1% | -1% |
asc_sort_size | 3 | 5 | 5 | -67% | -67% |
asc_sort_timestamp | 4 | 4 | 4 | 0% | 0% |
asc_sort_with_after_timestamp | 34 | 33 | 34 | 3% | 0% |
default | 4 | 4 | 3 | 0% | 25% |
desc-sort-timestamp-after-force-merge-1-seg | 64 | 62 | 67 | 3% | -5% |
desc-sort-with-after-timestamp-after-force-merge-1-seg | 67 | 66 | 68 | 1% | -1% |
desc_sort_size | 6 | 91 | 9 | -1417% | -50% |
desc_sort_timestamp | 26 | 34 | 28 | -31% | -8% |
desc_sort_with_after_timestamp | 63 | 61 | 63 | 3% | 0% |
hourly_agg | 8180 | 3832 | 4034 | 53% | 51% |
multi_term_agg | 9818 | 40015 | 54107 | -308% | -451% |
range | 15 | 12 | 13 | 20% | 13% |
scroll | 179 | 375 | 212 | -109% | -18% |
term | 3 | 3 | 3 | 0% | 0% |
We would like to take this opportunity to thank the OpenSearch core developers for their contributions to the technical roadmap. We sincerely appreciate all the suggestions from Michael Froh, Andriy Redko, Jonah Kowall, Amitai Stern, Jon Handler, Prabhakar Sithanandam, Mike McCandless, Anandhi Bumstead, Eli Fisher, Carl Meadows, and Mukul Karnik in writing this blog post. Credits to Fanit Kolchina and Nathan Bower for editing and Carlos Canas for creating the graphics.