Responsiveness is core to any search solution, and communication delays between search requests and responses can present problems for your users. This is why many administrators monitor search latency: the amount of time between when a search request is sent to an OpenSearch cluster and when a response is returned.
However, the ability to monitor search latency in OpenSearch versions earlier than 2.11 is limited. Tools such as the Nodes Stats API and shard slow logs offer latency measurements based on shard-level operations but do not provide any visibility at the coordinator node level. Because search requests often hit multiple shards simultaneously, the measured amount of time spent in a single shard search phase doesn’t provide comprehensive latency information.
Luckily, in OpenSearch 2.11 and later, OpenSearch offers search latency monitoring at the coordinator node level. This blog post provides information about several tools—the Node Stats API, the phase_took parameter, and search request slow logs—that can help you monitor coordinator-node-level statistics.
The coordinator node and search phases
In OpenSearch, the coordinator node plays a crucial role in search execution by acting as an intermediary between the client and data nodes. When a search request is received, the coordinator node fans the request to data nodes containing the relevant shards. Depending on the type of search, the request undergoes a series of search phases, or types of search operations, initiated by the coordinator node. These phases include the following:
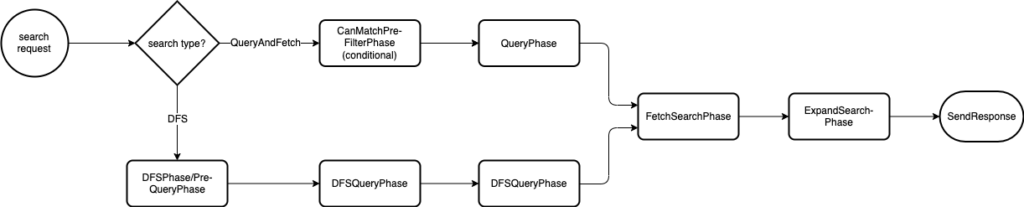
can_match: Pre-filters search shards based on query rewrites.dfs_pre_query: Collects additional information from each shard to make scoring 100% accurate.dfs_query– Executes distributed searches with pre-collected distributed frequencies for all search terms in the search request.query– Runs query and gets information about the matching documents, such as document IDs, score, and sort criterion, from each shard.fetch– Gets the actual top matching documents after reducing all matches in thequeryphase. The top matches are returned.expand– Collapses fields on the inner hits whenexpandis enabled.
The following diagram shows the search phase workflow, from request to response.
New features for phase monitoring
Before OpenSearch 2.11, OpenSearch only monitored the query and fetch shard search phases, greatly limiting the scope of search latency visibility. Now you can take advantage of the following features, some within preexisting APIs and tools, to monitor metrics for all search phases at the coordinator node level.
Nodes Stats API
Introduced in OpenSearch 2.11, the Nodes Stats API can measure the following coordinator-node-level metrics.
| Metric | Description |
|---|---|
time_in_millis |
The cumulative time spent on all coordinator search operations, in milliseconds |
current |
The cumulative number of coordinator search operations that are currently running |
total |
The cumulative number of completed coordinator search operations |
The following Nodes Stats API response shows these metrics for each search phase:
GET /_nodes/stats/indices/search
{
  "_nodes": {
    "total": 6,
    "successful": 6,
    "failed": 0
  },
  "cluster_name": "113389760531:os213-2",
  "nodes": {
    "PYR526iKRq6wuuxNZJa7Zg": {
      "timestamp": 1718916559344,
      "name": "ca9a0681a452f388df882cdffc18fbfb",
      "roles": [
        "ingest",
        "master",
        "remote_cluster_client"
      ],
      "indices": {
        "search": {
          ...
          "request":  {
  "dfs_pre_query":  {
  "time_in_millis": 47,
  "current": 0,
  "total": 41
  },
  "query":  {
  "time_in_millis":  5429,
  "current":  13,
  "total":  238
  },
  "fetch":  {
  "time_in_millis":  1230,
  "current":  2,
  "total":  238
  },
  "dfs_query":  {
  "time_in_millis":  0,
  "current":  0,
  "total":  0
  },
  "expand":  {
  "time_in_millis":  304,
  "current": 1,
  "total": 238
  },
  "can_match":  {
  "time_in_millis":  0,
  "current":  0,
  "total":  0
  }
  }
        }
      }
    },
    ...
  }
Search phase took time
Introduced in OpenSearch 2.12, the phase_took parameter returns phase took times directly in the search response, as shown in the following example:
GET /my-index-000001/_search?phase_took
{
  "took" : 105,
  "phase_took" : {
    "dfs_pre_query" : 0,
    "query" : 69,
    "fetch" : 22,
    "dfs_query" : 0,
    "expand" : 4,
    "can_match" : 0
  },
  "timed_out" : false,
  "_shards" : {
    "total" : 5,
    "successful" : 5,
    "skipped" : 0,
    "failed" : 0
  },
  "hits" : {
    "total" : {
    "value" : 0,
    "relation" : "eq"
  },
  "max_score" : null,
  "hits" : [ ]
}
Search request slow logs
Introduced in OpenSearch 2.12, search request slow logs provide statistics about search requests that exceed user-defined latency thresholds, as shown in the opensearch_index_search_slowlog.log example file:
[2023-10-30T15:47:42,630][TRACE][c.s.r.slowlog] [runTask-0]
took[80.8ms],
took_millis[80],
phase_took_millis[{expand=0, query=39, fetch=22}],
total_hits[4 hits], search_type[QUERY_THEN_FETCH],
shards[{total: 10, successful: 10, skipped: 0, failed: 0}],
source[{"query":{"match_all":{"boost":1.0}}}],
id[]
For more information about how to set up slow log thresholds, see Search request slow logs.
Enabling search latency monitoring
To enable these features, visit the Search settings page in the OpenSearch documentation or use the following example API request:
TIP: Search request slow log thresholds can be customized. This simplifies setting thresholds for certain search requests, since you can set the log creation to match the search threshold.
PUT _cluster/settings
{
  "persistent" : {
    // Coordinator nodes stats
    "search.request_stats_enabled" : "true",
    // Search phase took time
    "search.phase_took_enabled" : "true",
    // Search request slow log and thresholds
    "cluster.search.request.slowlog.level" : "TRACE",
    "cluster.search.request.slowlog.threshold.warn": "10s",
    "cluster.search.request.slowlog.threshold.info": "5s",
    "cluster.search.request.slowlog.threshold.debug": "2s",
    "cluster.search.request.slowlog.threshold.trace": "10ms"
  }
}
Conclusion
These new features help provide better end-to-end visibility of search latency inside your cluster. By using these tools, you can better debug spikes in request times, identify bottlenecks, and isolate the longest-running queries on your domain.
For more information about overall latency improvements since the launch of OpenSearch, see An update on the OpenSearch Project’s continued performance progress through version 2.11.