You're viewing version 2.12 of the OpenSearch documentation. This version is no longer maintained. For the latest version, see the current documentation. For information about OpenSearch version maintenance, see Release Schedule and Maintenance Policy.
Query and visualize Amazon S3 data
Introduced 2.11
This tutorial guides you through using the Query data use case for querying and visualizing your Amazon Simple Storage Service (Amazon S3) data using OpenSearch Dashboards.
Prerequisites
You must be using the opensearch-security plugin and have the appropriate role permissions. Contact your IT administrator to assign you the necessary permissions.
Get started with querying
To get started, follow these steps:
- On the Manage data sources page, select your data source from the list.
-
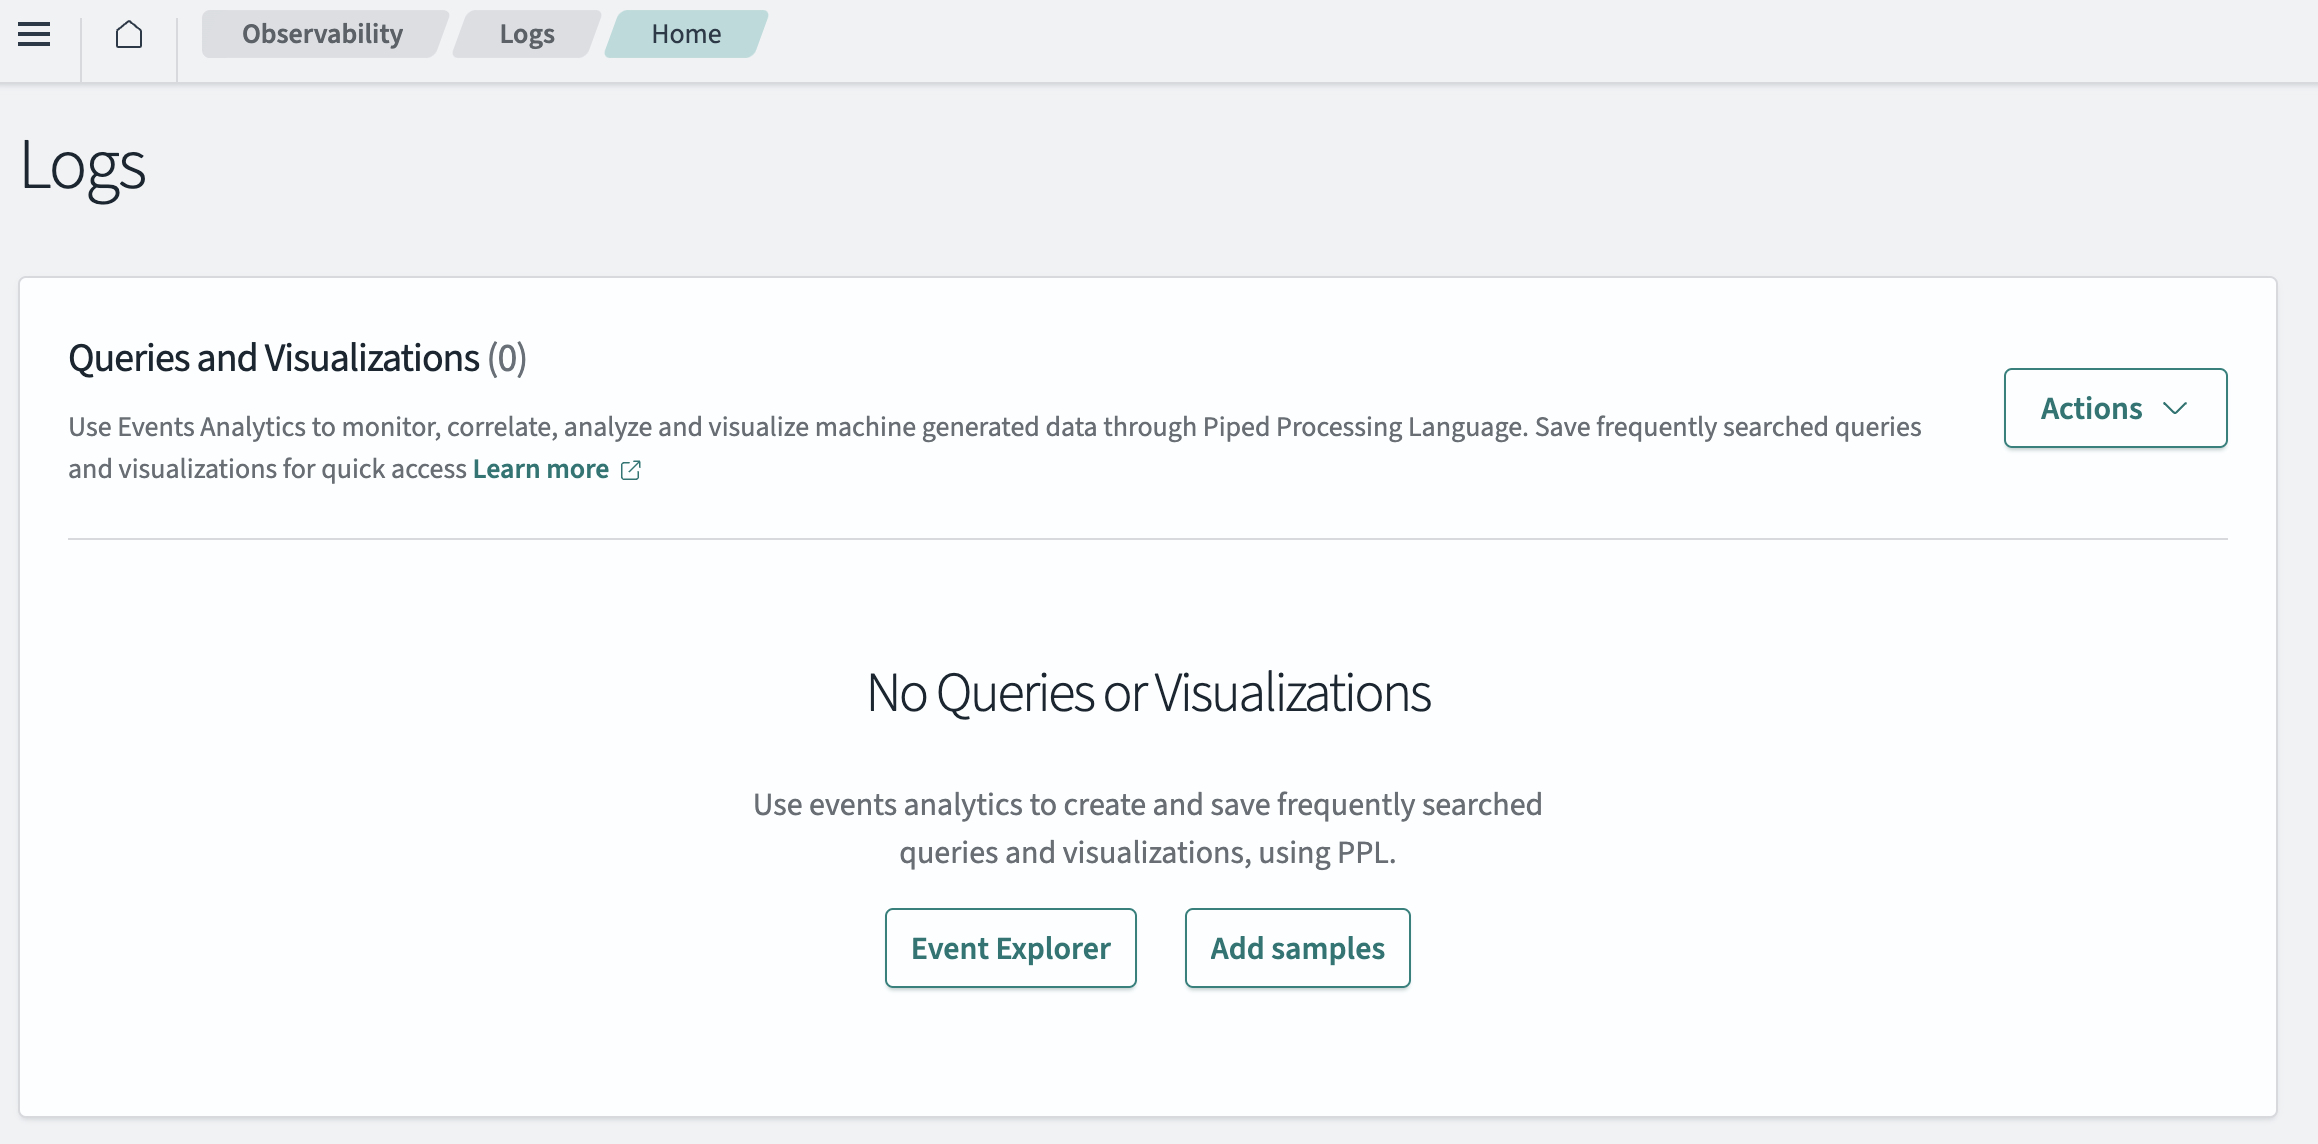
On the data source’s detail page, select the Query data card. This option takes you to the Observability > Logs page, which is shown in the following image.

- Select the Event Explorer button. This option creates and saves frequently searched queries and visualizations using Piped Processing Language (PPL) or SQL, which connects to Spark SQL.
-
Select the Amazon S3 data source from the dropdown menu in the upper-left corner. An example is shown in the following image.

- Enter the query in the Enter PPL query field. Note that the default language is SQL. To change the language, select PPL from the dropdown menu.
- Select the Search button. The Query Processing message is shown, confirming that your query is being processed.
- View the results, which are listed in a table on the Events tab. On this page, details such as available fields, source, and time are shown in a table format.
- (Optional) Create data visualizations.
Create visualizations of your Amazon S3 data
To create visualizations, follow these steps:
-
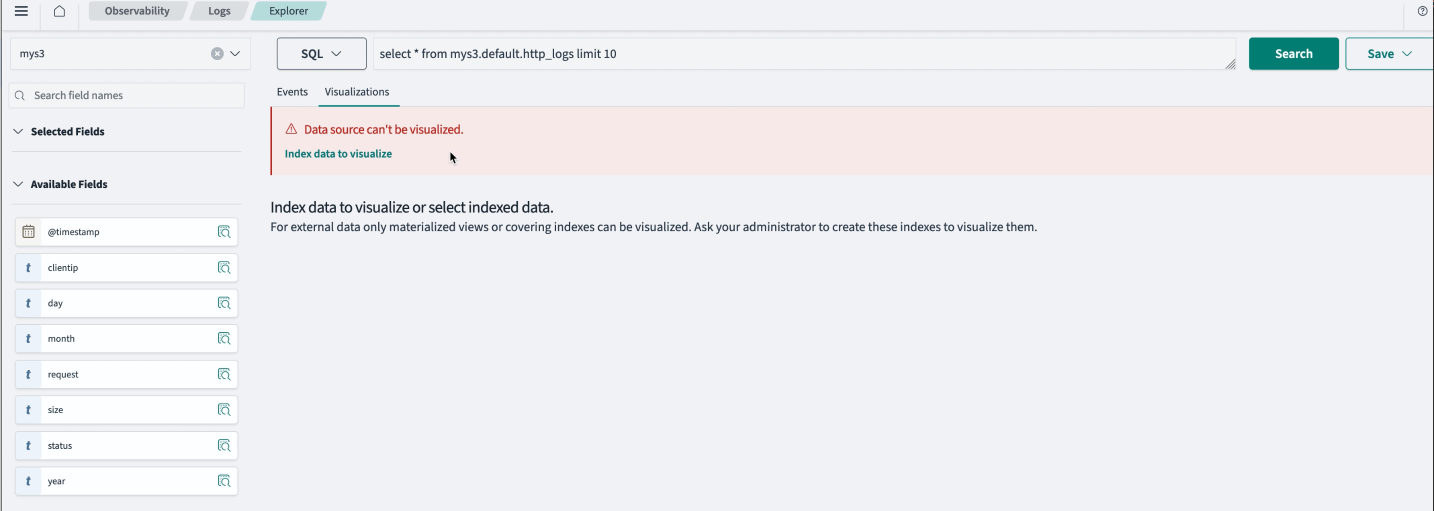
On the Explorer page, select the Visualizations tab. An example is shown in the following image.

-
Select Index data to visualize. This option currently only creates acceleration indexes, which give you views of the data visualizations from the Visualizations tab. To create a visualization of your Amazon S3 data, go to Discover. See the Discover documentation for information and a tutorial.
Use Query Workbench with your Amazon S3 data source
Query Workbench runs on-demand SQL queries, translates SQL into its REST equivalent, and views and saves results as text, JSON, JDBC, or CSV.
To use Query Workbench with your Amazon S3 data, follow these steps:
- From the OpenSearch Dashboards main menu, select OpenSearch Plugins > Query Workbench.
-
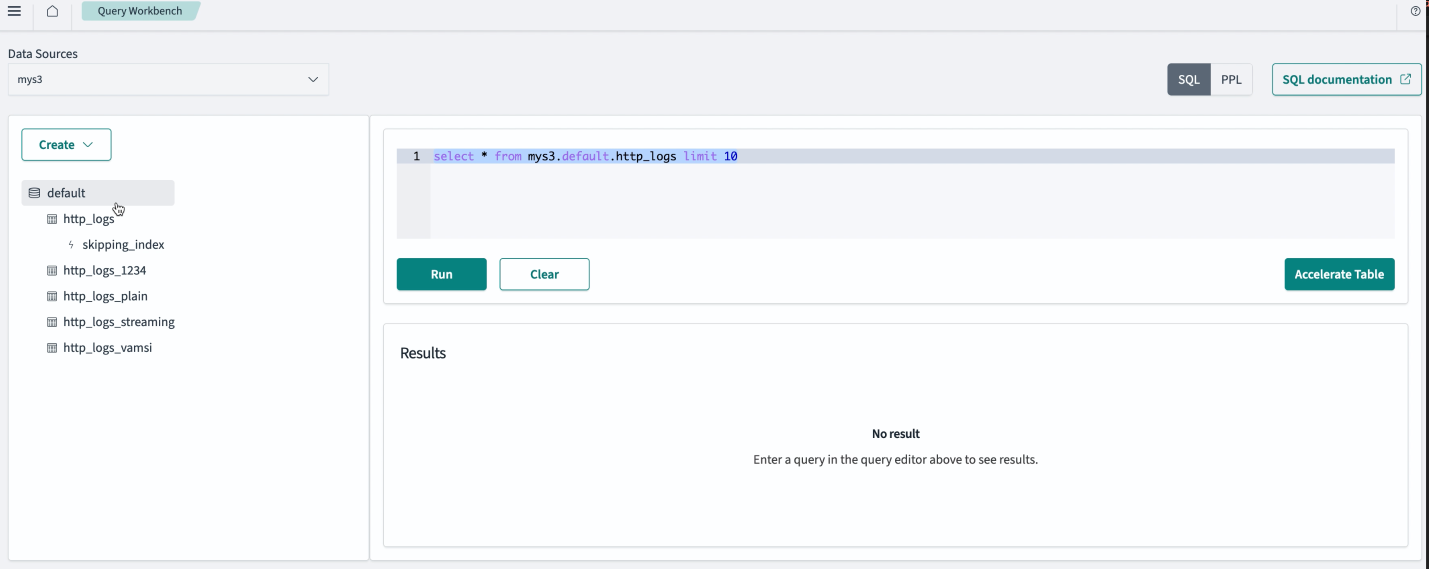
From the Data Sources dropdown menu in the upper-left corner, choose your Amazon S3 data source. Your data begins loading the databases that are part of your data source. An example is shown in the following image.

- View the databases listed in the left-side navigation menu and select a database to view its details. Any information about acceleration indexes is listed under Acceleration index destination.
- Choose the Describe Index button to learn more about how data is stored in that particular index.
- Choose the Drop index button to delete and clear both the OpenSearch index and the Amazon S3 Spark job that refreshes the data.
- Enter your SQL query and select Run.
Next steps