Accelerate vector search, deepen observability, and protect clusters at scale
OpenSearch 3.9 advances the project across search, observability, and cluster resiliency, with an emphasis on vector search efficiency, a broader observability and application monitoring experience, and new tools to enhance workload efficiency. The latest capabilities in OpenSearch 3.9 include the following:
- Accelerating neural sparse approximate nearest neighbor (ANN) search with a new native engine for higher throughput, faster index builds, and a smaller heap footprint.
- Expanding vector storage and compression with a native 16-bit
half_floattype, abf16scalar quantization encoder, and 2-bit and 4-bit scalar quantization. - Indexing vector fields without an explicit mapping by using dynamic mapping.
- Triaging alerts, anomalies, and forecasts across data sources from one unified view.
- Investigating application performance faster with the OpenSearch Observability Stack, which adds redesigned trace details, reusable Prometheus Query Language (PromQL) dashboards, no-code alert rules, a guided application performance monitoring (APM) setup wizard, and Piped Processing Language (PPL) query profiling.
- Protecting clusters with adaptive per-action concurrency limits and index-level search pruning.
- Making the resource sharing and access control framework generally available.
OpenSearch 3.9 is ready for download. The following sections describe the new features in more detail. For a complete list of changes, see the release notes.
Search modernization
AI-powered search applications require efficient vector storage, low-friction onboarding, and fast execution. OpenSearch 3.9 advances all three with a new native engine for neural sparse search, a broader set of vector storage and compression options, and dynamic mapping, which you can use to index vectors without defining a mapping first.
Run neural sparse vector search on a faster, lighter native engine
OpenSearch 3.9 moves neural sparse ANN search from the Java virtual machine (JVM) to a purpose-built C++ engine, delivering faster query execution, faster index builds, and a significantly smaller heap footprint. The new engine runs the SEISMIC algorithm in an open-source C++ library, which the Neural Search plugin calls through the Java Native Interface (JNI). This is the same integration pattern that the k-NN plugin uses for Faiss. At query time, index data is memory-mapped instead of held on the Java heap, so the operating system manages residency through the page cache and can reclaim memory under pressure without application-level eviction. In testing on an 8.8-million-document corpus, the native engine delivered 39 percent higher throughput and 3.3x faster index builds while requiring an 8x smaller JVM heap. To use the native engine, set "engine": "native" in the sparse_vector field mapping alongside the existing SEISMIC method configuration. The Lucene engine remains the default. For more information, see Native engine.
Index vector data without defining a mapping first
OpenSearch 3.9 introduces dynamic mapping for knn_vector fields as an opt-in feature, so you no longer need to define an explicit field mapping before indexing vector data. Dynamic mapping has two complementary capabilities:
- Dynamic templates: A dynamic template that uses
match_mapping_type: "knn_vector"matches any unmapped field whose value is a vector and infers the dimension from the first document. - Auto-inference: A zero-configuration mode automatically recognizes qualifying numeric arrays as vector fields.
Both capabilities are built on a new, generic plugin Service Provider Interface (SPI) that any mapper plugin can implement in order to participate in dynamic mapping. Explicit mappings always take precedence, and the first document indexed into a field sets the field’s dimension. For more information, refer to the documentation on dynamic mapping.
Cut vector memory in half with native half-float vectors
OpenSearch 3.9 adds the half_float vector data type, which stores k-NN vectors natively in the 16-bit floating-point (FP16) format. Because each dimension occupies two bytes instead of four, indexes built with half_float require approximately half the memory and storage of equivalent float indexes, which can reduce cost and improve cache efficiency for large vector workloads. The data type is available in both the Faiss and Lucene engines and supports flat and Hierarchical Navigable Small World (HNSW) index structures, so you can use half-precision storage without changing your engine or method. For more information, see Half-float vectors.
Store full-range vectors with bfloat16 quantization
OpenSearch 3.9 introduces the bf16 encoder for Faiss scalar quantization, giving you a second 16-bit storage option alongside the existing fp16 encoder. Because the bfloat16 format uses the same number of exponent bits (eight) as a 32-bit float, it spans the full floating-point value range, so any finite value can be indexed without the range-based rejection or clipping that fp16 may require. Both encoders use two bytes per dimension and provide comparable memory savings, but bf16 trades a small amount of precision for a wider range, which may result in a slightly larger drop in recall for some datasets. On Intel Sapphire Rapids and newer processors, OpenSearch uses AVX-512 BF16 instructions to accelerate distance computation. For more information, visit the documentation.
Tune vector compression using 2-bit and 4-bit scalar quantization
OpenSearch 3.9 extends scalar quantization for vector search from the existing 1-bit (32x) encoding to include 2-bit (16x) and 4-bit (8x) encodings, so you can choose from more levels when balancing compression against recall. All three levels are available in both the Faiss and Lucene engines for HNSW and flat index types. You can select a quantization level explicitly in the encoder configuration or implicitly by using the compression_level parameter in on_disk mode, so you can evaluate different trade-offs without changing the index structure. Together with the new half_float data type and the bf16 encoder, these additions give you a broad range of storage and recall options for vector workloads in a single release. For more information, see 1-bit, 2-bit, and 4-bit quantization.
Preserve XGBoost ranking behavior with the missing_as_zero flag
OpenSearch 3.9 adds an opt-in, model-level missing_as_zero flag to the Learning to Rank plugin for XGBoost models that were trained with missing feature values treated as zero. A previous release began routing missing features as NaN to match native XGBoost semantics, which changed rankings for those models. The new flag routes missing features as zero again, so you can preserve your existing scoring without retraining. The flag is disabled by default, so other models are unaffected.
Observability and analytics
OpenSearch 3.9 brings anomaly detection and forecasting into the unified alerts view and makes the view generally available, so you can triage signals across data sources without switching between tools. Beyond core OpenSearch, the OpenSearch Observability Stack—a separately deployed, OpenTelemetry- and Prometheus-based distribution for application monitoring—advances trace investigation, dashboards, alerting, and PPL.
Triage alerts, anomalies, and forecasts from one unified view
OpenSearch 3.9 expands the unified alerts view to include anomaly detection and forecasting resources and makes the view generally available. You can triage OpenSearch log alerts, Prometheus metric alerts, and anomaly detector results in one place while managing detectors and forecasters alongside alerting rules. Anomaly results appear on the Alerts tab with grouped occurrences and detail flyouts. Detectors and forecasters appear on the Rules tab, where you can review their configuration and status and manage their lifecycle without switching between plugin dashboards. For more information, see Unified alerts view.
Advance application monitoring with the OpenSearch Observability Stack
The OpenSearch Observability Stack is a separately deployed, preconfigured distribution built on OpenTelemetry, OpenSearch, and Prometheus for monitoring services and applications. It is released and versioned independently of the core OpenSearch distribution. The 3.9 release cycle brings a connected set of improvements across the investigation path, from redesigned trace details and reusable PromQL dashboards to no-code alert rules, a guided APM setup wizard, and a set of PPL updates that make queries easier to write, profile, and run at scale. Explore these and other features in the OpenSearch observability playground.
Pinpoint slow and failing spans with redesigned trace details
OpenSearch 3.9 redesigns the trace details page in Discover Traces for large, multi-service traces, as shown in the following image. The timeline waterfall colors each service, labels each span’s duration at the end of its bar, and outlines error spans in red. A zoom slider narrows the view to part of the trace, and new toolbar controls adjust row density and expand or collapse the span tree one level at a time.
A new filter bar filters spans by Status, by minimum Duration (enter a value or select a p90 or p99 preset calculated from the trace), or by any span attribute. Filters appear as editable pills, and status and duration filters apply instantly without re-querying the cluster. A new Trace map tab shows how the services in a trace call one another. Each service card displays requests, errors, and duration, and selecting a service filters the whole view to that service. For more information, visit Discover Traces.
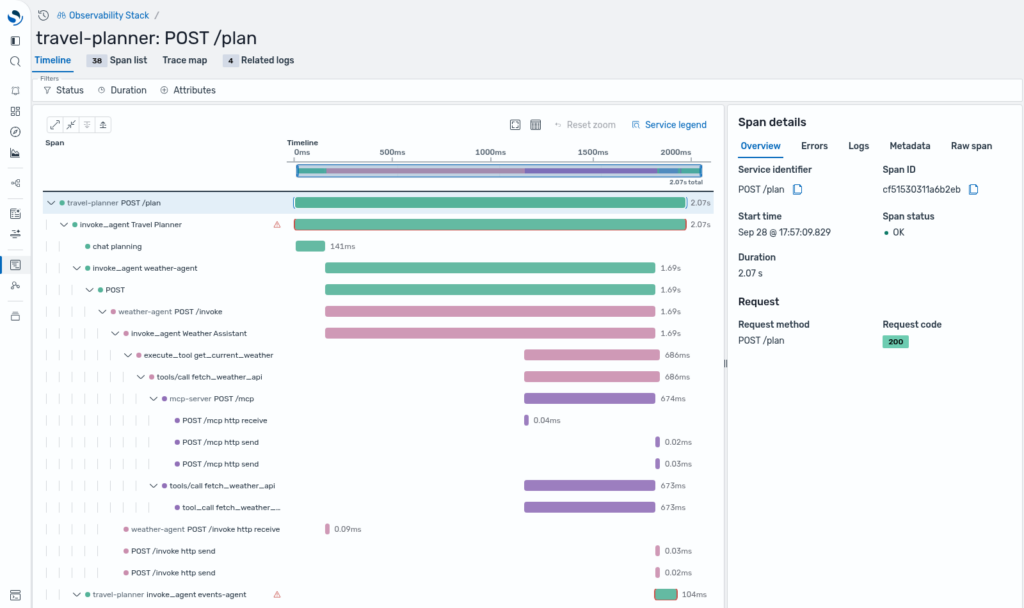
Find the slow or failing span with the redesigned trace timeline in Discover Traces
Reuse dashboards across services with PromQL variables and a synchronized crosshair
OpenSearch 3.9 extends the dashboard variables introduced in 3.7 to Prometheus. A query variable backed by a Prometheus data source can list label names, label values, metric names, or series, so a single $service variable can drive every panel on a dashboard, including panel titles and descriptions. Variables also gain a Text type, an Allow custom values option, and regex capture groups for extracting values and labels.
To make correlation easier, turn on Sync crosshair across panels in the dashboard options. When you hover over one time-series panel, every other panel marks the same moment. You can also group panels into named, collapsible sections and reorder them by dragging. To enable sections, set dashboard.allowDashboardSections to true. For more information, see Dashboard sections.
Visualizations in Discover and the visualization editor add stacked bar and area charts, unit formatting with min/max axis bounds and decimal precision, custom series names, whole-series hover highlighting, and legend click-to-focus. For PromQL queries, Discover Metrics adds per-query Series name templates, a Min step setting, and the $__interval, $__rate_interval, and $__range interval macros. For more information, see Dashboard variables and Discover Metrics.
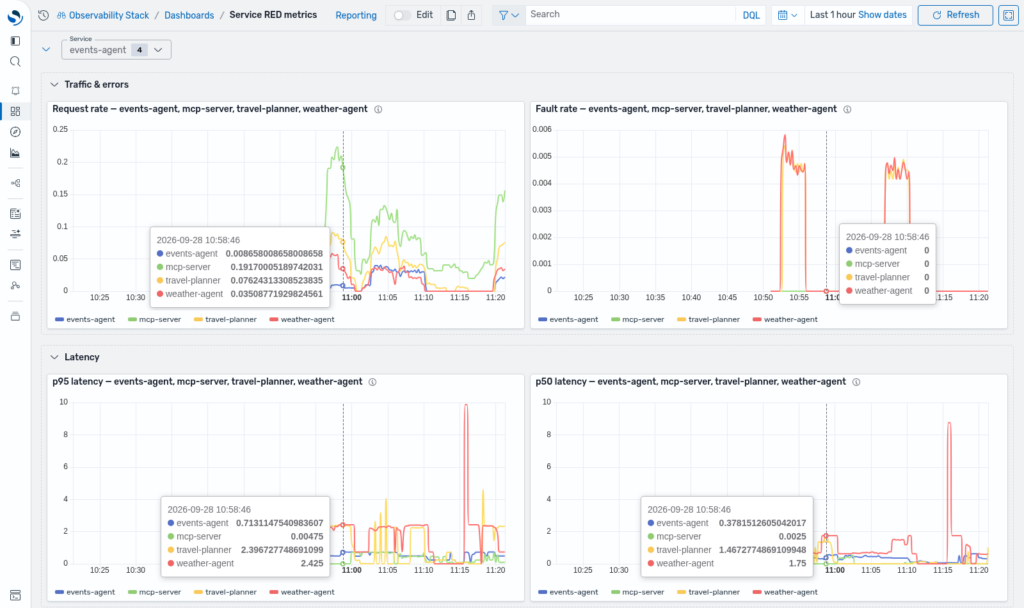
Drive a whole dashboard from one PromQL service variable, with the crosshair synchronized across panels
Create Prometheus alert rules without writing PromQL
OpenSearch 3.8 added the Create alert rule action. In 3.9, the metrics rule flyout also includes a point-and-click condition builder. You build a rule in four steps:
- Select a metric and optional label filters.
- Apply a function, such as
rate,increase, or an_over_timeaggregation, over a time window. - Optionally, aggregate by or without labels.
- Set a condition, such as IS ABOVE, IS OUTSIDE RANGE, or IS WITHIN RANGE.
The builder shows the generated PromQL as you go, switches to and from Code mode without losing changes, and previews the rule against live data before you save it. You can also configure rule groups directly in the flyout.
In addition to the detector and forecaster management, you can now create log, anomaly detection, and forecasting rules on the Rules tab and edit or delete detectors and forecasters without leaving the page. For more information, see Creating alert rules.
Configure Application Performance Monitoring in a few clicks
A new Set up Application Monitoring wizard replaces manual APM configuration. The wizard guides you through the three components that APM requires: a traces dataset, a service map dataset, and a Prometheus data source that provides rate, errors, and duration (RED) metrics. At each step, the wizard detects existing data, and you can reuse existing datasets. When your data follows OpenTelemetry index conventions, the wizard creates missing datasets in a single click. The wizard also validates the required fields, so you can’t finish with a broken configuration. The APM Services and Application Map pages are also more responsive in environments with many services. As an experimental feature, you can open a list of related dashboards from any service or map node. For more information, see Configuring APM.
Write, profile, and scale PPL queries
OpenSearch 3.9 brings several updates to PPL and SQL. For more information, see PPL commands and Inspect Query:
- Query profiling: Set
"analyze": trueon a PPL request to receive an operator tree with estimated and actual row counts, time per operator, and rule-based optimization recommendations. In Discover Logs, the new Inspect Query panel shows the same breakdown as a phase timeline and operator waterfall. To enable the panel, setexplore.pplAnalyze.enabledtotrue. - New commands and options: The
restcommand returns cluster management endpoints (such as/_cluster/health) as rows that you can filter and aggregate, and plugins can register additional endpoints. Theinclude_metadataparameter returns_id,_index, and_score, and thetopandrarecommands add percentage columns. - Resilience at scale: Expensive queries run on a dedicated thread pool, so interactive queries stay responsive. Indexes outside the query’s time range are skipped before a point-in-time context opens, which prevents
search.max_open_pit_contextexhaustion on wide index patterns. An opt-in partial results mode returns fast, annotated results when a field is mapped astextin some indexes andkeywordin others. - Linting: New rules flag aggregations on
textfields, type mismatches, and commands that can’t be pushed down. A headless lint API runs the same rules in continuous integration (CI) pipelines. - SQL: SQL adds the
histogramanddate_histogramfunctions, theRANK()andDENSE_RANK()functions, andUNION. SQL queries in Discover Logs now support the Patterns tab and the histogram. - Tracing: PPL emits OpenTelemetry spans for each query phase.
Scalability and resiliency
Clusters need to stay responsive under load, and index lifecycles need to scale without manual intervention. OpenSearch 3.9 gives you finer control over how clusters manage load, adds foundational capabilities for large-scale index management, and batches model inference requests on the server to increase throughput.
Protect clusters with adaptive per-action concurrency limits
OpenSearch 3.9 introduces adaptive concurrency limits, a module that dynamically adjusts per-action concurrency ceilings based on observed request latency instead of static thresholds. You can configure a limiter on any transport action, such as search or bulk indexing, and choose from three adaptive algorithms that continuously recalibrate the concurrency ceiling as conditions change. The module provides a monitor-only mode, which tracks how the limiter would behave without rejecting any requests, and an enforcement mode, which actively rejects excess requests once the adaptive ceiling is reached. It also supports burst capacity for absorbing transient spikes, request partitioning across named sub-pools for differentiating traffic classes, and a warmup grace period after configuration changes. All limiter state is exposed through the Nodes Stats API and telemetry gauges, and you can update every setting dynamically without a restart. For more information, see Concurrency limits.
Accelerate time-range queries with index-level search pruning
OpenSearch 3.9 introduces index-level search pruning, an optimization on the coordinating node that can substantially reduce search latency for time-series and observability workloads. Previously, a search across a wildcard pattern sent a shard-level request to every matched index during the can_match phase, even when the query’s time-range filter matched only the most recent index. The coordinating node now evaluates lightweight field-domain metadata, which records the minimum and maximum values of a configured date field in each index, and skips entire indexes that fall outside the query’s range before any shard-level work begins. In local benchmarks with 90 daily indexes, index-level search pruning reduced tail latency by more than 80 percent and cut can_match transport requests by nearly 98 percent. The improvement is expected to be more pronounced in distributed clusters. The feature is opt-in and is configured using dynamic cluster settings. For more information, see Index-level search pruning.
Replay routed deletes for zero-downtime index reshaping
OpenSearch 3.9 preserves document routing on delete operations recorded in the translog and exposed through the LuceneChangesSnapshot API. Index operations already carried routing, but delete operations did not, so tools that replay translog operations to an index with a different shard count could not route deletes correctly when custom routing was in use. This gap forced change-data-capture and schema-change plugins to use workarounds that limited their supported use cases. OpenSearch now passes the routing value through the delete path so that replayed deletes are routed to the correct target shard. Preserving routing provides a foundation for zero-downtime online schema change tooling that reshapes a live index without interrupting traffic. Many thanks to the contributors from Atlassian for their work on this update. To learn more about the Automated Online Schema Change (AOSC) and see it in action, visit Online index migration and shard scaling in OpenSearch with the AOSC plugin.
Batch inference on the server for higher model throughput
OpenSearch 3.9 introduces model-level request batching in the ML Commons plugin, so you no longer need to size inference calls to fit the model endpoint. OpenSearch splits large ingestion requests into calls that fit within the endpoint’s limits and combines small concurrent search requests into fewer calls, improving throughput and making more efficient use of model-serving resources. Because batching happens inside OpenSearch, every caller benefits without client-side changes, including ingest processors, plugins, and direct API consumers. You configure batching in the registered model’s metadata: set the request limits and tune the dynamic batching settings to match your workload. For more information, see Batching requests to externally hosted models.
Security and infrastructure
Security in OpenSearch 3.9 includes a major milestone for the resource sharing framework, along with several access control improvements.
Manage resource access with the generally available resource sharing framework
The resource sharing and access control framework is generally available in OpenSearch 3.9. Plugins can use the framework to share their resources, such as anomaly detectors, alerting monitors, and machine learning (ML) model groups, with specific users, roles, and backend roles. This release adds a centralized, inline Share button that appears directly in plugin resource list tables across seven plugins. For more information, see Resource sharing and access control.
Refine access control across the Security plugin
OpenSearch 3.9 includes the following additional access control improvements:
- A configurable REST API request body string length limit (
plugins.security.restapi.max_string_length) that restores compatibility for large document-level security (DLS) queries. For more information, see Security settings. - A new cross-cluster search setting (
plugins.security.ccs.ignore_source_security_roles) that ignores security roles propagated from the source cluster. For more information, see Remote cluster role evaluation. - Support for trailing-wildcard prefix matching on workload management rule principals. For more information, see Workload group rules.
Deprecating support for Amazon Linux 2 in OpenSearch
OpenSearch 3.9.0 deprecates support for Amazon Linux 2 as a CI build image and as a supported operating system. Amazon Linux 2 reached end of support on June 30, 2026. For more information, see the FAQ document from AWS. For a list of compatible operating systems, see Supported operating systems.
Getting started
OpenSearch 3.9 is available for download across supported distributions, and you can try it in OpenSearch Playground. For a complete list of changes, see the release notes and the documentation release notes, along with the updated documentation. This release is, as always, the product of a community of contributors from many organizations, and we want to know how it’s working for you. Share your feedback and get involved through the community forum, the project on GitHub, or the OpenSearch Slack instance.
| TL;DR: OpenSearch 3.9 advances vector search, observability, and cluster resiliency. On the search side, a new native engine runs neural sparse search with higher throughput and a smaller heap footprint, and expanded storage options let you tune the trade-off between compression and recall. For observability, the unified alerts view adds anomaly detection and forecasting and reaches general availability, while the OpenSearch Observability Stack advances trace investigation, dashboards, alerting, and PPL. For resiliency, adaptive per-action concurrency limits and index-level search pruning help clusters maintain consistent performance under heavy load. And the Resource Sharing and Access Control framework is now generally available. Download OpenSearch 3.9 to get started. |