
Unify observability signals, streamline visualizations, and accelerate vector search for AI-powered applications
OpenSearch 3.7 delivers an array of new tools designed to help you build, discover, and deliver faster. Observability teams can streamline exploration and accelerate time-to-results with native Prometheus integration that unlocks unified access to data sources. For search professionals, relevance tuning is easier and more powerful in the Search Relevance Workbench, while AI-powered applications can fetch vectors at significantly higher throughput. New capabilities include the following:
- Query, alert, and track SLOs across logs, traces, and metrics through a single interface.
- Build one parameterized dashboard that adapts across services, environments, and metrics, then reshape results without rerunning queries.
- Retrieve vectors up to 5.5x faster for improved search performance.
- Improve hybrid search optimization with new normalization and ranking techniques.
- Preview Index State Management (ISM) policy changes before they affect your indexes.
Read on for a closer look at what’s new in OpenSearch 3.7, and check out the release notes for the complete list of changes.
Observability and analytics
Observability teams spend too much time switching between tools and maintaining near-identical visualizations for every service, environment, and signal type. OpenSearch 3.7 addresses these issues, delivering a single operational view across your telemetry enabled by the recently launched OpenSearch Observability Stack. Now, native Prometheus support brings your metrics into the same interface where you already query logs and traces, with full PromQL, unified alerting, and a Service Level Objective (SLO) catalog, so you can correlate across signals without changing tabs or authentication contexts. New dashboard variables and data transformation functionality let you replace dozens of duplicated panels with a single parameterized template and one well-crafted query. Explore these and other features in the OpenSearch observability playground.
Query Prometheus metrics natively from OpenSearch Dashboards
OpenSearch Dashboards now connects directly to your existing Prometheus instances as a data source, letting you query metrics with PromQL without migrating data or changing your stack. Point the data source selector at a single Prometheus server, an HA pair, or a federation across regions, and your recording rules, alerting rules, and Alertmanager routing continue working unchanged. Because OpenSearch supports PromQL natively rather than translating it into a proprietary format, any query you build in Dashboards is portable—you can copy it into a recording rule, a curl command, or any other tool that understands PromQL. Combined with existing OpenSearch log and trace ingestion, this closes the metrics gap—you can view all three signal types from a single interface with one time selector and one authentication context.
Accelerate investigations with Explore Metrics
The new Explore Metrics view gives you a starting point when you know that something is wrong but don’t yet know what to query. A signal-aware dataset selector automatically detects your Prometheus data source, and a metrics builder lets you navigate from metric name to labels to aggregation to functions, generating valid PromQL live at every step. The builder and the raw query editor stay in sync, so you can shape a query by clicking and then dropping it into the editor in order to refine it by hand. Histograms, instant compared to range queries, label autocomplete, and dashboard variables all work out of the box. The result is a faster path from “something looks off” to a well-aimed query. Explore the new metrics workspace in the observability playground.
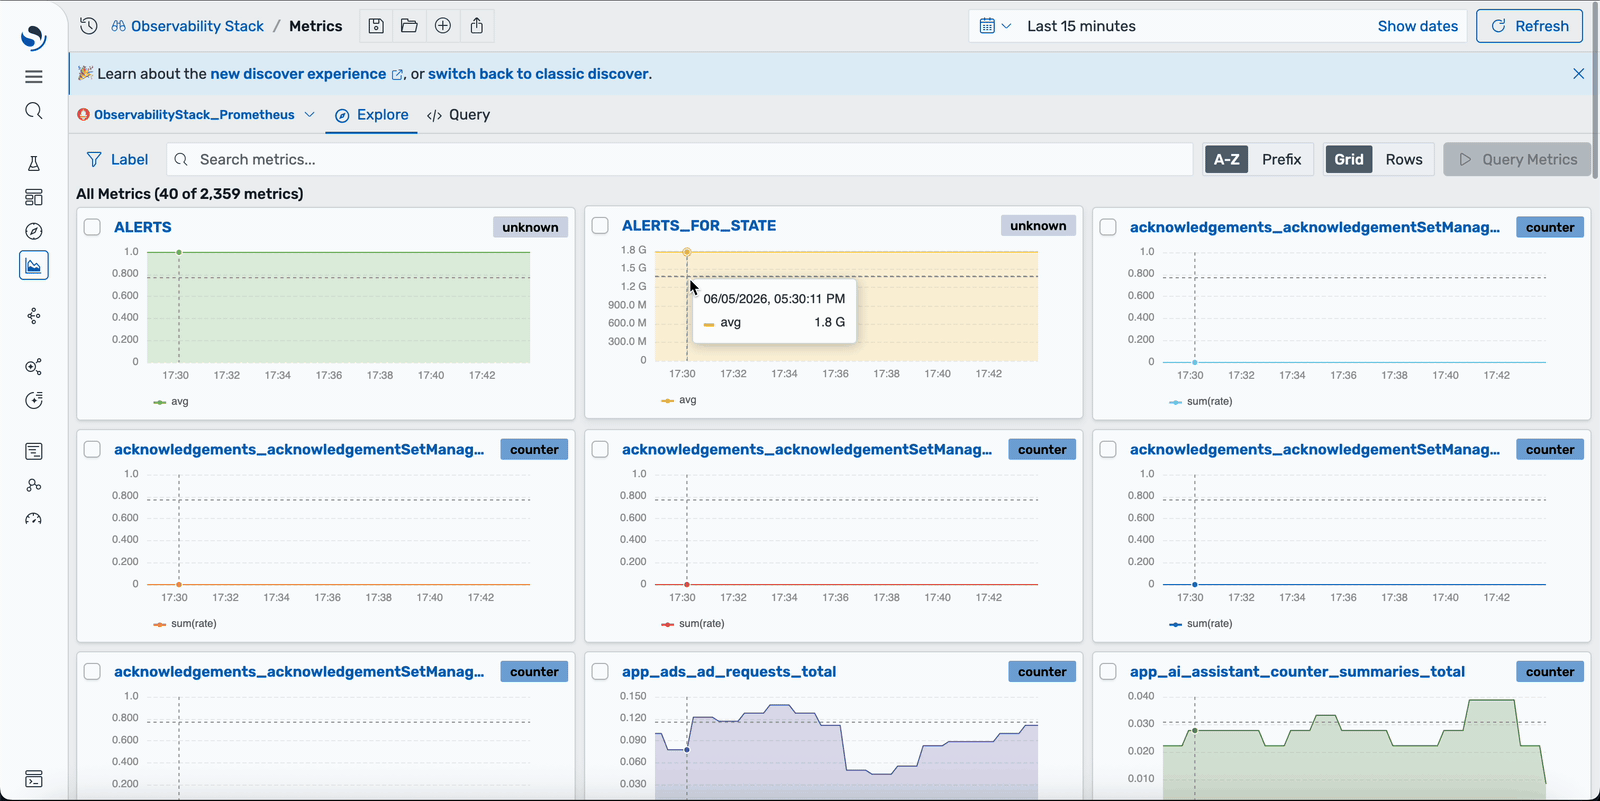 Explore Metrics auto-detects your Prometheus datasource and lets you navigate from metric name to labels to aggregation
Unify alerts from OpenSearch and Prometheus in one view
OpenSearch 3.7 introduces an experimental unified alerts view that merges OpenSearch monitors and Prometheus alerting rules into a single inbox, sorted by severity and grouped by service. A read-only rendering of your Alertmanager routing tree shows who got paged and why visually, without grepping YAML. Your existing alert pipeline keeps running unchanged; Dashboards only gives it a readable interface. For on-call teams, this means one place to check alert state across both systems instead of switching between tools during an incident. This functionality is also ready for you to try in a dedicated workspace in the observability playground.
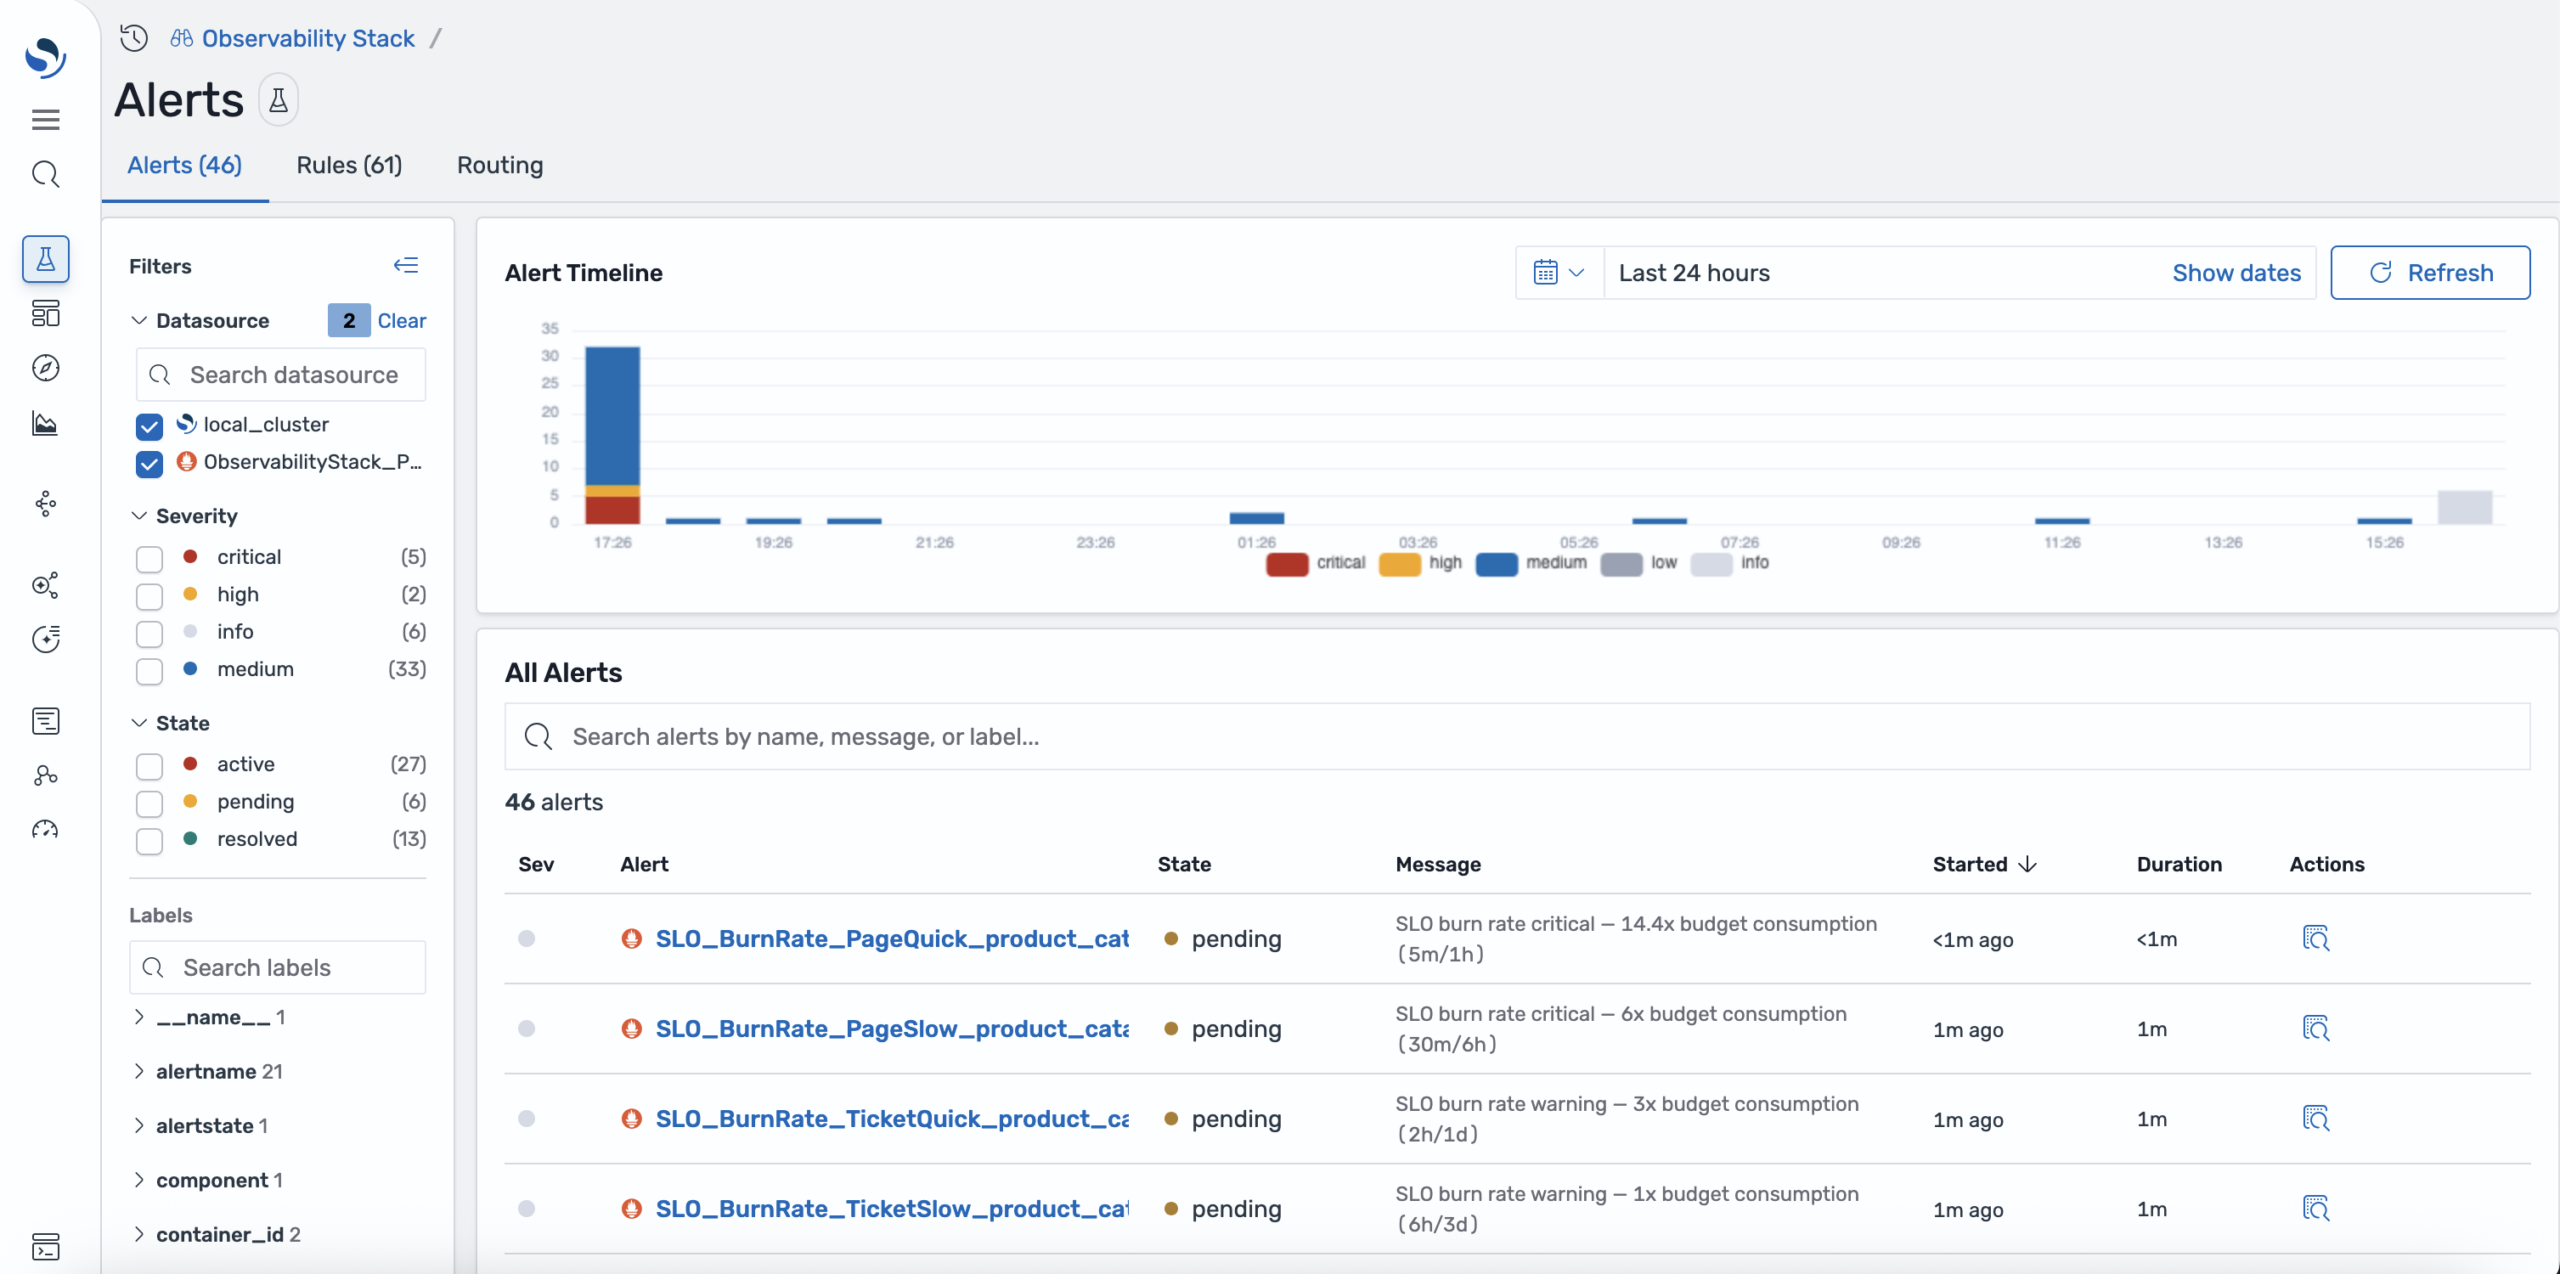 The unified alerts view merges OpenSearch monitors and Prometheus alerting rules into a single inbox, with filtering by datasource, severity, and state
Track SLOs with worst-error-budget-first ranking
Introduced as an experimental feature in 3.7, the new SLO catalog ranks every SLO by remaining error budget, so the objective closest to breaching is always the first one you see. Each SLO entry includes burn rate alerts, multi-window evaluation, and direct links to the underlying metrics that drive the SLO. The workflow is as follows: spot the budget burn, view the metric, and investigate the cause so you can ship a resolution—all within the same interface. Try it in the observability playground.
Build reusable, template-driven dashboards with dashboard variables
OpenSearch Dashboards now supports dashboard variables, letting you parameterize dashboards with reusable placeholders instead of maintaining near-identical copies for every service, environment, or metric. Now you can replace dozens of one-off visualizations with a single template: define a variable once and then reference it in visualization editor queries. Variables are resolved using text substitution before queries reach the backend, so they can modify any part of a query: field names, filter values, aggregations, or dimensions. Use two variable types for different workflows: custom variables define a fixed option list with single- or multi-select behavior, while query variables populate options dynamically from your data. Because variables modify query structure, a single template can serve any combination of services, environments, and metrics.
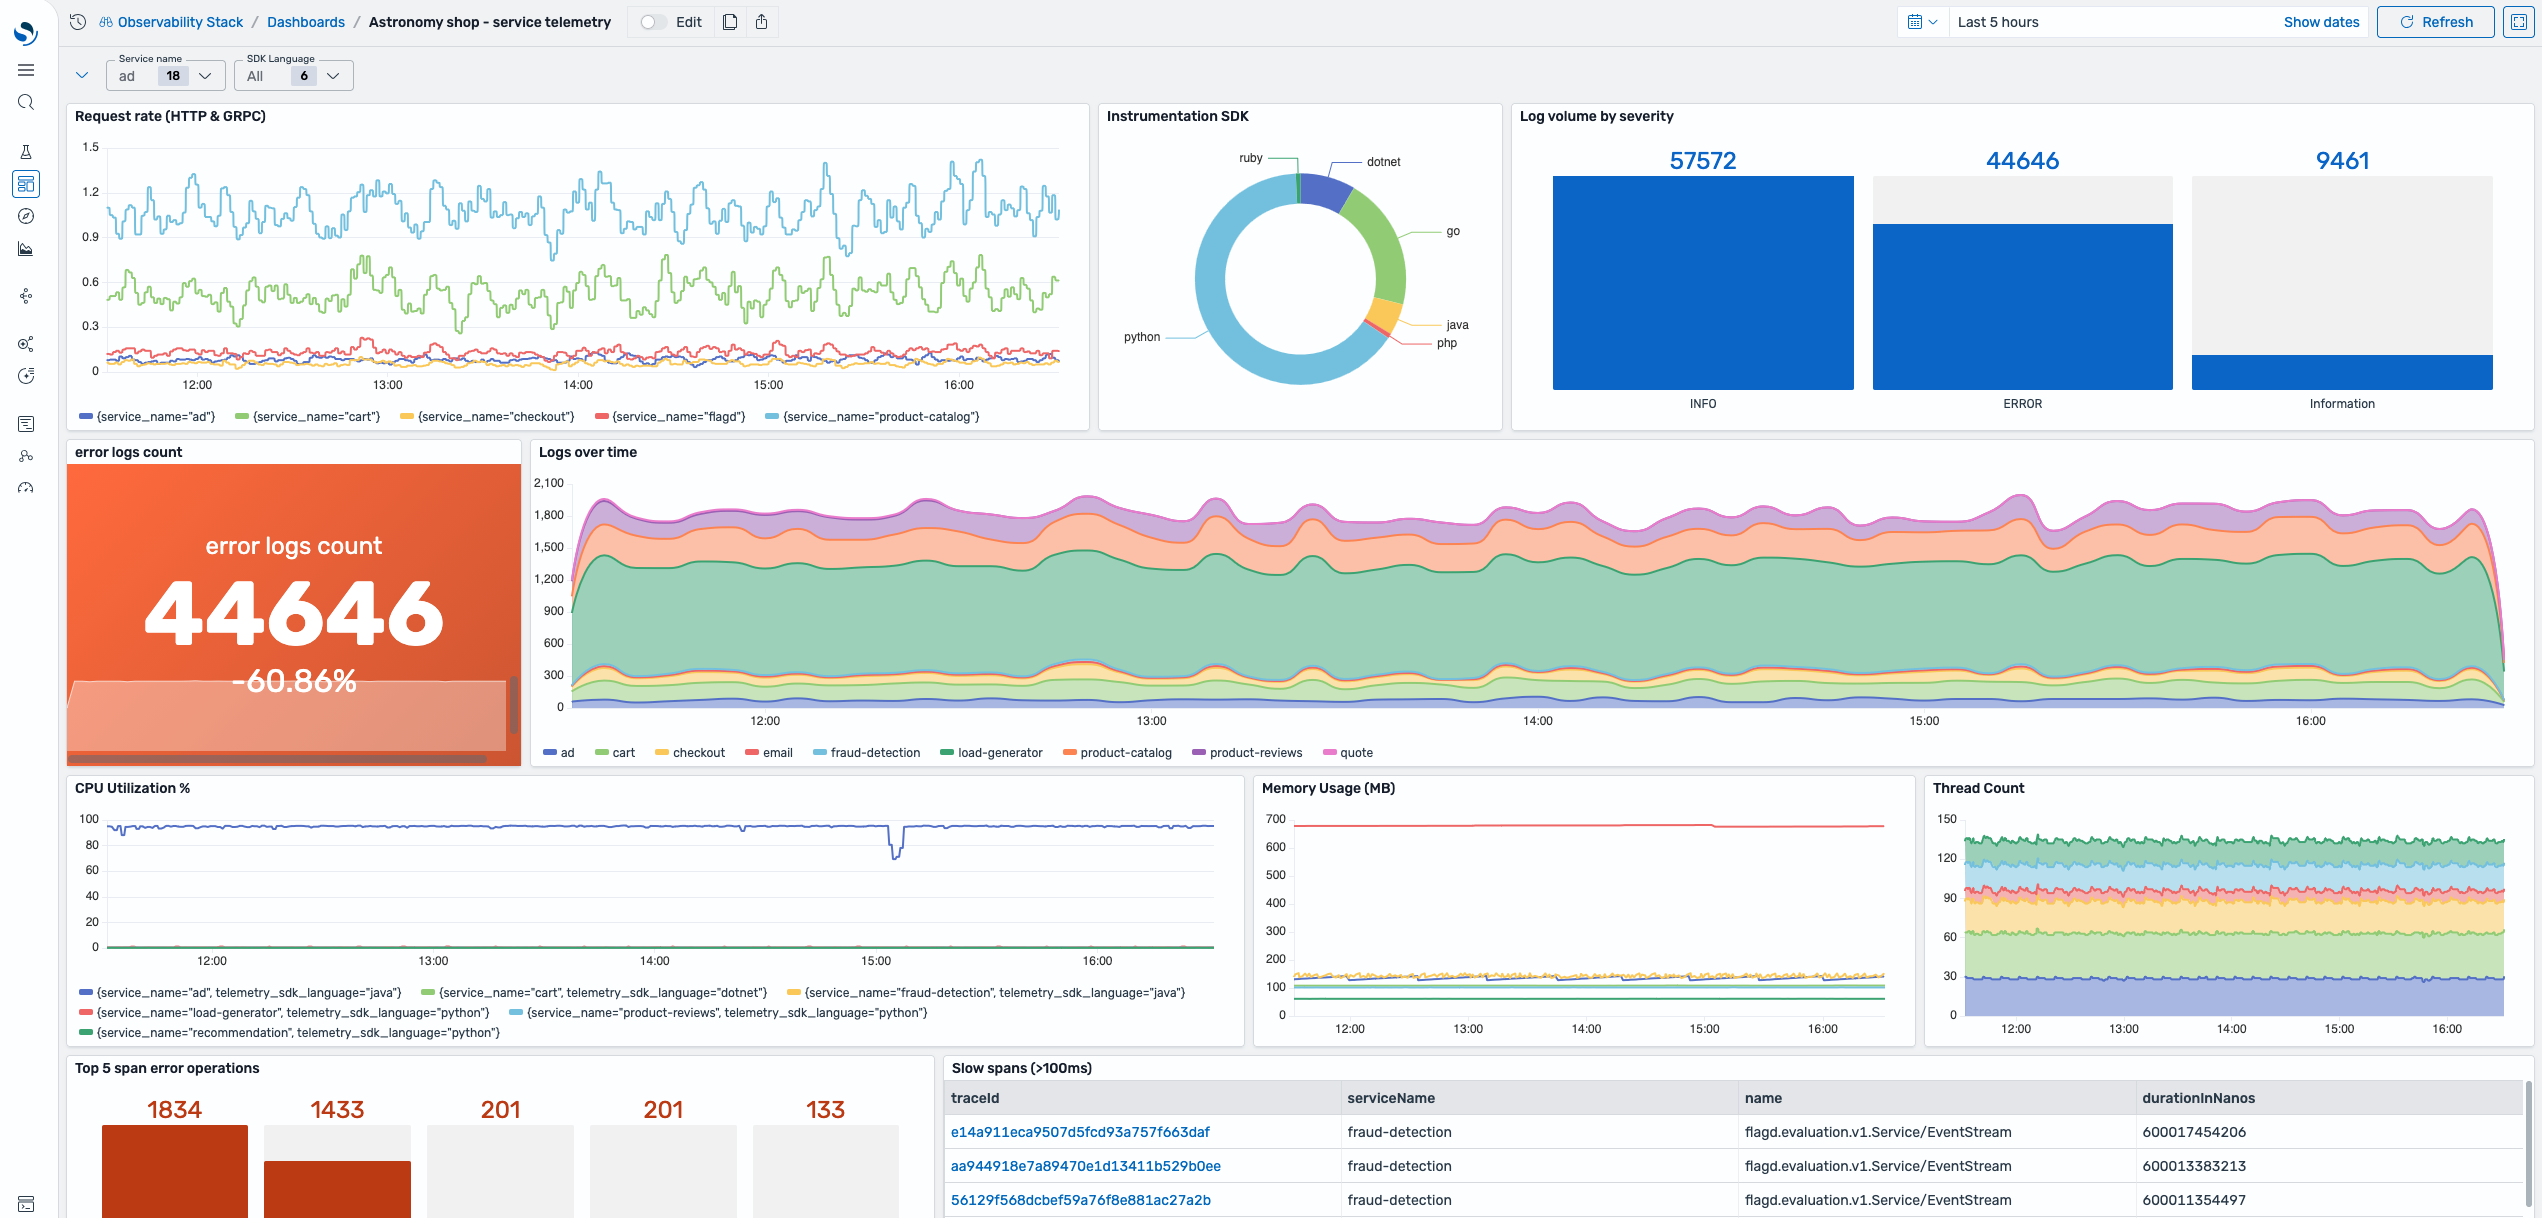 A single parameterized dashboard adapts across services and environments using dropdown variable controls in the header
Reshape query results at runtime by using data transformation
OpenSearch Dashboards now lets you transform query results directly in the visualization editor without rerunning queries. Define a transformation pipeline—including limit, sort, filter, computed fields, and aggregations—that reshapes raw results into new visualizations from a single base query. For metric analysis workflows, transformations can operate across multiple PromQL queries together for richer composite views. The result is faster dashboard development: one well-crafted query can power many visualizations, and adjustments that previously required query changes now happen entirely in the presentation layer.
Search modernization
OpenSearch 3.7 improves search speed, relevance tuning, and AI integration across the stack.
Retrieve vectors up to 5.5x faster with doc values
The OpenSearch vector engine now lets you retrieve k-NN vectors using docvalue_fields during search requests. Previously, vectors were only available through the _source field and required reading, decompressing, and reconstructing the entire stored document. Now you can avoid this overhead and gain significant performance improvements, such as batch nearest-neighbor lookups or reranking pipelines. This is particularly important for workloads that return many vectors per query. For 768-dimensional vectors, this improvement delivers up to 5.5x faster end-to-end search latency at k=1000 and up to 2.5x faster at k=100 compared to standard _source retrieval. This feature works with Lucene and Faiss k-NN engines at all compression levels and requires no reindexing. Vectors are returned in binary format by default for maximum throughput, with JSON arrays also available. For more information, refer to the documentation.
Upload judgment sets directly from the UI in Search Relevance Workbench
Search Relevance Workbench previously required an API call to import relevance judgments—a barrier for product managers and search analysts who aren’t comfortable with REST endpoints. You can now upload a judgment file in the standard format (query, document ID, rating CSV ) directly from OpenSearch Dashboards, the same way you already upload query sets. The upload supports up to 10,000 rows (enough for 1,000 queries at 10 judgments each), making it straightforward to bring in ratings exported from tools like Quepid and immediately use them in experiments without writing a single line of code.
Expand hybrid search optimization with z_score and Reciprocal Rank Fusion
The hybrid optimizer in Search Relevance Workbench now evaluates two additional techniques: z_score normalization and Reciprocal Rank Fusion (RRF). Previously the optimizer tested 66 variants per query—combinations of min_max and l2 normalization, three mean-based combination methods, and 11 weight points. The expanded matrix adds z_score paired with arithmetic_mean (the only mathematically valid combination, because z_score produces negative values) and RRF across five empirically selected rank_constant values, bringing the total to 82 variants per query. The rank_constant list ({1, 5, 10, 20, 60}) was chosen by scanning 15 candidates on a 100K-document corpus and grouping them by retrieval equivalence—values above 40 all produce identical top-10 results, so a single representative (the industry-standard k=60) covers that entire plateau. You can also opt into specific techniques per experiment rather than running the full sweep, so a team focused solely on RRF tuning can request only those five variants and get results faster.
Pass dynamic headers to ML connectors at prediction time
ML connectors integrating with external model services now support per-request dynamic headers. Previously, connector headers were resolved once at creation time, so there was no way to attach unique metadata—such as trace IDs or debug flags—to individual _predict requests. You can now use ${parameters.*} placeholder substitution in connector headers to pass runtime values with each _predict call, enabling production-grade request tracking across hundreds or thousands of model invocations. Security validations block ${parameters.*} on authorization-related headers to prevent credential injection.
Access long-term agentic memory with simplified semantic and hybrid search endpoints
Agentic memory now offers dedicated _semantic_search and _hybrid_search endpoints that accept plain text queries and automatically generate embeddings using the memory container’s configured model. Previously, searching long-term memories required manually generating embeddings, constructing complex k-NN queries, and combining keyword and vector searches. Semantic search uses neural embeddings to retrieve contextually relevant memories even when exact keywords don’t match, while hybrid search combines BM25 keyword scoring with vector similarity using configurable weights to balance precision and recall. Built-in namespace, tag, and filter support ensures that agents retrieve the correct memory slice without custom DSL queries, accelerating RAG patterns and multi-turn reasoning workflows that depend on accurate context recall.
Register agents in one step and converse with multimodal input—now ready for production
The unified agent registration API and the conversational_v2 agent type, both introduced as experimental in recent releases, are now generally available and production ready. The unified registration API collapses the four-step agent setup—connector creation, model registration, agent configuration, and parameter mapping—into a single API call driven by a simple model block, with connector and model resources generated automatically. The conversational_v2 agent type provides a standardized input interface supporting plain text, multimodal content blocks (images, video, and documents), and full message-based conversation history without requiring custom connector configuration. Responses follow a consistent output format, including stop reason, assistant message, memory session ID, and token usage metrics—a standard that will expand to other agent types in future releases.
Scalability and resiliency
OpenSearch 3.7 adds safer policy management, deeper query diagnostics, and finer-grained workload controls.
Dry-run ISM policies before applying them
OpenSearch 3.7 adds a Simulate API for Index State Management (ISM) that lets you preview how a policy would affect your indexes without modifying any cluster state. You can call POST /_plugins/_ism/simulate with either a stored policy ID or an inline policy body and a list of target indexes, and the response reports each index’s current lifecycle state, evaluates every transition condition against live index metrics, and tells you exactly which state the index would move to next. Because ISM policies can include irreversible actions like deleting an index, verifying conditions and state progressions before a policy takes effect gives you confidence that transitions will proceed as expected. The Simulate API supports wildcard index patterns, works with both managed and unmanaged indexes, and accepts inline policy bodies so you can validate a policy before you even save it.
Profile slow-performing queries directly from Query Insights
Query Insights already presents your slowest queries ranked by latency, CPU, or memory, but until now, investigating why a query was slow meant switching to the Profile API and manually correlating results. OpenSearch 3.7 adds a query profiler tool to OpenSearch Dashboards Dev Tools. This tool provides a split-pane editor where you can enter a query on the left and see the full profiling breakdown on the right, including color-coded execution timing, shard-level performance detail with pagination, and a collapsible query hierarchy—with controls to import saved queries and export results. More importantly, the Query Details page now includes an Open in Profiler option that preloads the query and launches the profiler in one click, so the the complete workflow—from spotting a slow query to inspecting its execution breakdown—stays inside OpenSearch Dashboards.
Enhance Workload Management with per-group search settings
OpenSearch Workload Management (WLM) now supports per-group setting overrides. Previously, many search settings could only be configured at the cluster level or per request. With WLM groups, cluster admins can now control settings such as search timeout, cancel interval, and the maximum number of buckets. Limits are automatically applied to all requests routed to the group. This is a major improvement for multi-tenant domains, giving you finer-grained, per-tenant control and better protection against overly permissive request parameters.
Security and infrastructure
OpenSearch 3.7 strengthens access control with scoped, credential-level permissions.
Scope security permissions directly to API keys
OpenSearch 3.7 introduces API keys, providing cluster and index permissions directly associated with the key. Unlike existing authentication methods that derive access from a user’s roles, API keys let security admins issue scoped, long-lived credentials with only the permissions the key actually needs. You create a key, specify its allowed actions and index patterns, and receive an opaque credential that enforces least privilege independently of the issuing admin’s own role set. Keys support configurable expiration, synchronous cluster-wide revocation, and automatic system index protection. This makes them well suited for service-to-service communications and CI/CD pipelines that index data or run queries.
Getting started
OpenSearch 3.7 is available now in a variety of distributions and ready for you to explore on OpenSearch Playground. You can learn more in the release notes, documentation release notes, and updated documentation. As always, your feedback is appreciated in our community forum and the project’s Slack instance. Happy searching!
Special thanks to community member Himanshu Ramchandani, senior data engineer at Sonos and OpenSearch Ambassador who volunteered to serve as Release Manager for OpenSearch 3.7, for his contributions to the success of this release process.