
| TL;DR: The new OpenSearch data source plugin for Perses (released in Perses 0.54.0) lets you query and visualize OpenSearch logs directly in Perses dashboards using Piped Processing Language (PPL). It ships with recent Perses releases, routes requests through the Perses proxy so your credentials stay server-side, and bounds queries to the dashboard time range. At SAP Cloud Infrastructure, this makes Perses a single view for on-call responders: logs, metrics, and traces share one dashboard, so there’s no tool hop to OpenSearch Dashboards during incidents. Query DSL, SQL, and DQL/Lucene support are planned next. |
In this blog post, we’ll introduce the OpenSearch data source plugin for Perses. The plugin was released with Perses version 0.54.0 and lets you query and visualize log data stored in OpenSearch directly in Perses dashboards using Piped Processing Language (PPL). To be clear, this is a plugin for Perses, not an OpenSearch cluster plugin: it points Perses at your existing OpenSearch cluster and reads your log data.
OpenSearch is a common home for logs, but dashboards for metrics and traces often live somewhere else. Perses is an open, vendor-neutral dashboarding project with strong support for metrics and traces. The plugin brings your OpenSearch logs into that same view, so you can keep your data in OpenSearch while seeing it alongside the rest of your telemetry.
The following dashboard shows the intended workflow: a service-scoped view with metrics, logs, and traces in one place.

Why query OpenSearch logs from Perses?
Logs are usually where an investigation ends, and they carry the detail that metrics and traces don’t. Bringing OpenSearch logs into Perses means you can:
- Reuse the OpenSearch indexes and PPL queries that you already use.
- Put logs next to metrics and traces in one open dashboard without moving log data out of OpenSearch.
What the plugin does
The plugin adds an OpenSearch data source and an OpenSearch log query to Perses. A few things are worth knowing:
- Ships with Perses. Recent Perses releases bundle the plugin, so there’s nothing extra to install. You add a data source and start querying.
- Runs through the Perses proxy. Requests go from your browser to the Perses server, which forwards them to OpenSearch. Your OpenSearch credentials stay on the server and never reach the browser, and there’s no CORS setup to do.
- Applies automatic time filtering. Your PPL query is automatically bounded to the dashboard’s time range, so panels follow the time picker without extra work.
- Supports flexible field mapping. OpenSearch indexes name fields differently depending on the exporter, so the plugin detects common timestamp and message fields and lets you override them per query.
Querying OpenSearch logs with PPL
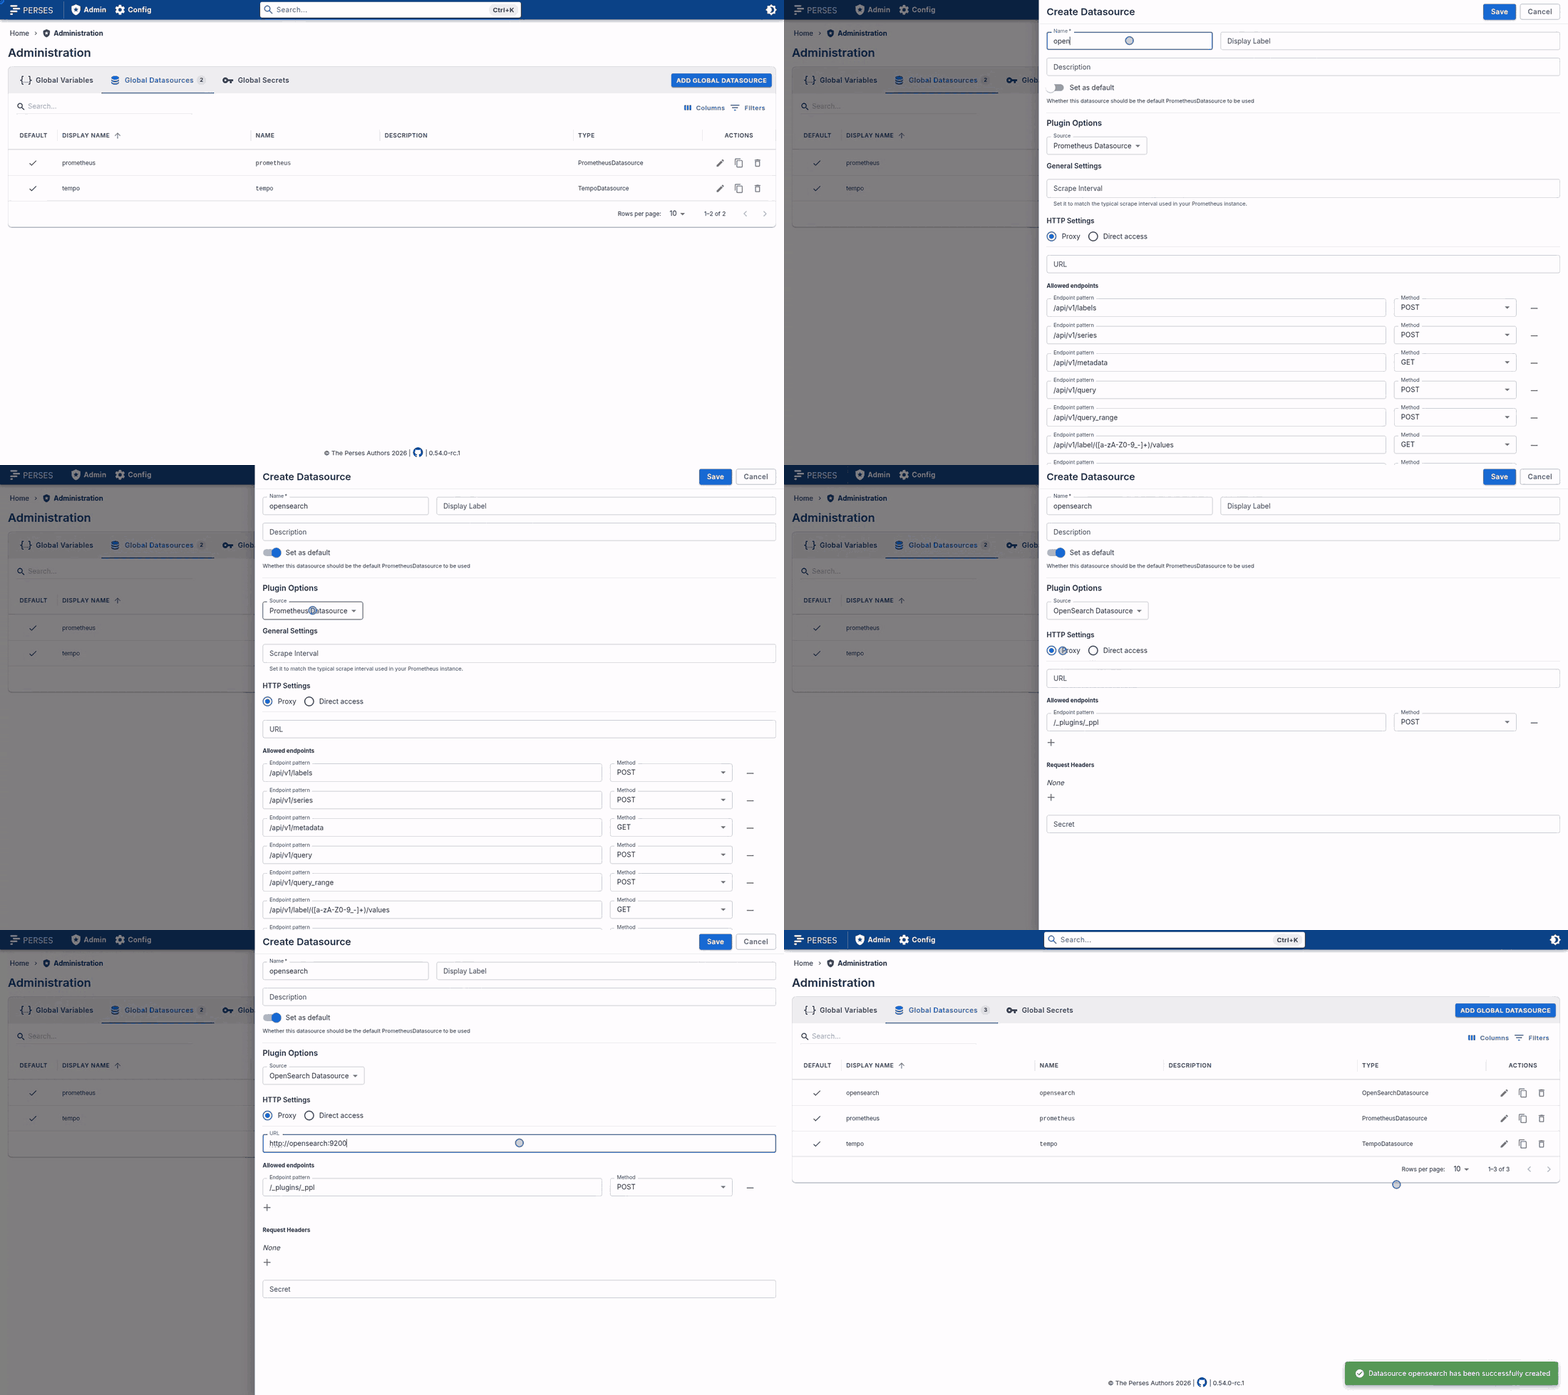
Getting started takes two steps. First, add an OpenSearch data source in Perses and point it at your cluster. The plugin uses the OpenSearch SQL/PPL plugin, which is included with OpenSearch. Then add a panel and write a PPL query.
The following animation shows the data source setup in Perses.
For example, the following query shows recent errors:
source=otel-logs-* | where severityText='ERROR' | sort - `@timestamp`The query editor lets you choose the OpenSearch data source, enter the PPL query, override timestamp or message fields when needed, and preview matching log lines.
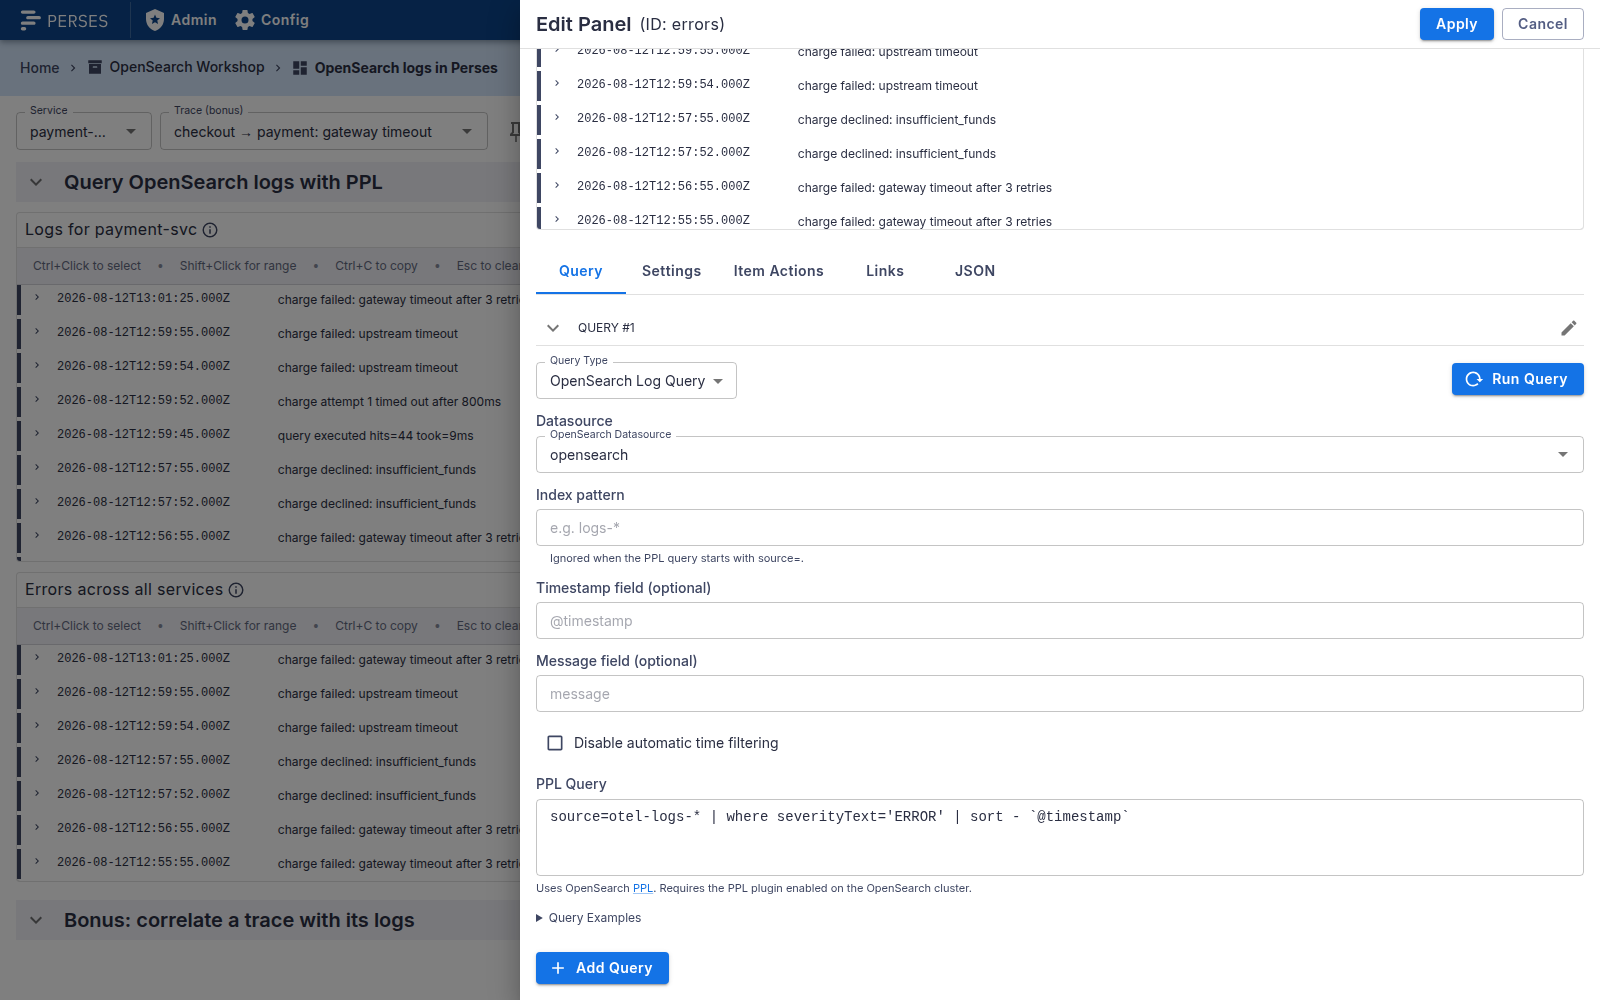
The panel runs your query against OpenSearch and renders the matching log lines. From there, PPL does the rest: filter with where, project columns with fields, or aggregate with stats. These examples were tested with OpenSearch 2.19.
Correlating traces with logs
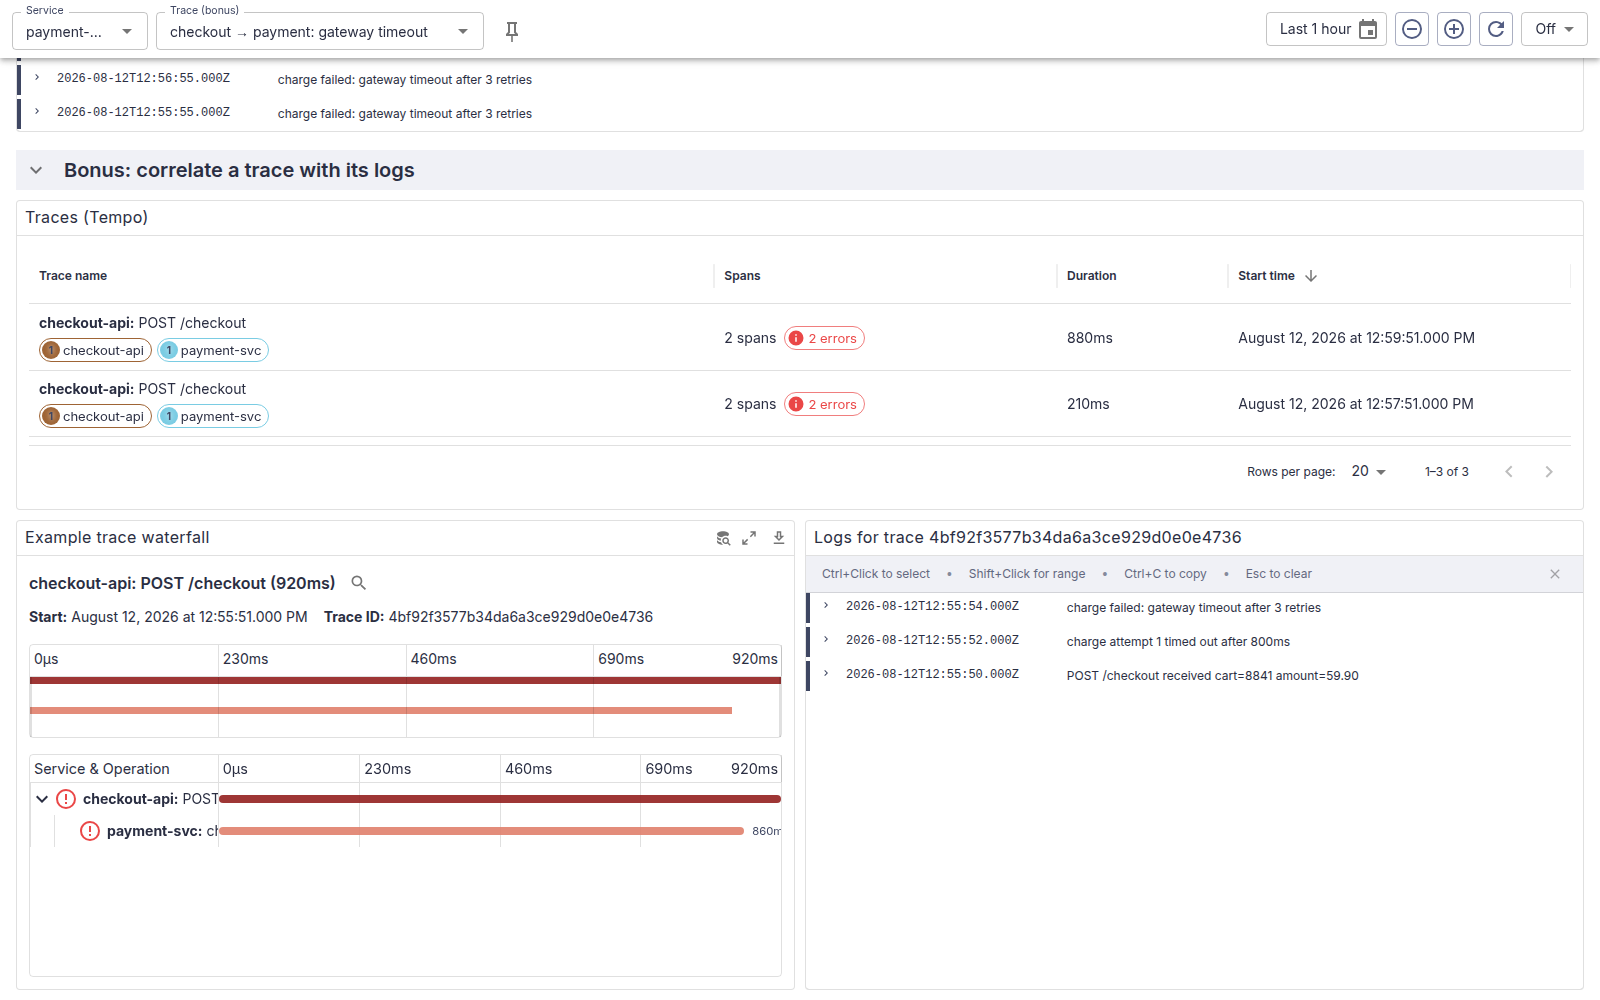
Because a trace ID is just another field on your log documents, you can filter to a single request:
source=otel-logs-* | where traceId='<your-trace-id>’
Put a trace panel and an OpenSearch log panel on the same dashboard, drive both from a shared dashboard variable, and you can move from a trace straight to the logs that explain it.
OpenSearch logs in Perses at SAP Cloud Infrastructure
At SAP Cloud Infrastructure, the goal is to make Perses the single visualization layer for metrics, logs, and traces, so on-call responders have one place to look regardless of where the data lives.
Closing the gap between metrics and logs
Today, metrics live in Perses, while logs and traces live in OpenSearch. When an alert fires, the on-call responder reads the metric in one tool, then switches to OpenSearch Dashboards to find the matching logs and traces. That context switch costs time and adds cognitive load during incidents.
Using OpenSearch as a Perses data source removes that tool hop. Metrics sit next to OpenSearch logs and traces on the same dashboard, share the same time picker, and respond to the same variables, so the correlation that used to span two UIs happens in one.
One dashboard for on-call investigations
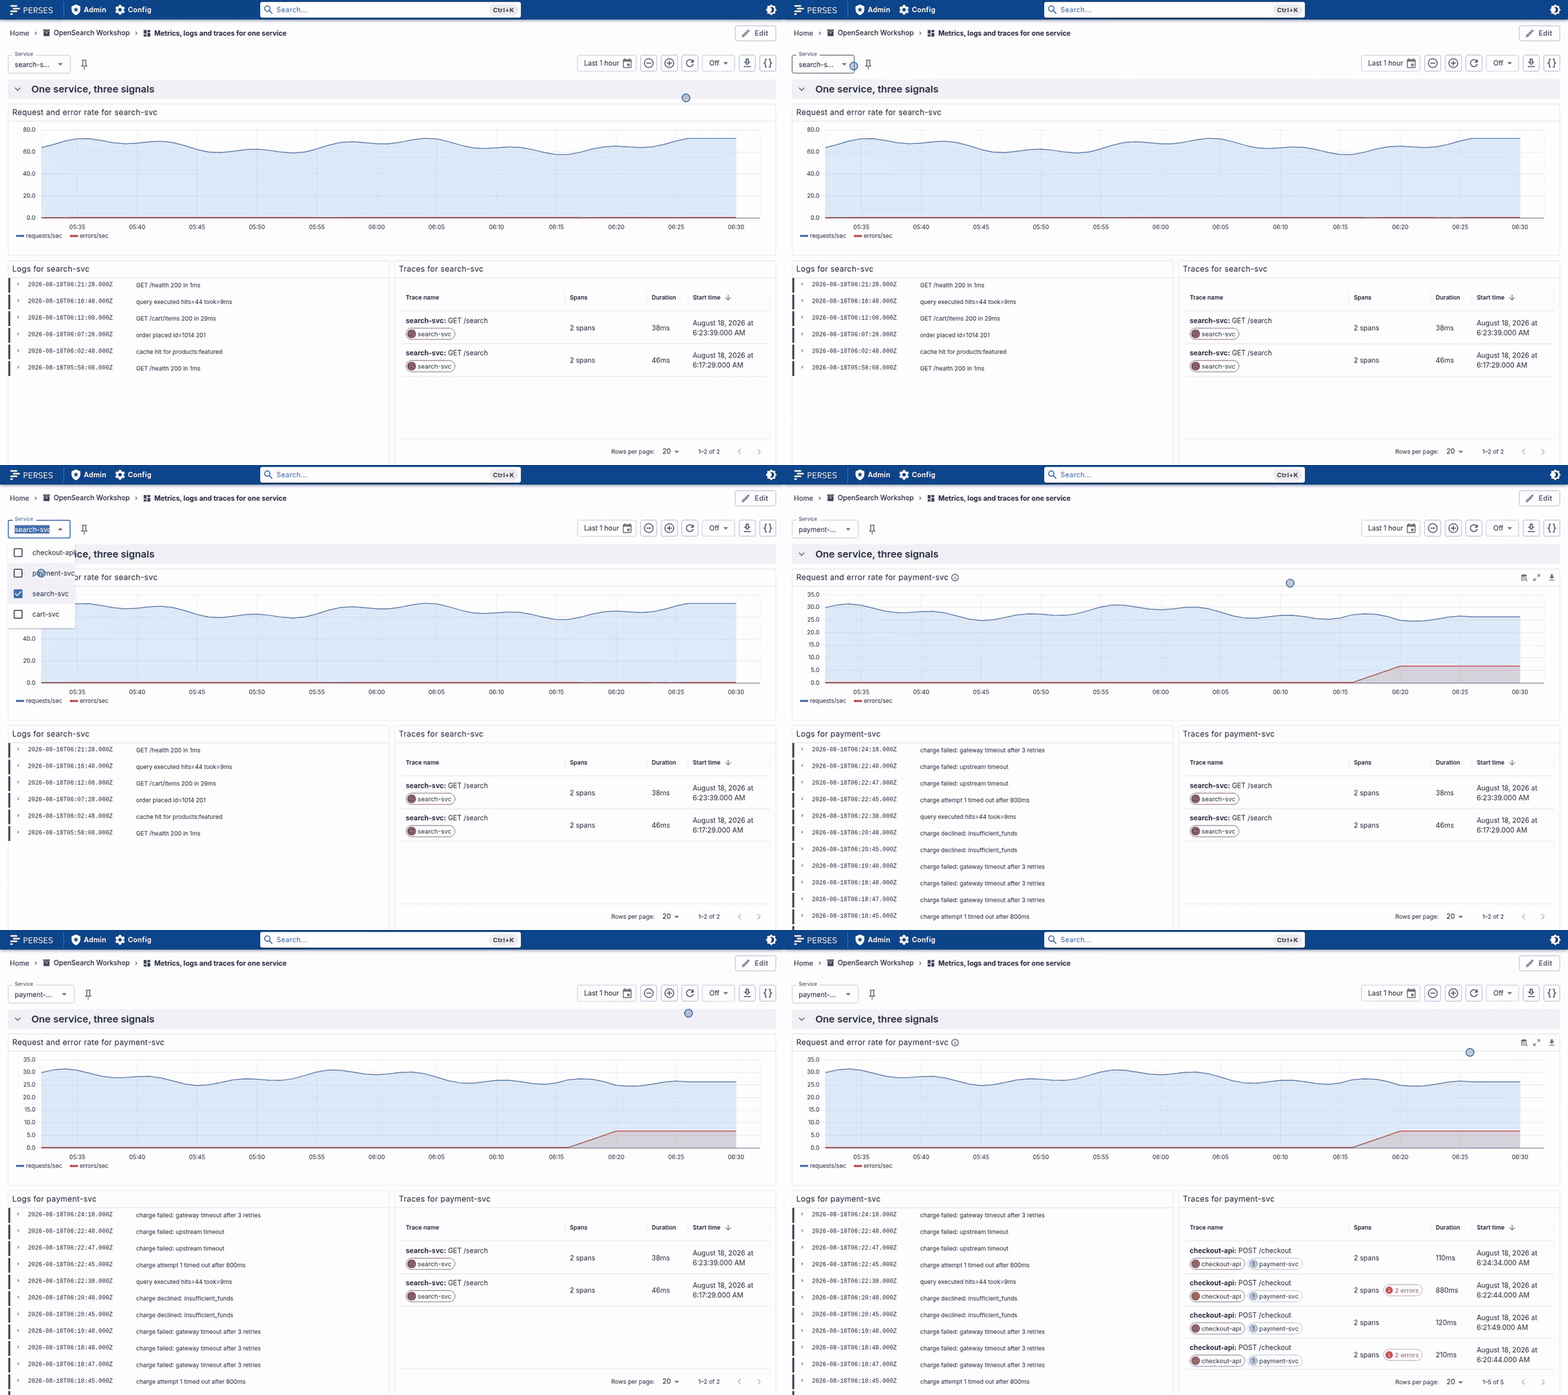
A metrics panel shows the spike, such as a rise in error rate or latency. A service variable at the top scopes every panel, so selecting the affected service narrows the OpenSearch log and trace panels to the failing requests without editing a query. A trace ID on a log line or span links back to the full request, so you know where to look next.
The following animation shows how changing the service variable updates the dashboard panels together.
What we plan to contribute next
This is a first iteration. Today, the plugin speaks PPL, which covers the log queries above. We plan to contribute more, including support for additional query languages:
- Query DSL for aggregations and Trace Analytics indexes.
- SQL for tabular results and exports.
- DQL/Lucene for quick ad hoc filtering.
Beyond dashboards: the Perses MCP server
The Perses MCP server now supports querying any configured data source through the Perses proxy. This means an AI assistant can run PPL queries against OpenSearch the same way a dashboard panel does.
OpenSearch also has its own MCP support. The OpenSearch MCP server exposes cluster operations as tools that an AI assistant can call directly. By default, these include ListIndexTool, IndexMappingTool, SearchIndexTool (Query DSL), CountTool, MsearchTool, ExplainTool, and ClusterHealthTool. For more information, see MCP server APIs.
Next steps
Try it out: run a recent version of Perses, add an OpenSearch data source, and point a panel at your logs with PPL. To go deeper, see the Perses documentation and the OpenSearch PPL reference.