
TL;DR: The OpenSearch Observability Stack deploys a single OpenTelemetry-native platform that stores metrics, traces, and logs together in one correlated store. This post walks through a full root cause analysis on a deliberately failing microservice, following the investigation from an error spike on the Services page through the trace waterfall to the exact log line that names the failure, all without leaving the UI. |
Every incident starts the same way: something is wrong, and your signals are scattered. The error rate is in one tool, the slow trace (if you captured it at all) lives somewhere a third team owns, and the log line that explains it is in a fourth. The minutes you spend pivoting between tabs and reconciling timestamps are minutes the incident continues.
The OpenSearch Observability Stack is built to eliminate that gap: one OpenTelemetry-native platform where metrics, traces, and logs for every service, including AI agents, are stored together and stay correlated. In this first post of the series, we’ll deploy the entire stack, run a real microservices application with one service deliberately failing, and chase that failure from a spike on the Services page all the way down to the log line that names the root cause, without ever leaving the UI.
Configuring the stack
The stack runs on your machine. One command pulls and starts all components:
curl -fsSL https://raw.githubusercontent.com/opensearch-project/observability-stack/main/install.sh | bash
The installer verifies the prerequisites, configures the stack, and starts five preconfigured open-source components:
- OpenTelemetry Collector receives OpenTelemetry Protocol (OTLP) traces, logs, and metrics and routes them downstream.
- Data Prepper processes trace spans, builds the service map, and computes Rate, Errors, Duration (RED) metrics.
- OpenSearch indexes and stores traces and logs.
- Prometheus stores time-series metrics, which you can query using PromQL.
- OpenSearch Dashboards is the UI for the Application Performance Monitoring (APM) views: services, service map, traces, and logs.
When the installer finishes running, open OpenSearch Dashboards at http://localhost:5601. Credentials are stored in the .env file at the install root. This is a development configuration, so secure it before exposing it to external traffic; see the production readiness notes.
For a realistic incident to investigate, enable the OpenTelemetry Demo, the community’s “Astronomy Shop”: more than a dozen microservices with a built-in load generator. The simplest way to enable it is to answer Y when the installer prompts you to add the OpenTelemetry Demo:
Include OpenTelemetry Demo? (requires ~2GB additional memory) (Y/n): Y
If the stack is already installed, the demo is also controlled by a single line in .env at the install root:
INCLUDE_COMPOSE_OTEL_DEMO=docker-compose.otel-demo.yml
After adding this line, restart the stack by running docker compose down && docker compose up -d.
The demo ships with feature flags that inject realistic faults. To mimic a realistic incident scenario, enable adFailure, which makes the ad service return gRPC UNAVAILABLE. This simulates a site reliability engineer (SRE) receiving an alert about a failing service and investigating the root cause using only the available telemetry.
From symptom to root cause
The investigation follows a standard root cause analysis (RCA) path: start with the metrics that tell you that something is wrong and, roughly, where, narrow to the failing requests in the traces, then confirm with the logs. Each step is one screen, and each links directly to the next.
Step 1: Spot the error spike on the Services page
Open the Services page under APM. This is the service catalog that lists every service emitting telemetry, along with the service’s latency, throughput, and failure rate, computed by Data Prepper as RED metrics. Start with the Top services by fault rate panel, as shown in the following image. For more information, see the Services documentation.
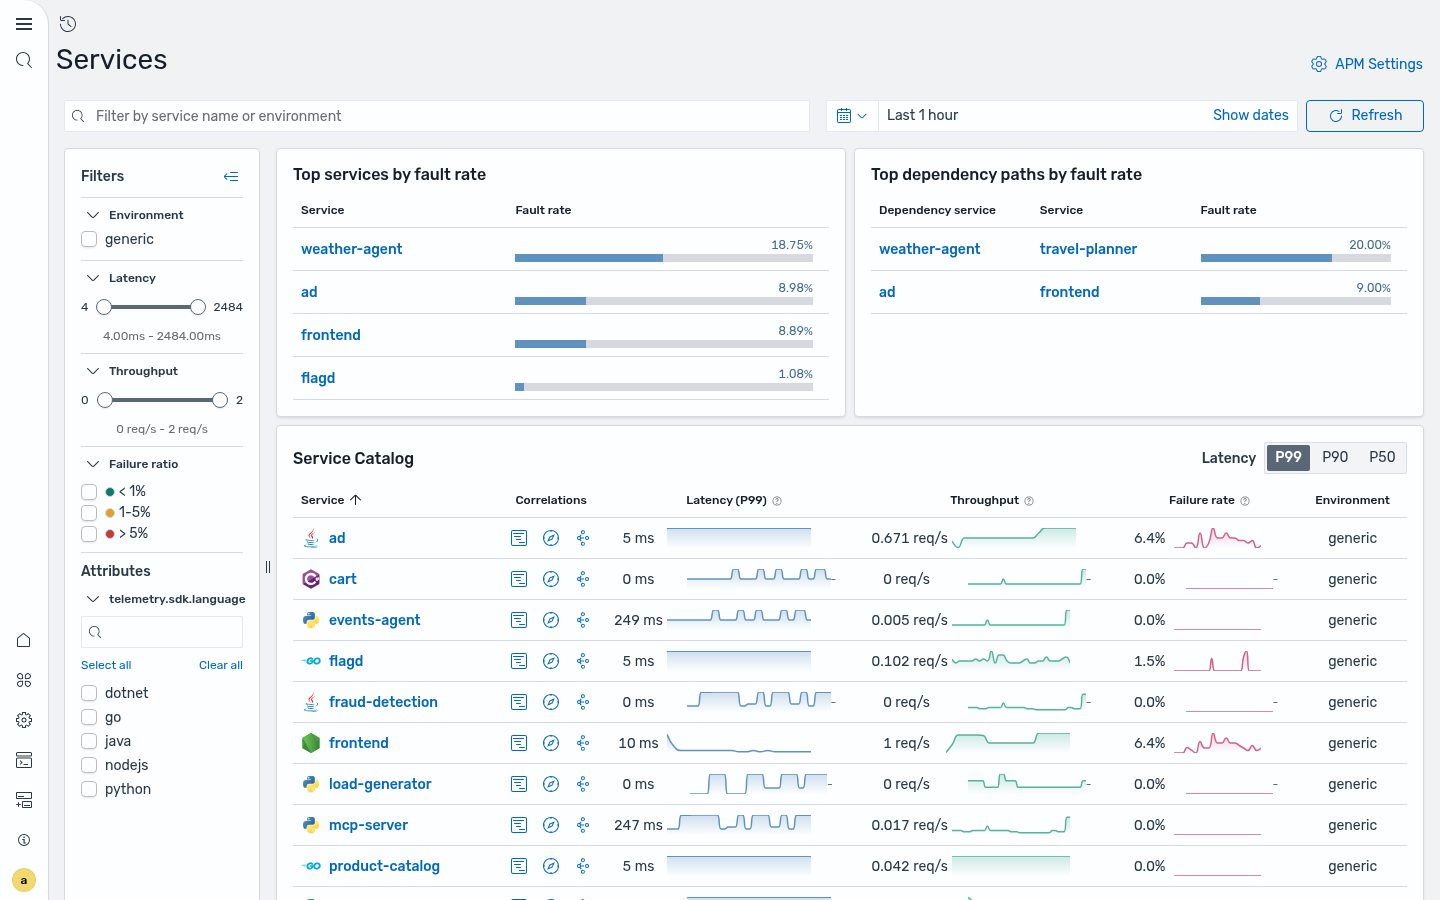
ad is near the top of the fault-rate panel, the ad → frontend dependency path is failing, and the ad row in the Service Catalog carries a failure-rate sparkline that is trending upward. The metrics identify the failing service.
Step 2: See the failure in the topology and read the RED metrics
To see how the service relates to the wider system, select View service map in the ad row. This opens the Application Map focused on ad, as shown in the following image. The topology is generated automatically by Data Prepper from trace data, so you don’t need to configure anything. For more information, see the service map documentation.
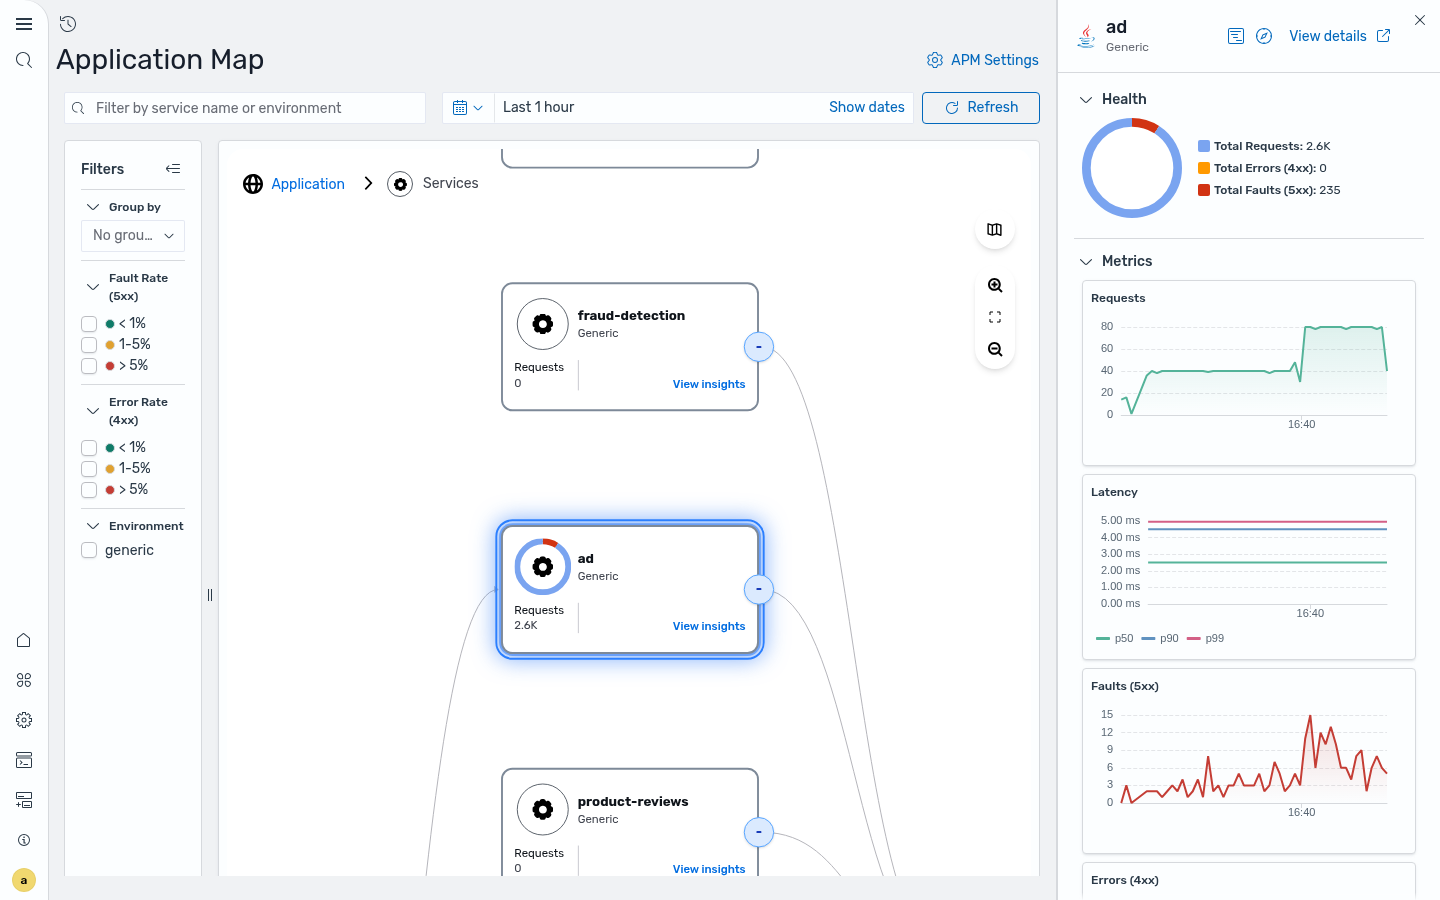
The ad node is no longer green: its health indicator carries a red fault segment, and the frontend → ad edge makes the impact scope concrete, because the storefront depends on a service that’s failing. Select the ad node and choose View insights. The flyout displays the RED metrics for ad: hundreds of faults out of a few thousand requests, with a Faults (5xx) chart that spikes exactly when the failure began. You’ve localized the failure to a single service and its downstream dependency.
Step 3: Inspect failing spans in the service flyout
To understand why the service is failing, examine the traces. From the same flyout, the Correlated spans tab displays the most recent spans for the ad node without leaving the map, as shown in the following image.
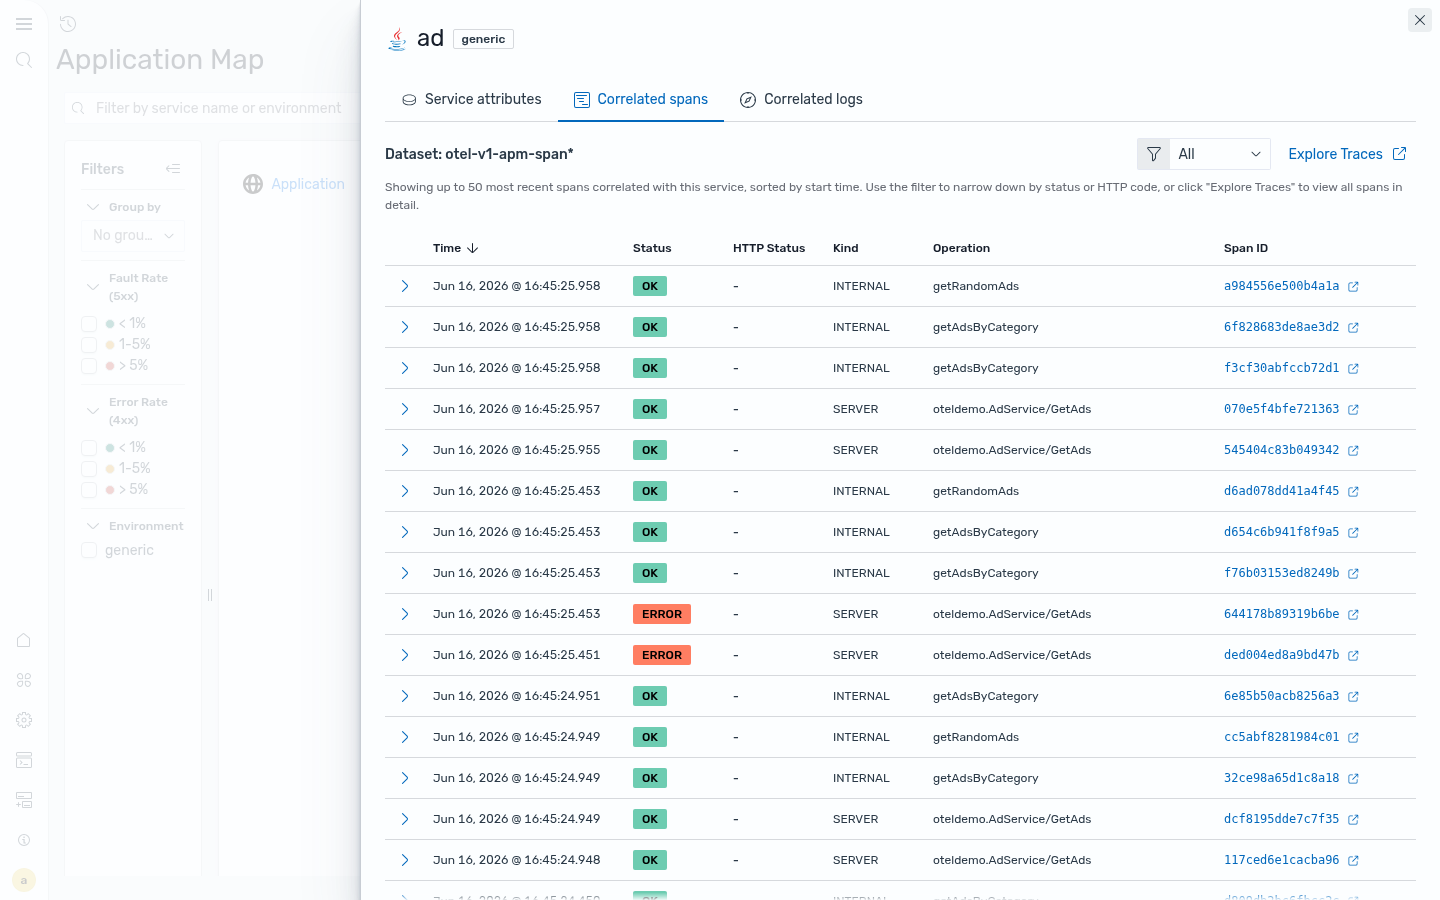
The correlated spans confirm the failure at the request level: the oteldemo.AdService/GetAds SERVER spans are returning an ERROR status. This is the connection from “the metrics say ad is unhealthy” to “here are the exact requests that failed.”
Step 4: Find the failing spans in trace analytics
To investigate further, open Traces under Application Performance (the Explore Traces page). The page displays a span table with RED metrics across the top: a Request count histogram, an Error count histogram that’s clearly spiking, and Avg latency. Filtering to the failing service with a one-line Piped Processing Language (PPL) query, source = otel-v1-apm-span* | where resource.attributes.service.name = 'ad' and status.code = 2, leaves only the oteldemo.AdService/GetAds spans that returned an error, as shown in the following image.
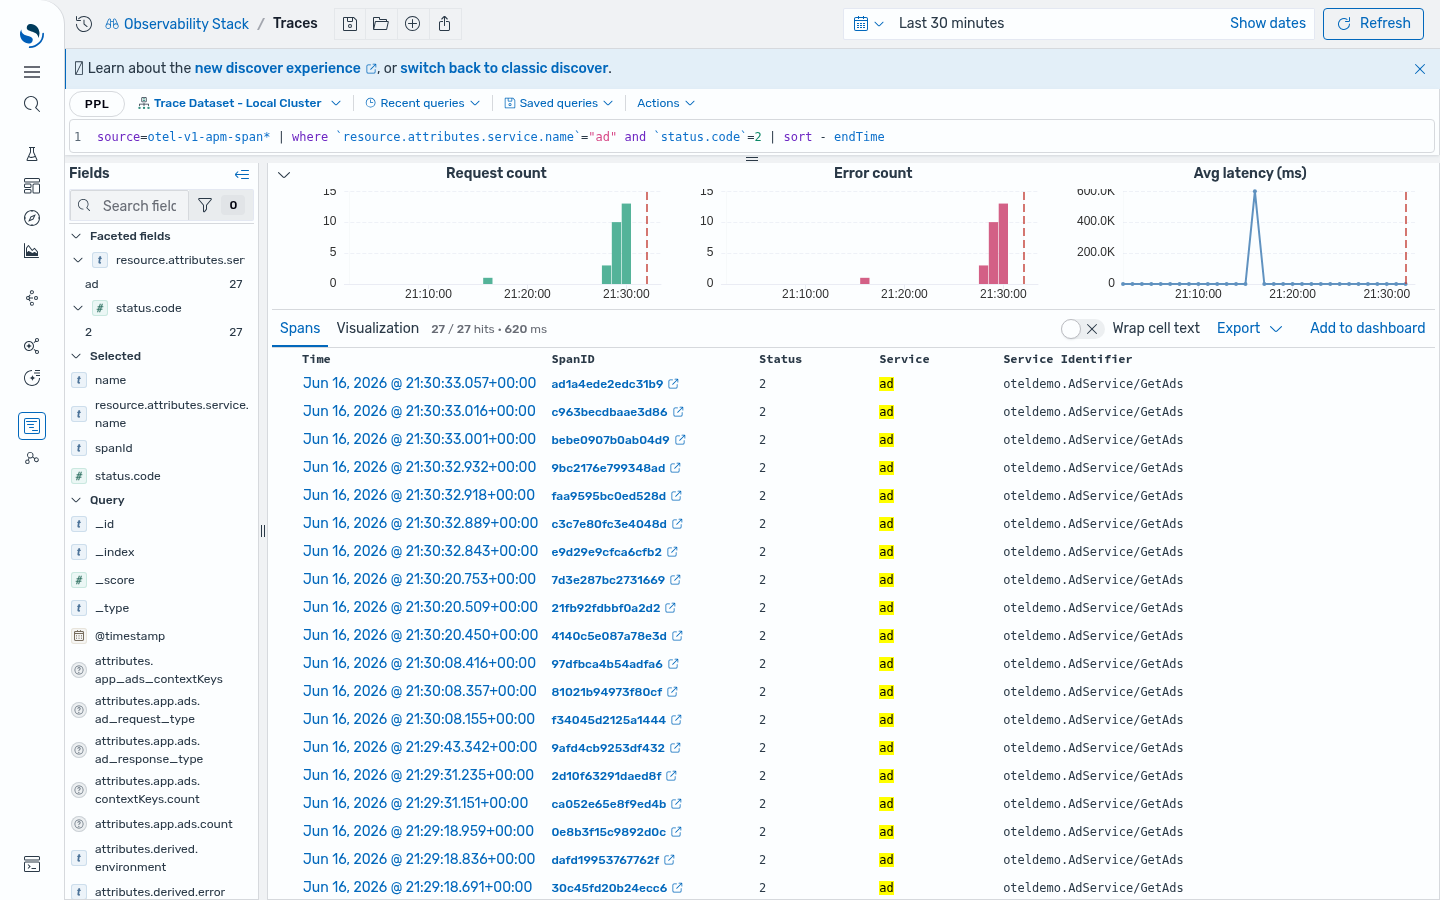
Every row is a failed GetAds call on the ad service.
Step 5: Read the trace waterfall and the error on the span
Select the SpanID of any error span to open the trace details view: a Gantt Timeline of every operation in the request on the left, and a Span details panel on the right for the selected span, as shown in the following image.
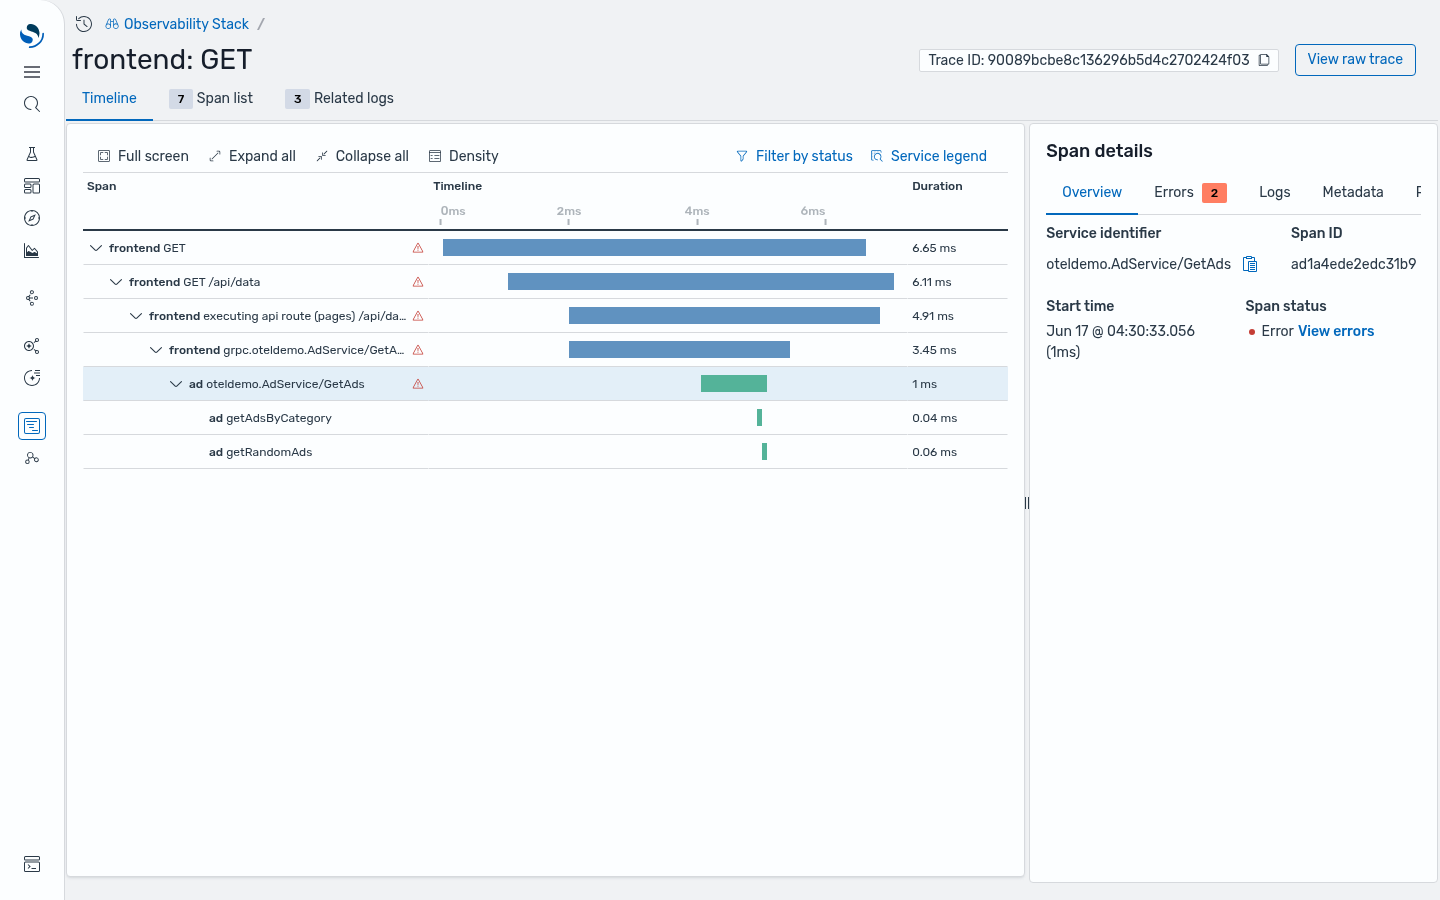
The waterfall shows the whole chain of affected calls in one view: frontend GET → GET /api/data → grpc.oteldemo.AdService/GetAds → the ad service’s own oteldemo.AdService/GetAds span, and every span on the path carries an error marker. The failure starts at the bottom of the tree, in ad, and propagates up to the customer-facing request. Open the Errors tab in the Span details panel to read what the span recorded, as shown in the following image.
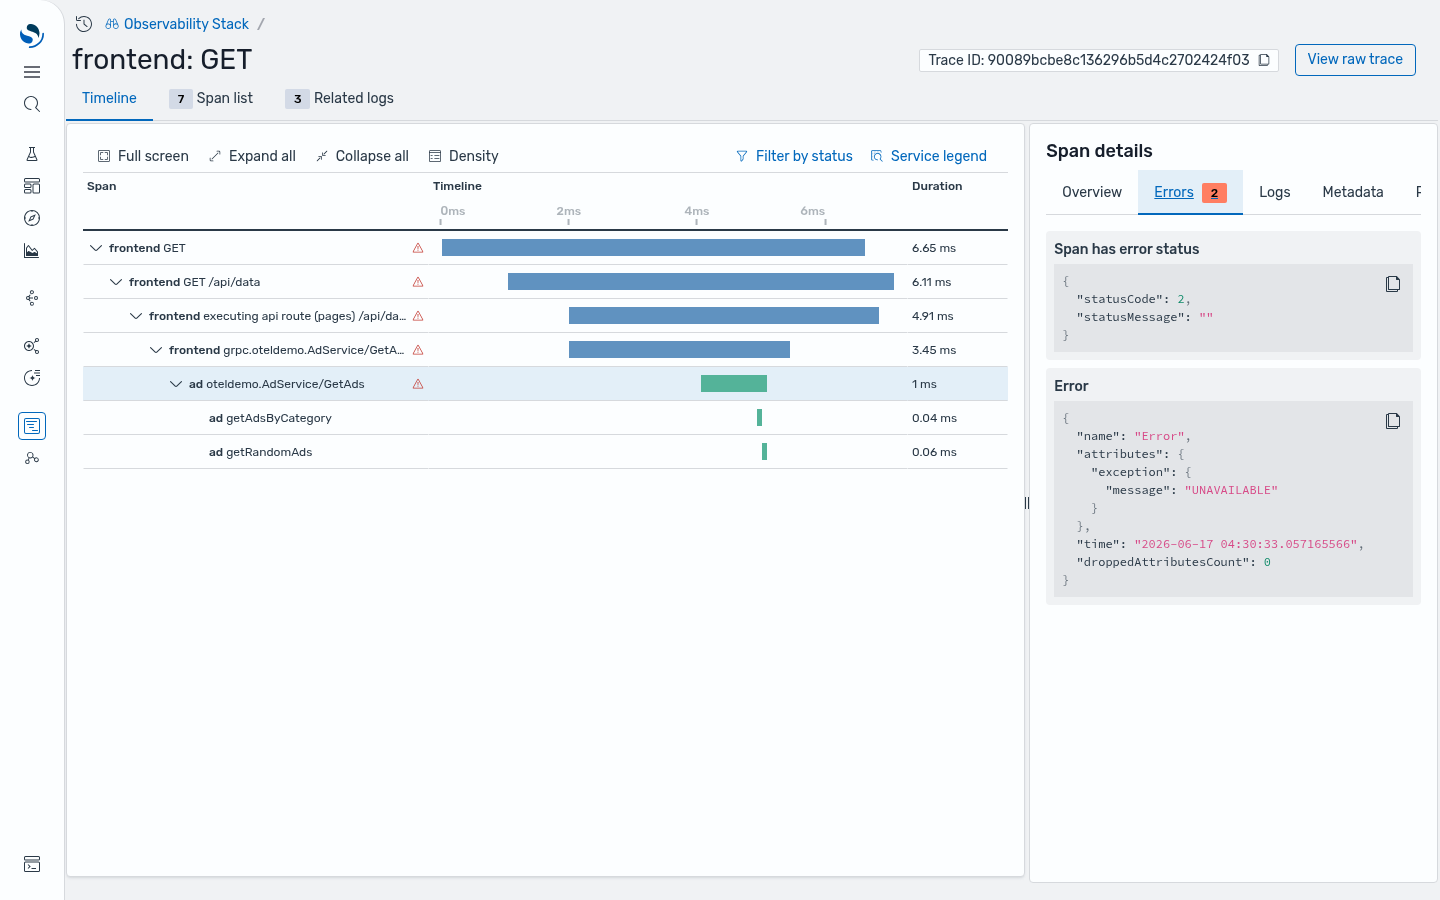
The error is in the request itself, not inferred from a dashboard average: a recorded exception with the message UNAVAILABLE and statusCode: 2, captured the moment the call failed. You now know which service is failing, which operation is affected, and what error it returned.
Step 6: Corroborate with the service’s logs
To confirm the error using the service’s own logs, open the Logs tab in the Span details panel. It shows the Related logs for span: the ad service’s own log lines, correlated to this exact span by span ID. The top one is already a WARN. To read the full line and widen the search, select View in Discover Logs.
This opens the Explore Logs page, pre-filtered to the same trace ID and span ID, so the relevant log line appears without requiring an additional query. Expand the log entry to read the full record, as shown in the following image.
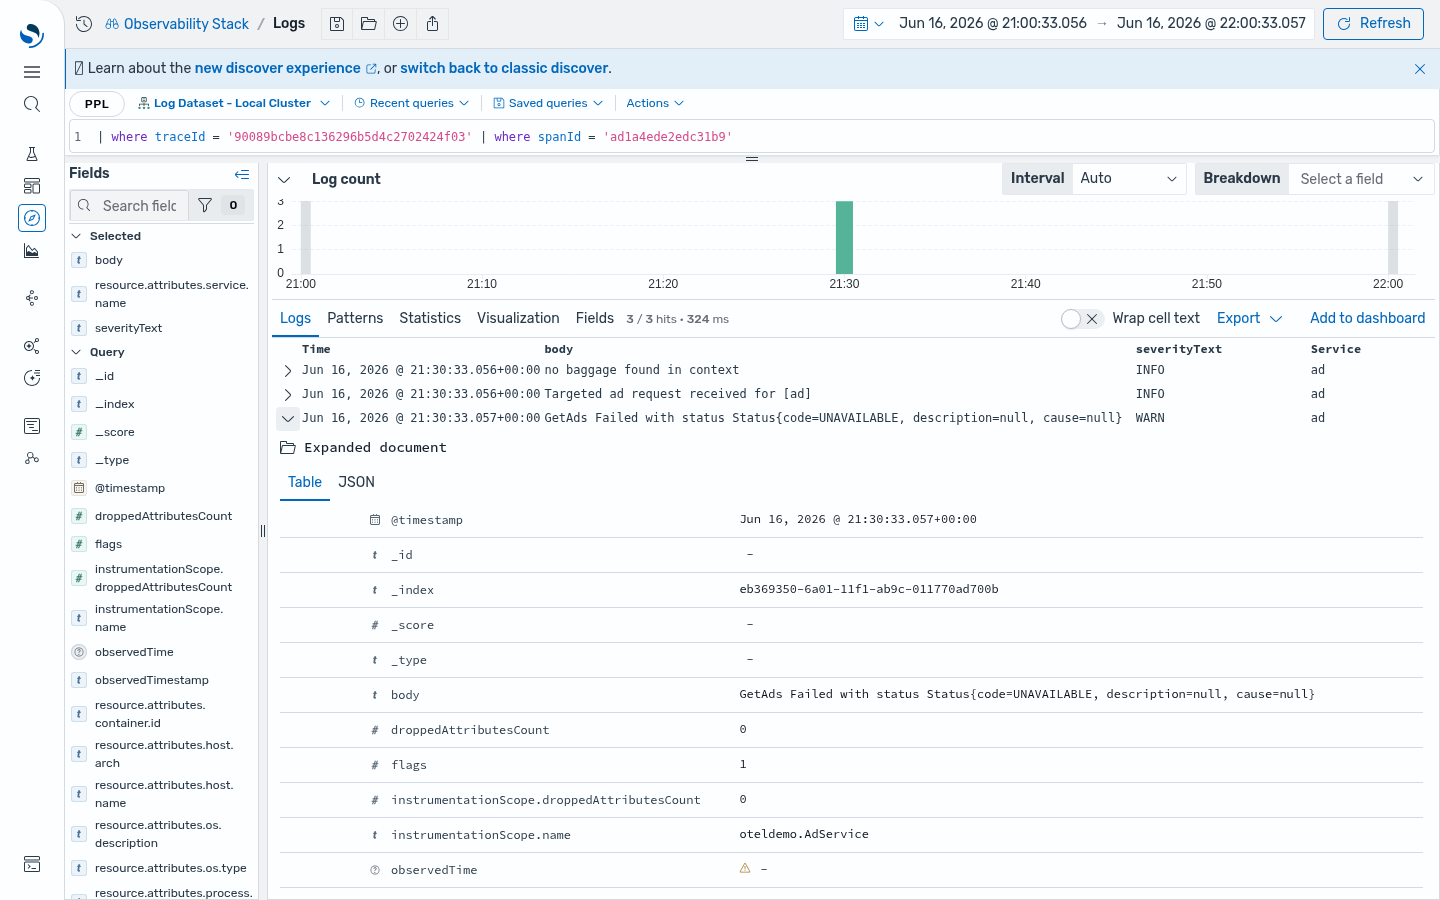
The expanded document states the error emitted by oteldemo.AdService: GetAds Failed with status Status{code=UNAVAILABLE, description=null, cause=null}. From here, you can broaden the search using PPL to see every occurrence of this error. The trace-to-log correlation, with no context switch, is the benefit of a single OpenTelemetry-native platform.
You’ve now identified the root cause: the ad service is returning a gRPC UNAVAILABLE error on GetAds calls, and the storefront propagates these errors as customer-facing failures. You followed a complete metrics-to-traces-to-logs path: you identified the failing service on the Services page, isolated the exact error span in Explore Traces, and confirmed the failure in the service’s own output using Explore Logs.
Benefits of a unified observability platform
This walkthrough demonstrates the following capabilities of the OpenSearch Observability Stack:
- Unified signals: Metrics, traces, and logs are stored in one OpenTelemetry-native store, so an investigation never requires reconciling timestamps across disconnected tools.
- Rapid issue identification: The Services fault-rate panel and the autogenerated topology map identify the unhealthy service before you’ve formed a hypothesis.
- In-context correlation: The service flyout’s View insights and Correlated spans tabs, plus the span’s Logs tab, let you navigate from RED metrics to the failing spans to the log lines by selecting each tab.
- Root cause on the request itself: The Explore Traces waterfall shows every affected call, and the span displays the concrete error (
UNAVAILABLE) rather than a dashboard average. - Reproducible faults: The OpenTelemetry Demo’s feature flags let you inject a known failure and practice the exact RCA workflow you’ll run in real life.
- One platform, end to end: The service catalog, topology map, RED metrics, trace waterfall, span-level errors, and correlated logs are available in a single platform, the OpenSearch Observability Stack. No separate tools to combine, no context switching, no timestamp reconciliation. Deploy once, and every signal is already connected.
What’s next?
To continue exploring the OpenSearch Observability Stack, consider the following:
- Try it yourself: Run the installer, answer
Yto add the OpenTelemetry Demo, enable theadFailureflag, and follow this walkthrough, then try investigatingpaymentFailureorcartFailure. - Instrument your own services: Point any OpenTelemetry SDK at
http://localhost:4317(gRPC) orhttp://localhost:4318(HTTP) and your services join the same service map and trace views. See the instrumentation examples. - Watch for more blog posts in this series: Upcoming posts will cover PPL log queries, the service map, trace analytics, AI-agent observability, and more.
Learn more in the OpenSearch Observability Stack documentation.