You're viewing version 2.0 of the OpenSearch documentation. This version is no longer maintained. For the latest version, see the current documentation. For information about OpenSearch version maintenance, see Release Schedule and Maintenance Policy.
Operational panels
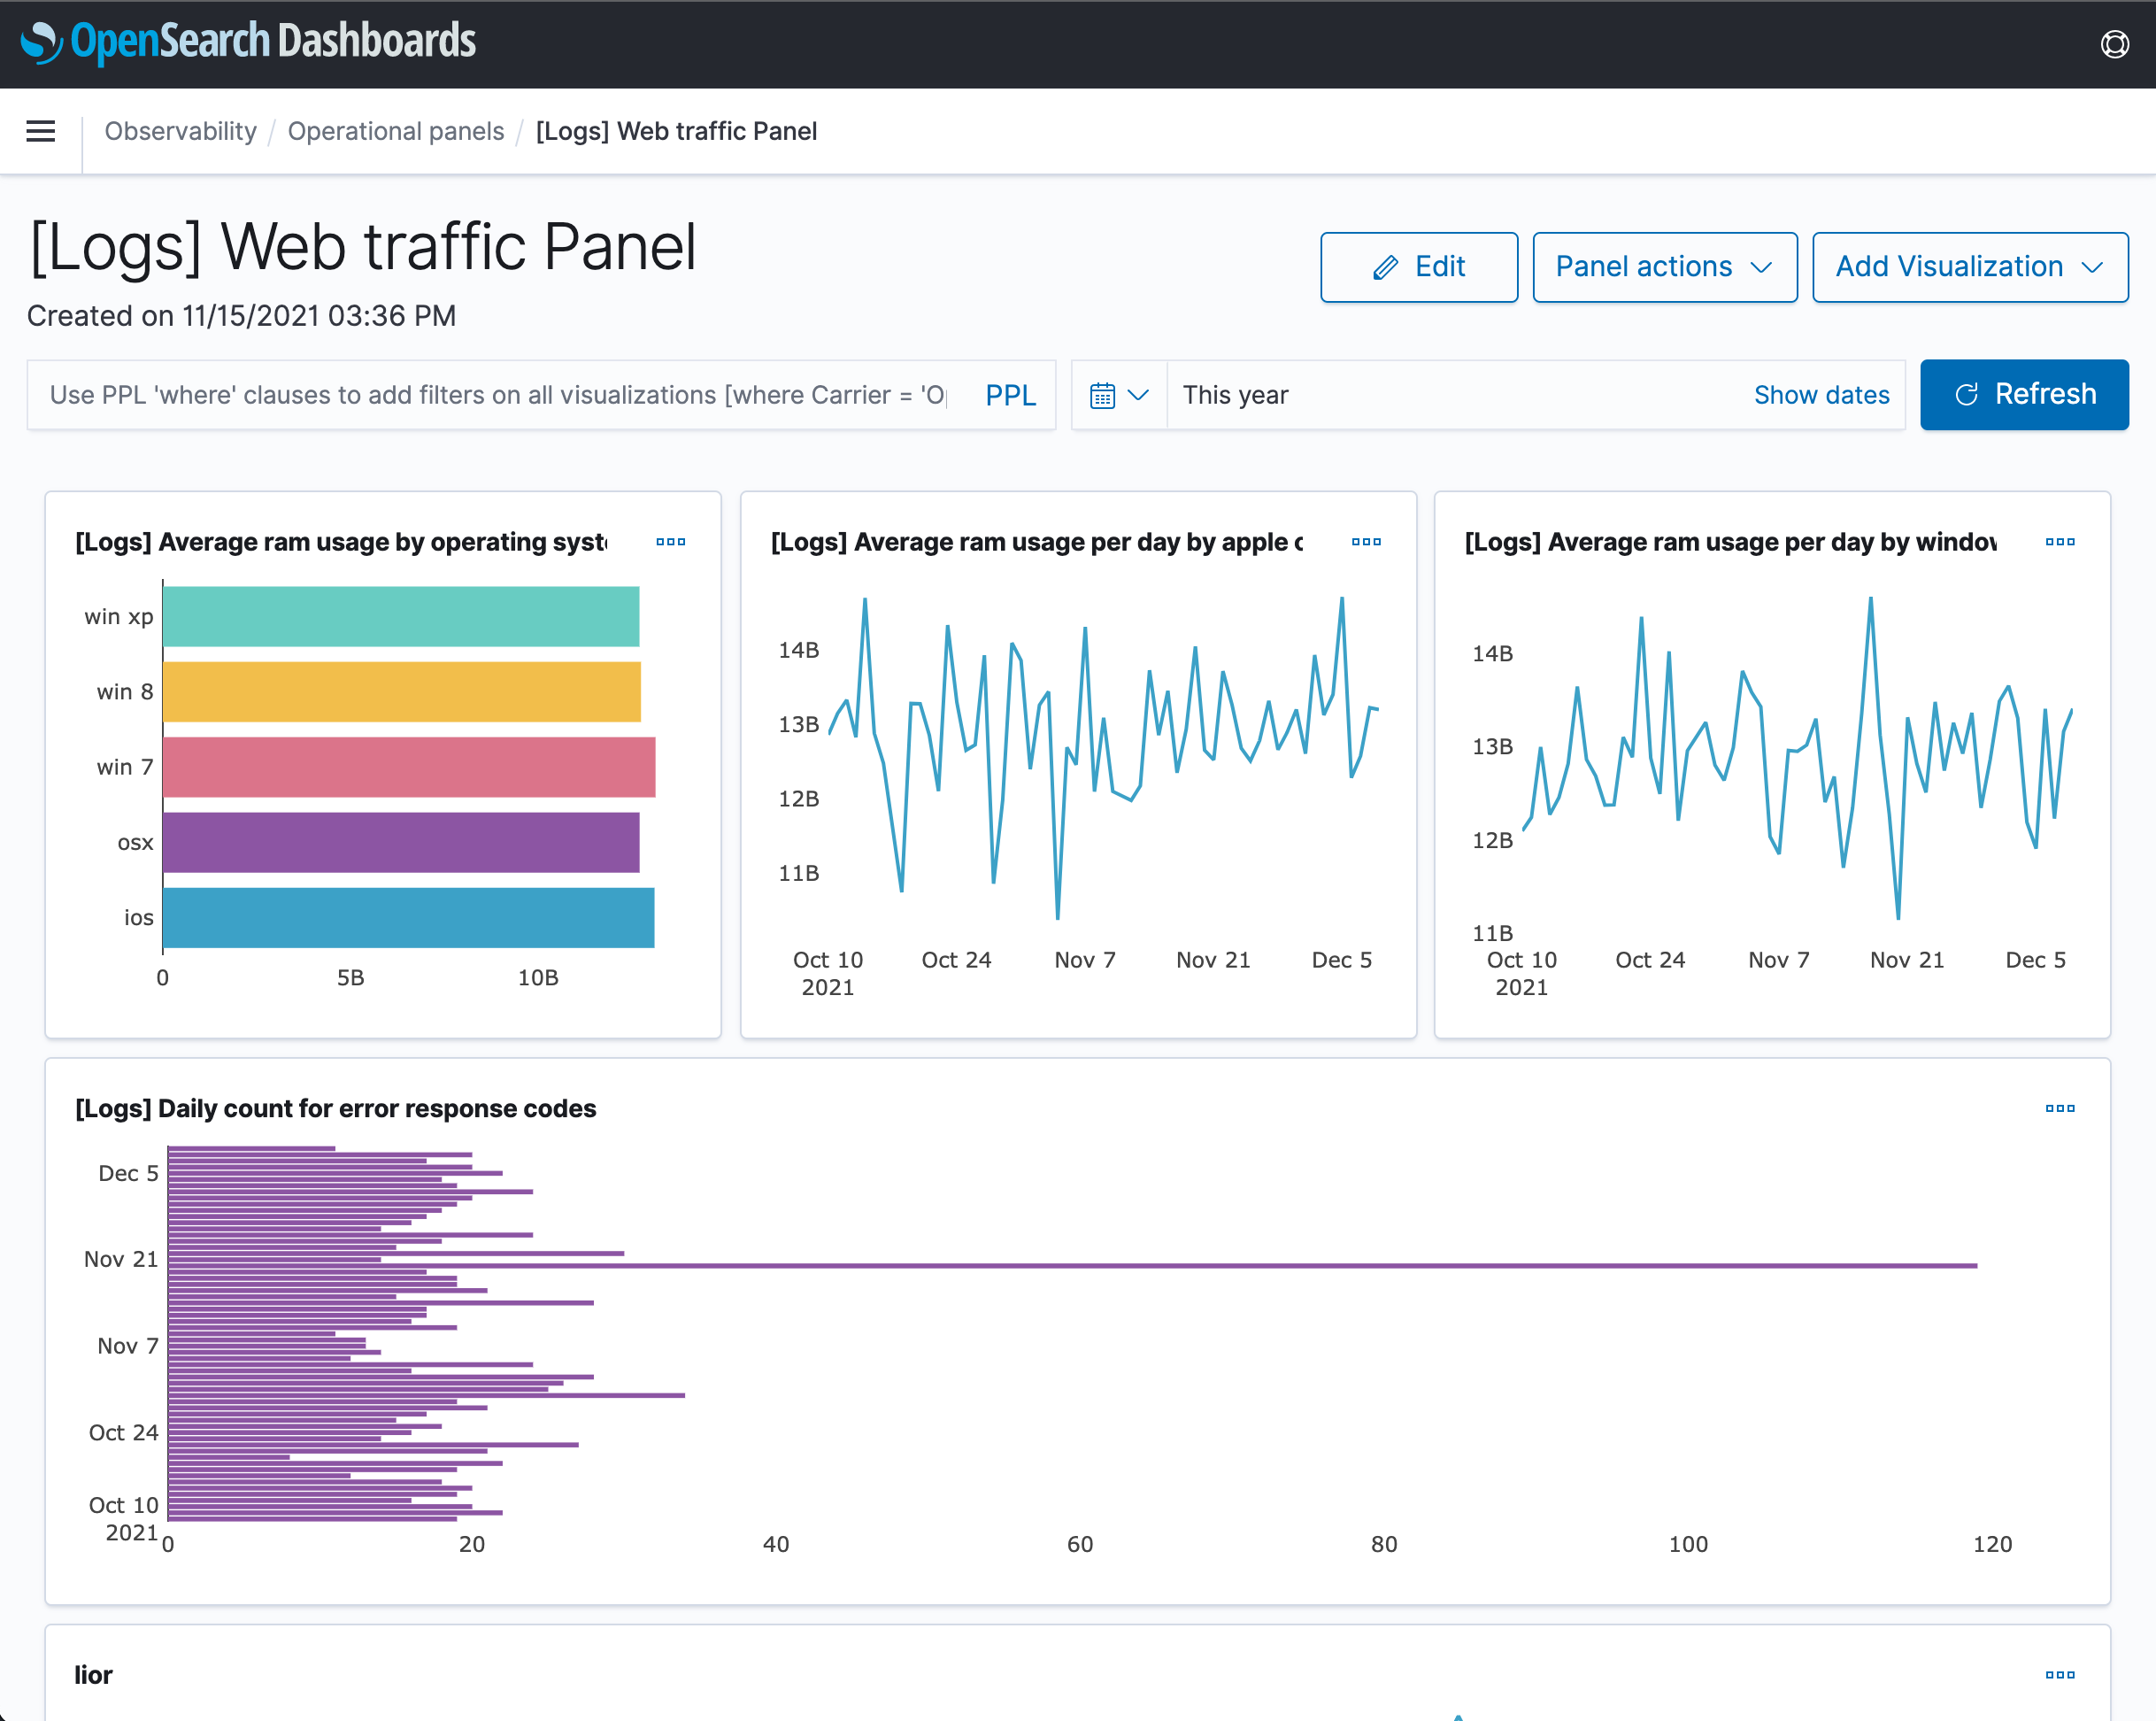
Operational panels in OpenSearch Dashboards are collections of visualizations generated using Piped Processing Language (PPL) queries.
Get started with operational panels
If you want to start using operational panels without adding any data, expand the Action menu, choose Add samples, and Dashboards adds a set of operational panels with saved visualizations for you to explore.
Create an operational panel
To create an operational panel and add visualizations:
- From the Add Visualization dropdown menu, choose Select Existing Visualization or Create New Visualization, which takes you to the event analytics explorer, where you can use PPL to create visualizations.
- If you’re adding already existing visualizations, choose a visualization from the dropdown menu.
- Choose Add.
To search for a particular visualization in your operation panels, use PPL queries to search for data you’ve already added to your panel.