You're viewing version 2.15 of the OpenSearch documentation. This version is no longer maintained. For the latest version, see the current documentation. For information about OpenSearch version maintenance, see Release Schedule and Maintenance Policy.
VisBuilder
You can use the VisBuilder visualization type in OpenSearch Dashboards to create data visualizations by using a drag-and-drop gesture. With VisBuilder you have:
- An immediate view of your data without the need to preselect the visualization output.
- The flexibility to change visualization types and index patterns quickly.
- The ability to easily navigate between multiple screens.
Try VisBuilder in the OpenSearch Dashboards playground
You can try VisBuilder without installing OpenSearch locally by using OpenSearch Dashboards Playground. VisBuilder is enabled by default.
Try VisBuilder locally
Follow these steps to create a new visualization using VisBuilder in your environment:
- Open Dashboards:
- If you’re not running the Security plugin, go to http://localhost:5601.
- If you’re running the Security plugin, go to https://localhost:5601 and log in with your username and password (default is
admin/admin).
-
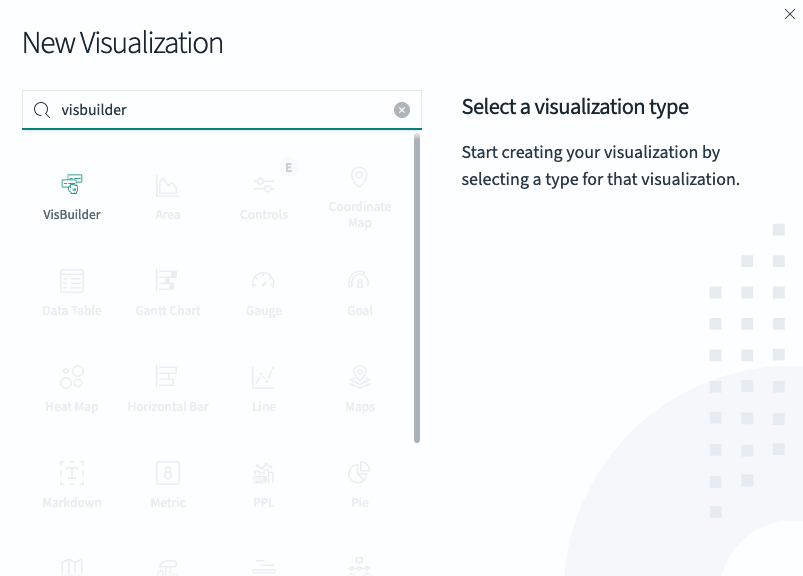
From the top menu, select Visualize > Create visualization > VisBuilder.
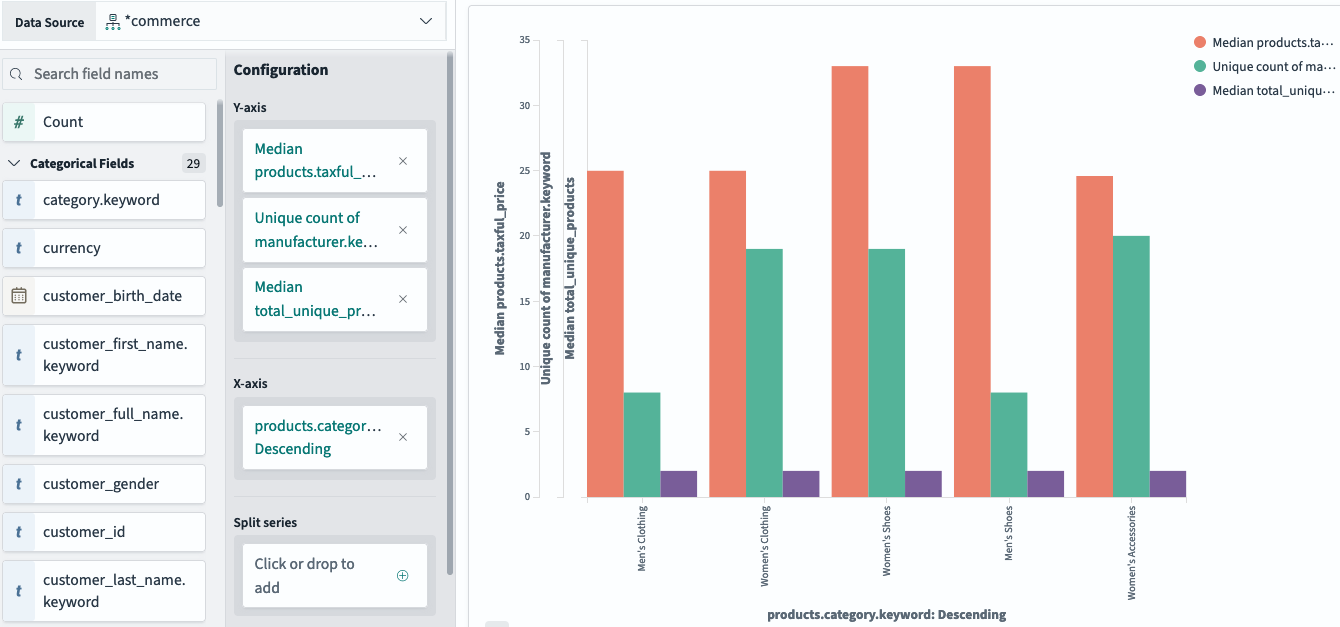
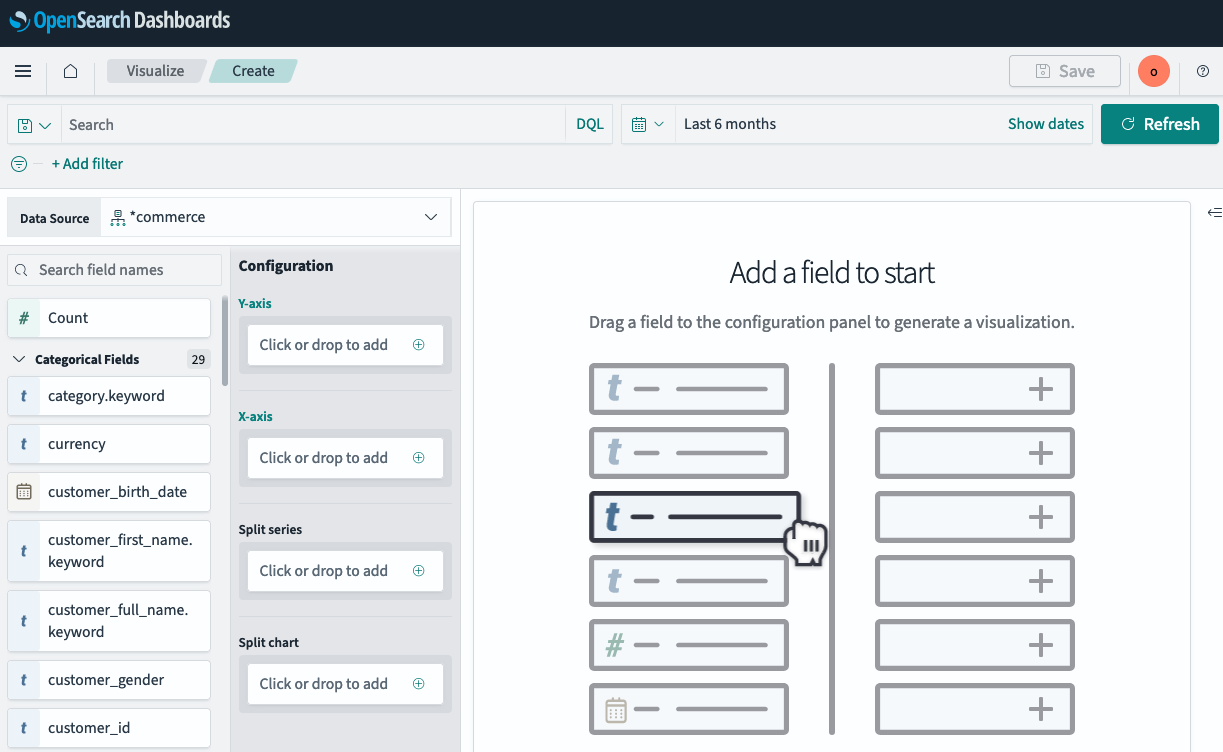
- Drag and drop field names from the left column into the Configuration panel to generate a visualization.
Here’s an example visualization. Your visualization will look different depending on your data and the fields you select.