You're viewing version 2.15 of the OpenSearch documentation. This version is no longer maintained. For the latest version, see the current documentation. For information about OpenSearch version maintenance, see Release Schedule and Maintenance Policy.
Integrations in OpenSearch Dashboards
Introduced 2.9
The Integrations application in OpenSearch Dashboards provides a user-friendly platform for data visualization, querying, and projection of your resource data, such as flow logs. An integration asset, such NGINX or Amazon Virtual Private Cloud (VPC), contains a bundle of metadata, data mappings, and visualizations, streamlining the monitoring of resource data without redundant configuration steps.
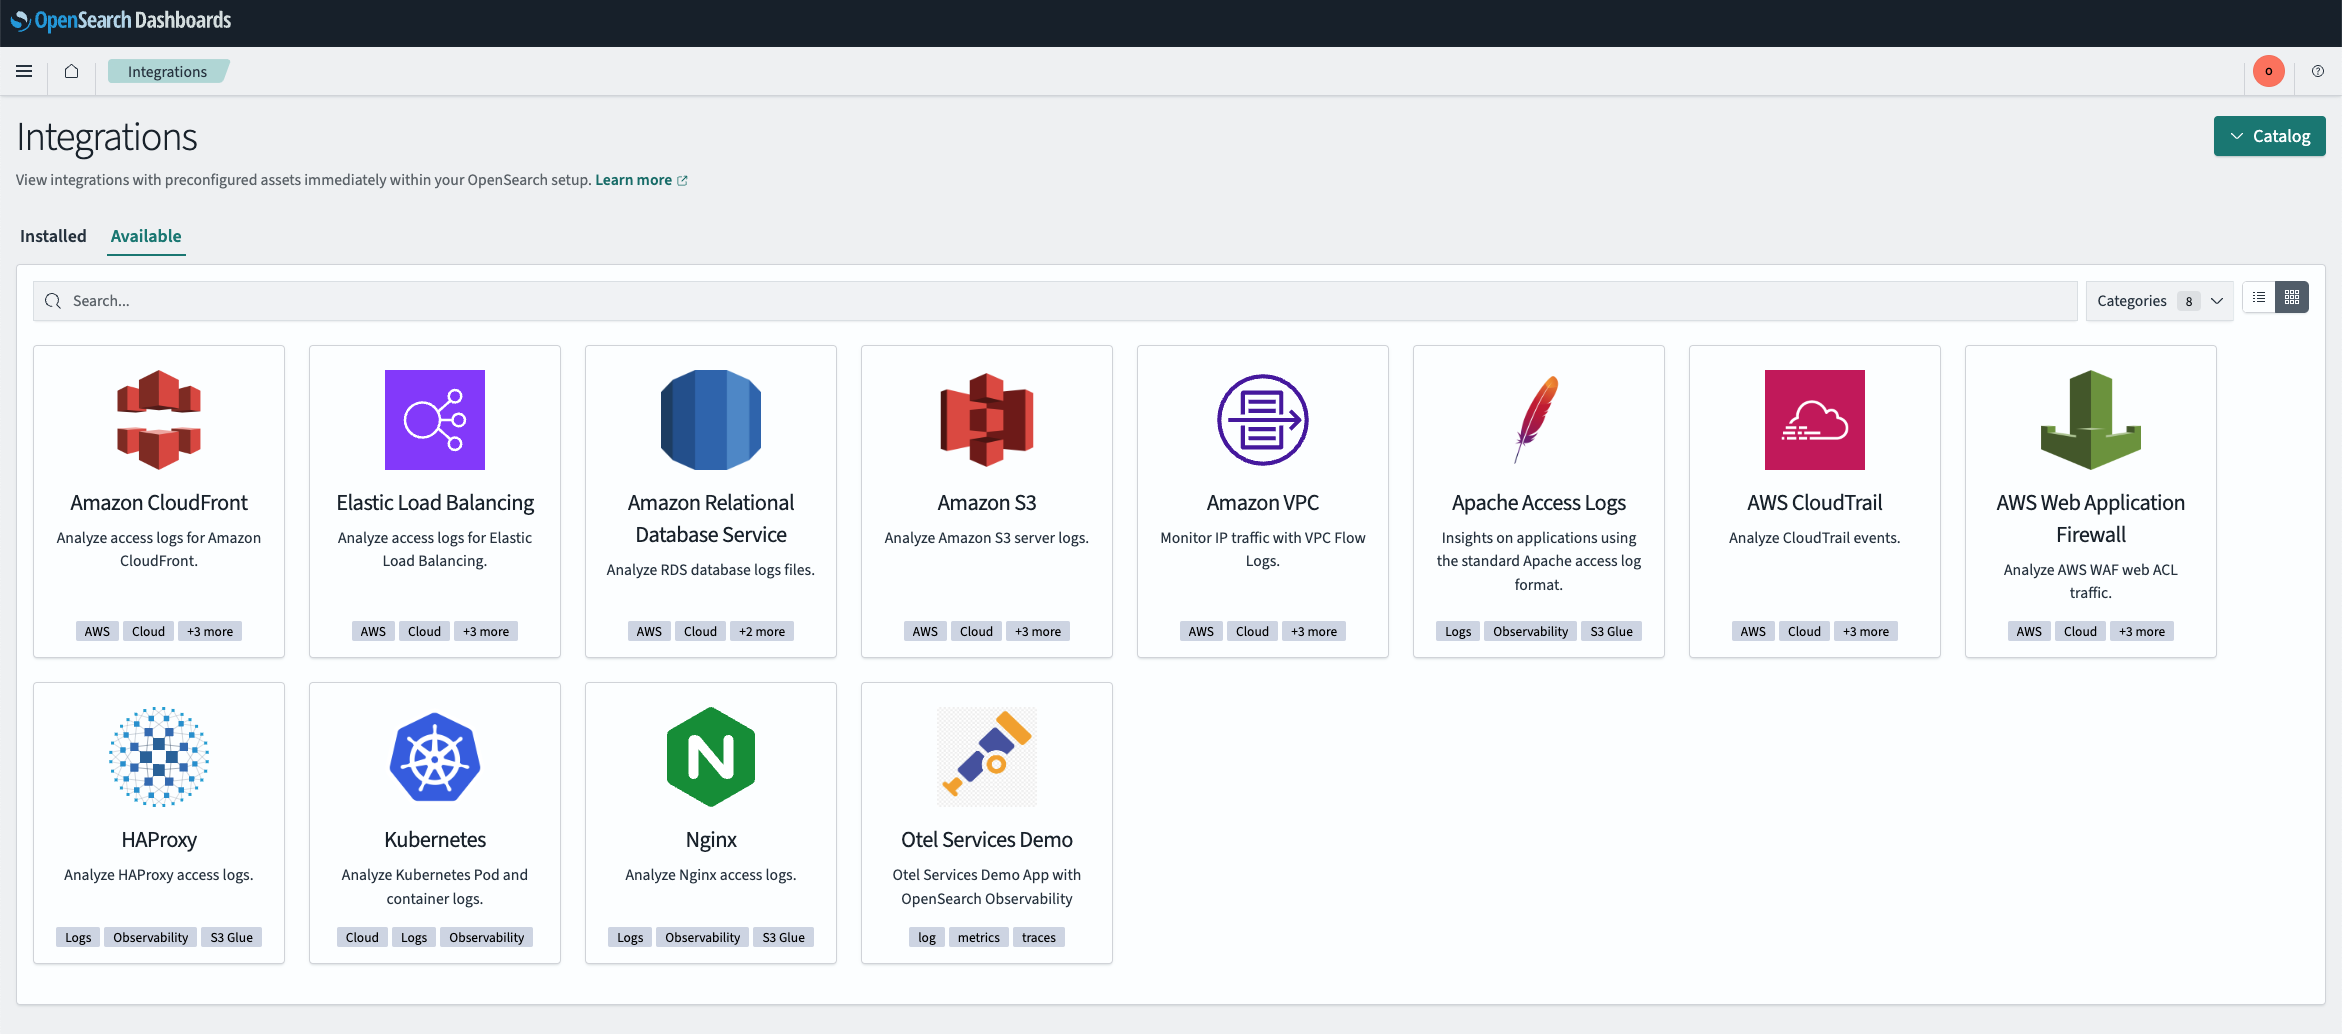
Available OpenSearch Dashboards integration assets are shown in the following image.

Use cases
Integrations considers established data schemas across multiple domains to give you seamless data mapping and integration for various use cases, such as e-commerce product search, observability monitoring (for example, trace and metrics analytics), and security monitoring and threat analysis.
OpenTelemetry protocol for observability
A consistent telemetry data schema is crucial for effective observability, enabling data correlation and analysis across applications, services, and infrastructure components to provide a holistic view of system behavior and performance.
OpenSearch adopted the OpenTelemetry (OTel) protocol as the foundation for its observability solution. OTel is a community-driven standard that defines a consistent schema and data collection approach for metrics, logs, and traces. It is widely supported by APIs, SDKs, and telemetry collectors, enabling features like auto-instrumentation for seamless observability integration.
This shared schema allows cross-correlation and analysis across different data sources. To this end, OpenSearch derived the Simple Schema for Observability, which encodes the OTel standard as OpenSearch mappings. OpenSearch also supports the Piped Processing Language (PPL), which is designed for high-dimensionality querying in observability use cases.
Ingesting data
Data ingested into OpenSearch must conform to the supported schemas for data integrations and their associated dashboards. Compatible data pipelines are required, such as the following:
These pipelines use the OTel schema (or a simple schema) to index signal documents into the correct index representing the observed resource signals. See Naming Convention for index naming conventions.
Ingestion structure
Each integration asset contains the following metadata and assets:
- Name and description
- Source URL and license
- Schema specification, for example, mapping or component mapping
- Sample data for testing the feature
- Assets such as dashboards, index patterns, queries, or alerts
Installing an integration asset
Integration assets can be installed directly from the default catalog shipped with every OpenSearch release.
To install an asset, follow these steps:
- Go to Integrations > Available to view the available options.
- Select a tool, such as Nginx or Amazon VPC. You can choose Add to add or configure a new data integration using a prepackaged integration asset. You can choose Try it to test or explore the integration before fully adding it.
- On the Available page, select the Categories dropdown menu to filter the list of integrations.
Try it demo
To try a prepackaged integration asset, follow these steps:
- On the Integrations page, select Nginx.
- Select the Try it button. The Try it option automatically creates a sample index template, adds sample data to the template, and then creates the integration based on that data.
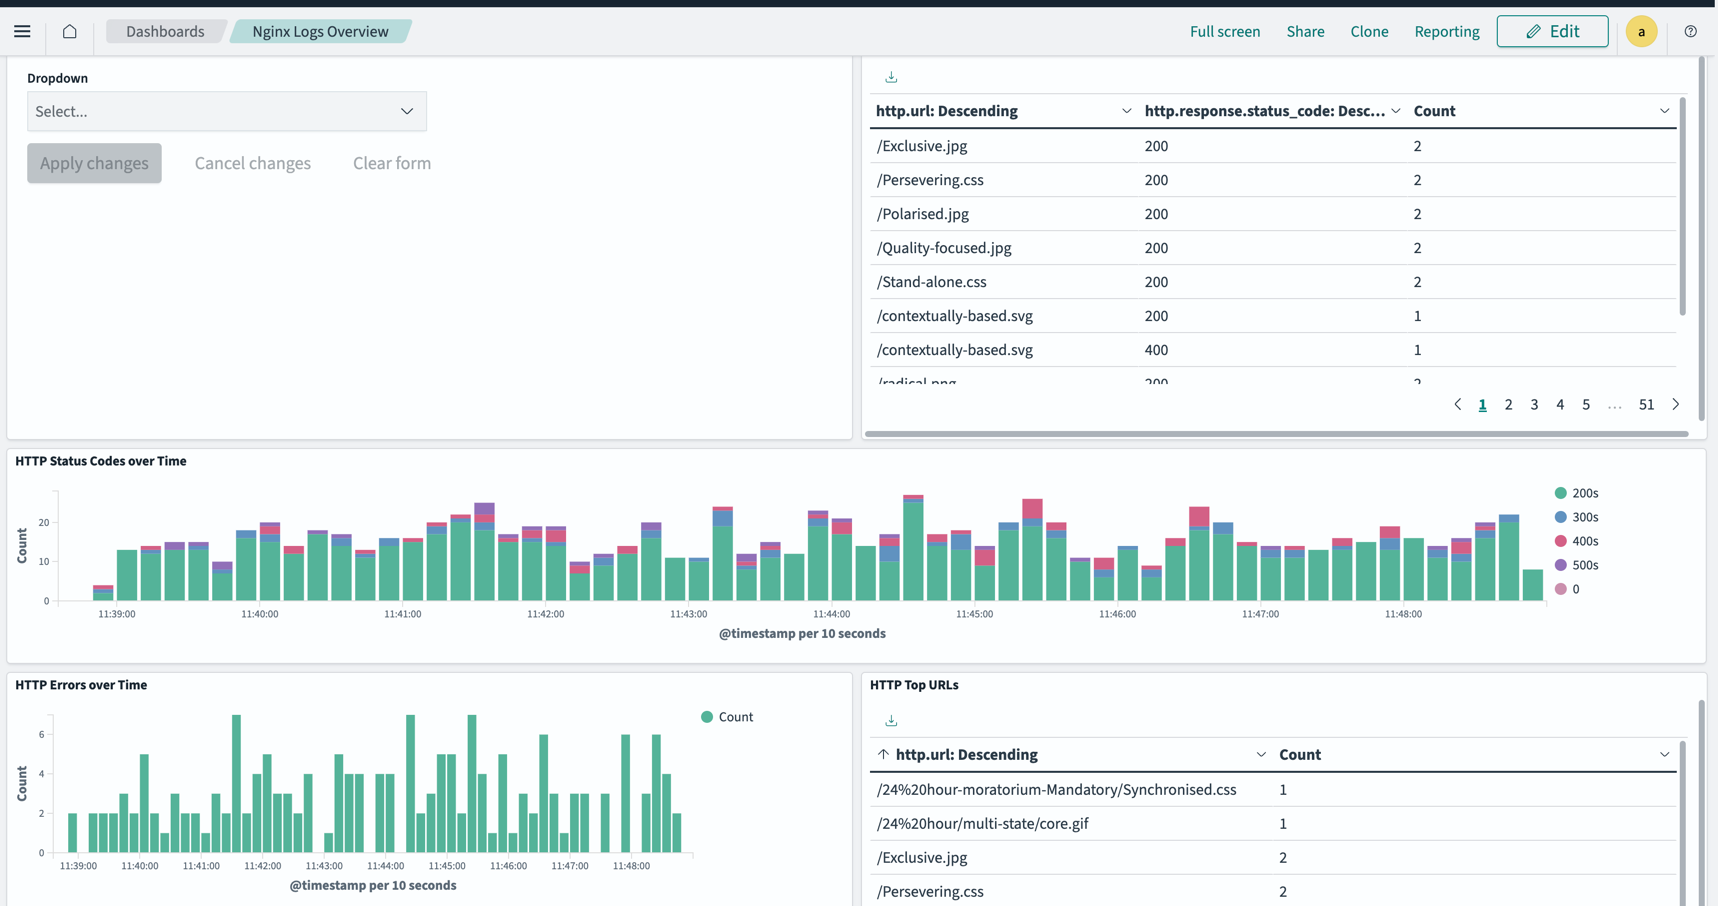
- Select an asset from the Asset List. Assets include dashboards, index patterns, and visualizations.
- Preview the data visualizations and sample data details. An example is shown in the following image.

Loading custom integration assets
To load a custom integration asset, follow these steps:
- Download an integration artifact from the catalog repository.
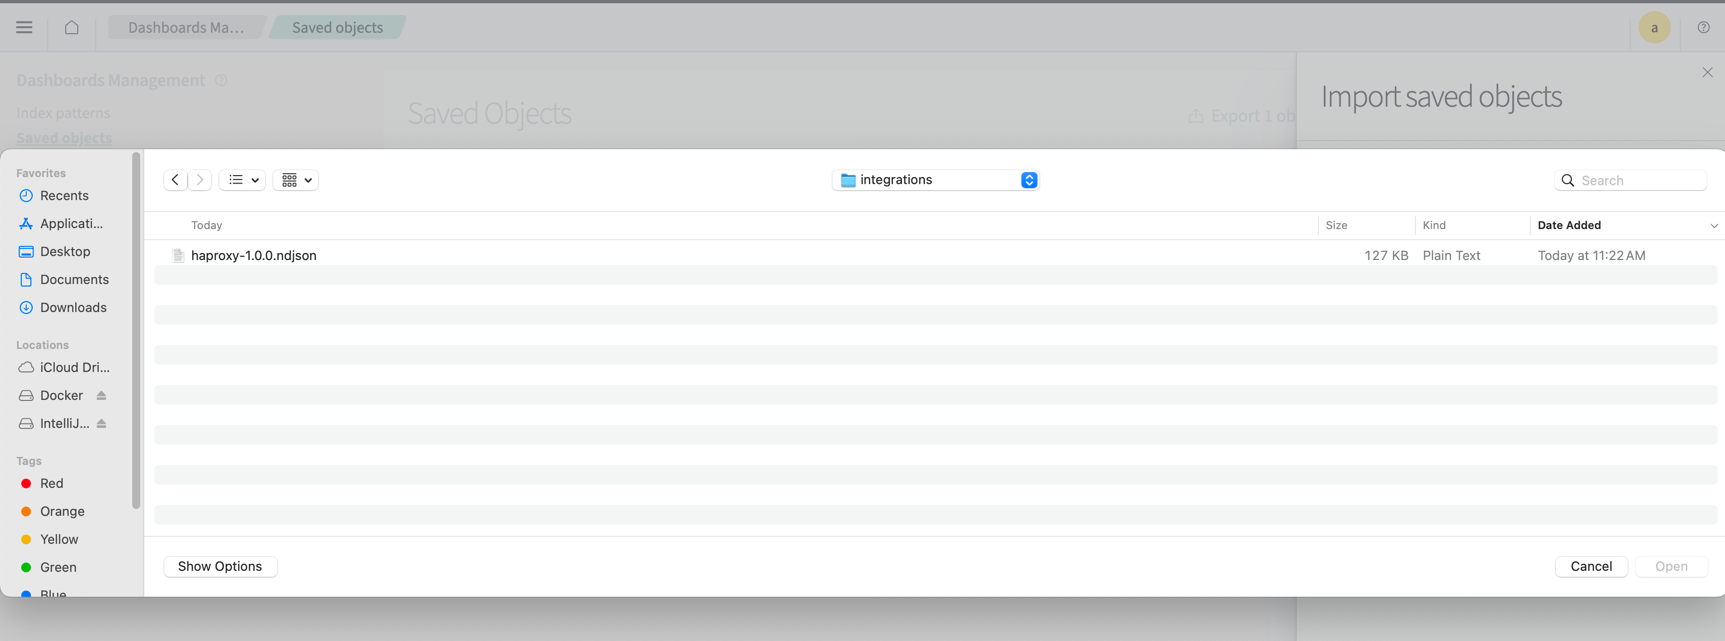
- Go to Dashboards Management > Saved objects.
- Select Import on the upper-right toolbar menu, navigate to the folder where you saved the integration artifact, and then choose the file (a file with an .ndjson extension). An example of this step is shown in the following image.

- Select the saved object you uploaded to confirm that it was uploaded to Saved objects. An example of this step is shown in the following image.

Developer resources
See the following developer resources for sample code, articles, tutorials, and an API reference:
- OpenSearch Integrations repository
- OpenSearch Integrations reference documentation
- OpenSearch Observability Catalog
- OpenSearch Observability Catalog release page
- Simple Schema for Observability
Community contribution
The OpenSearch Project seeks your feedback on this feature. Post on the OpenSearch forum to let us know how Integrations works for you or how it can be improved.
Contribute to the project by submitting an integration request.