You're viewing version 2.15 of the OpenSearch documentation. This version is no longer maintained. For the latest version, see the current documentation. For information about OpenSearch version maintenance, see Release Schedule and Maintenance Policy.
Metric analytics
Introduced 2.4
With the release of OpenSearch 2.4, you can now ingest and visualize metric data stored directly in OpenSearch using the Metrics tool. This equips you with tools to analyze and correlate data across logs, traces, and metrics.
Before the introduction of this feature, you could only ingest and visualize logs and traces from your monitored environments. With the Metrics tool, you can now observe your digital assets with more granularity, gain deeper insight into the health of your infrastructure, and better inform your root cause analysis.
The Metrics tool offers federated visualization capabilities in addition to the following:
- An OpenSearch cluster containing an OpenTelemetry (OTel)-compatible metrics index with OTel-based signals. See What is OpenTelemetry? for an overview of OTel.
- An OpenSearch cluster containing a Prometheus data source connected to a Prometheus server.
The following image displays the flow for retrieving metrics from Prometheus and displaying them on a visualization dashboard.
The following image displays an observability dashboard that visualizes metric data from the OpenSearch index using OTel queries.
Configuring Prometheus to send metric data to OpenSearch
You must first create a connection from Prometheus to OpenSearch using the SQL plugin. You can then configure a connection to Prometheus by using the _datasources API endpoint.
The following example shows a request that configures a Prometheus data source without any authentication:
POST _plugins/_query/_datasources
{
    "name" : "my_prometheus",
    "connector": "prometheus",
    "properties" : {
        "prometheus.uri" : "http://localhost:9090"
    }
}
The following example shows how to configure a Prometheus data source using AWS Signature Version 4 authentication:
POST _plugins/_query/_datasources
{
    "name" : "my_prometheus",
    "connector": "prometheus",
    "properties" : {
        "prometheus.uri" : "http://localhost:8080",
        "prometheus.auth.type" : "awssigv4",
        "prometheus.auth.region" : "us-east-1",
        "prometheus.auth.access_key" : ""
        "prometheus.auth.secret_key" : ""
    }
}
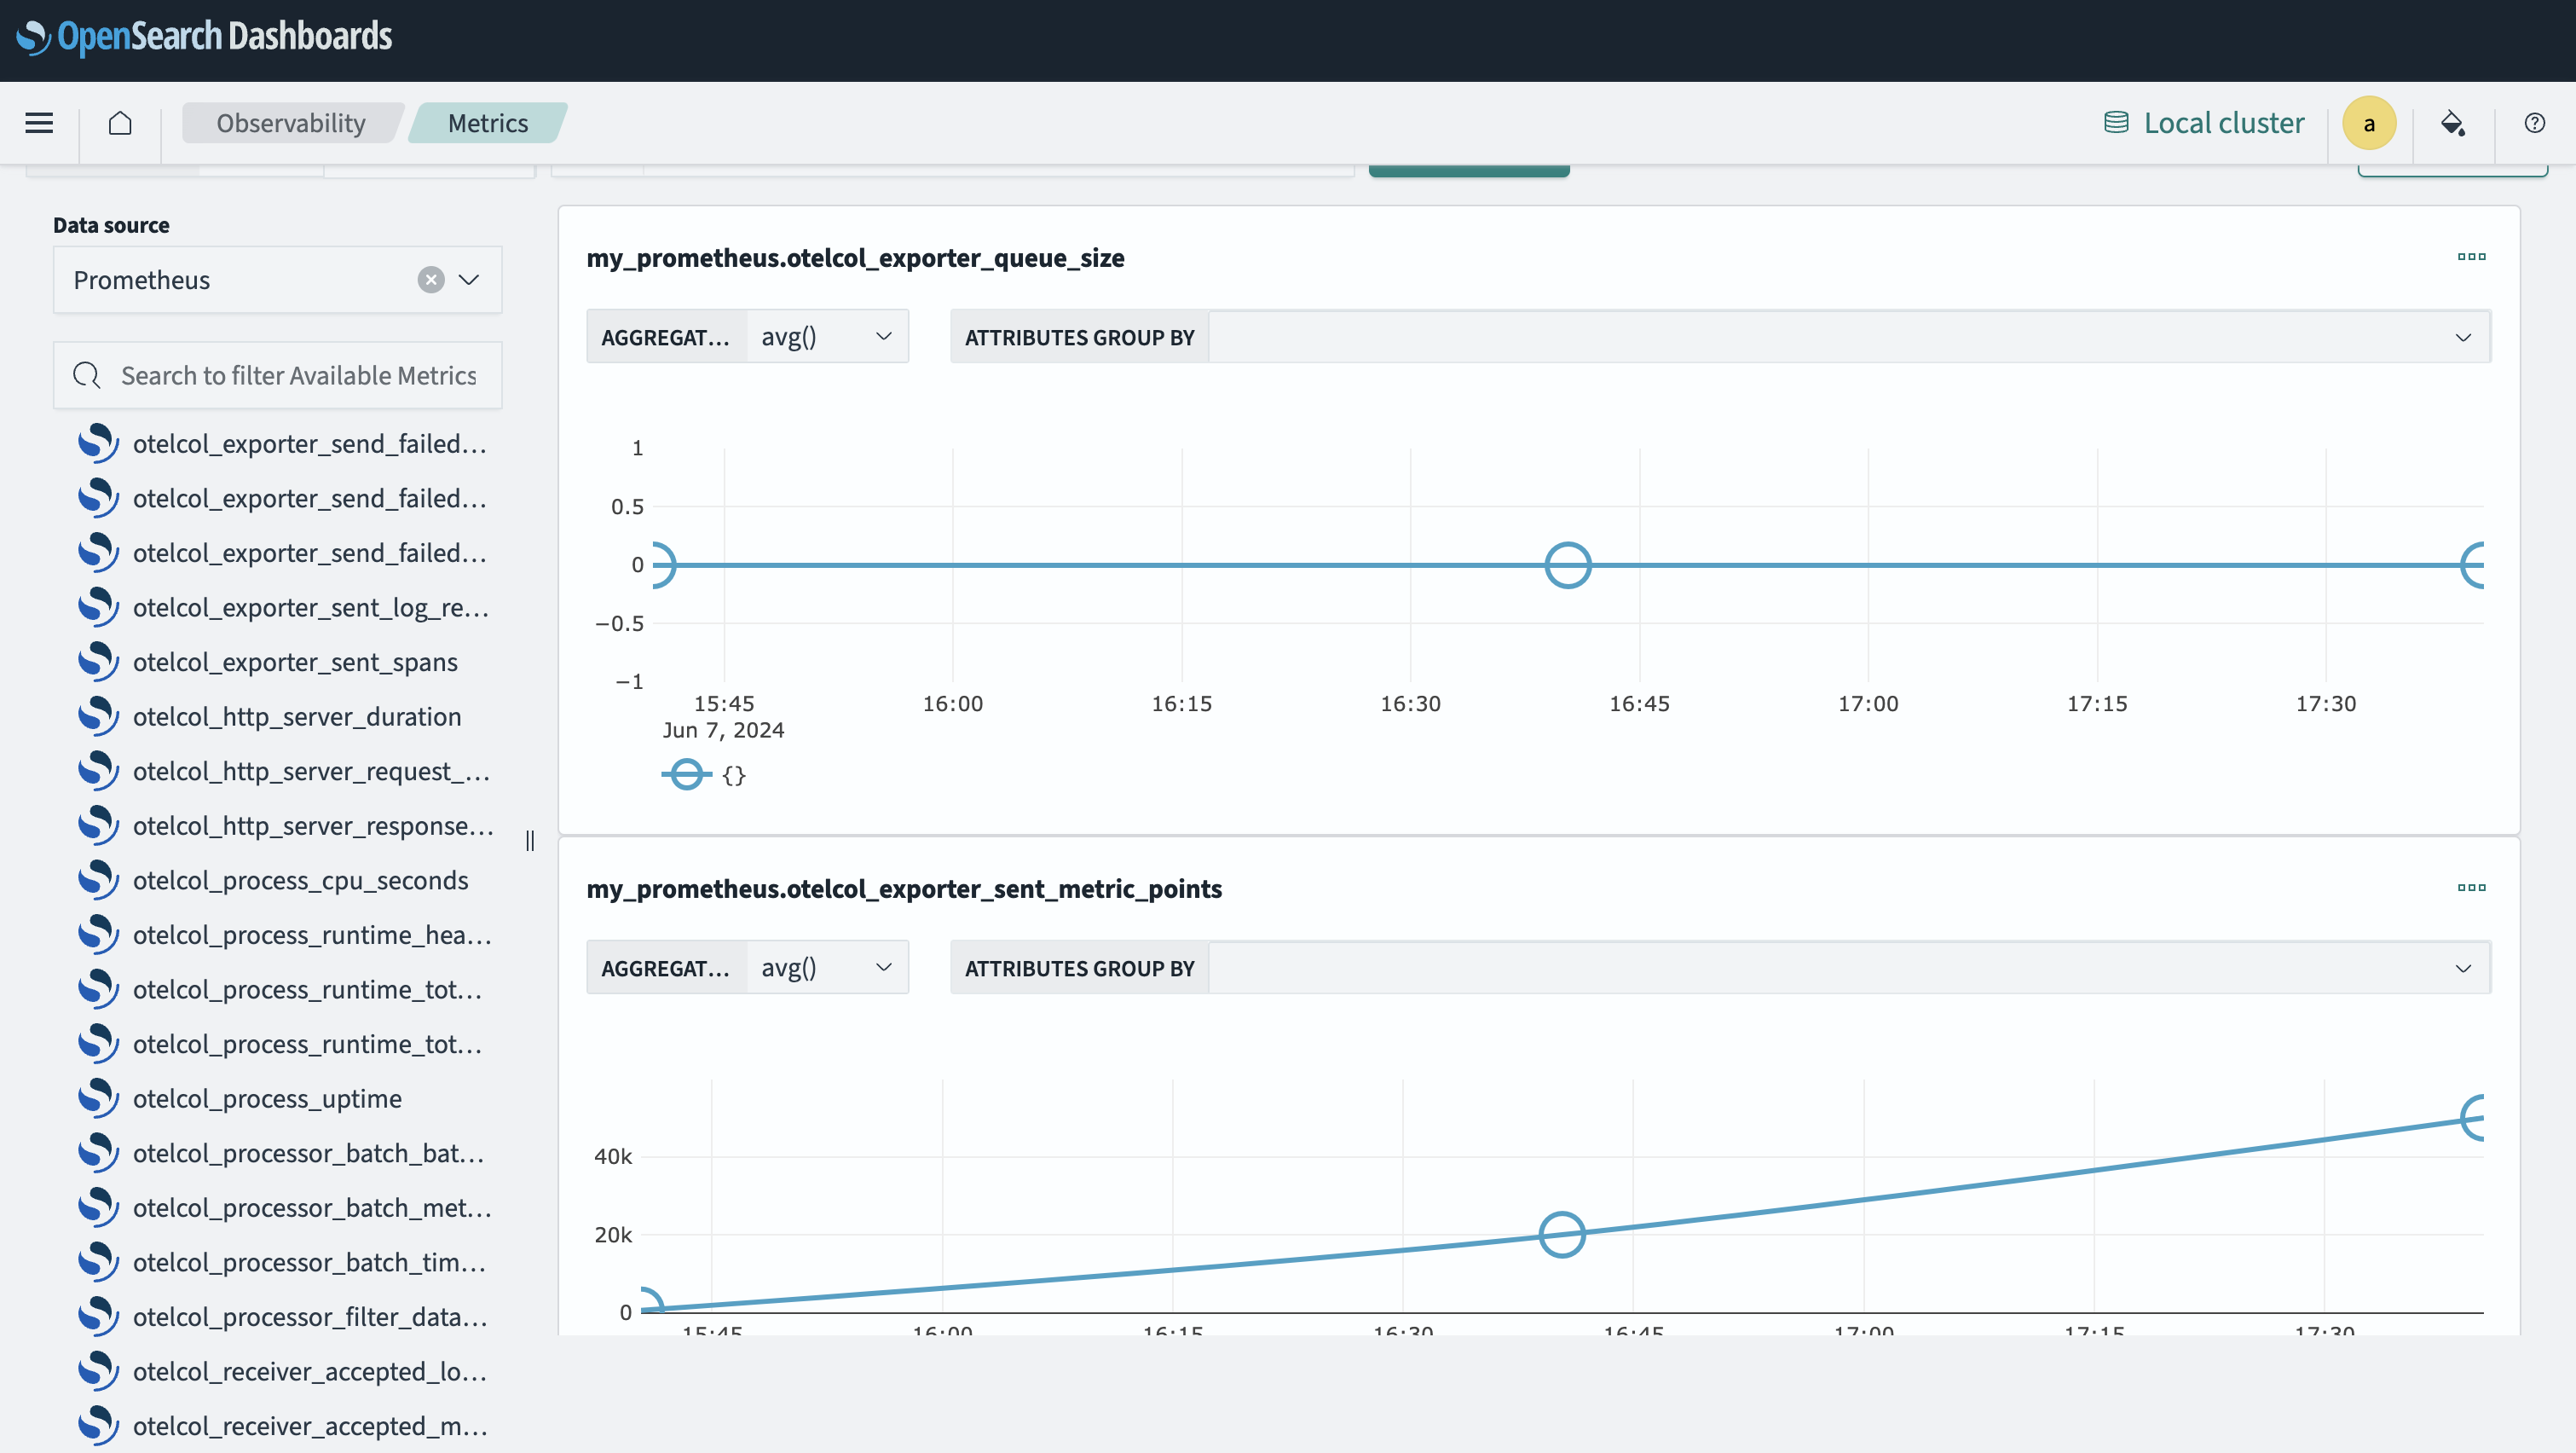
After configuring the connection, you can view Prometheus metrics in OpenSearch Dashboards by going to the Observability > Metrics page, as shown in the following image.
Developer resources
See the following developer resources for sample code, articles, tutorials, and API references:
- Datasource Settings, which contains information about authentication and authorization of data source APIs.
- Prometheus Connector, which contains configuration information.
- Simple Schema for Observability, which contains information about the OTel schema and ingest pipeline.
- OTel Metrics Source, which contains information about the Data Prepper metrics pipeline and ingestion.
Experimenting with OpenTelemetry Metrics in the OpenSearch demo environment
The OpenSearch opentelemetry-demo repository provides a practical demonstration of collecting, processing, and visualizing metric data through OpenTelemetry Metrics from OpenTelemetry and using the Metrics tool in OpenSearch Dashboards.
Visualizing OTel metrics in OpenSearch
To visualize OTel metric data in OpenSearch, follow these steps:
- Install the
opentelemetry-demorepository. See the Getting Started guide for instructions. - Collect the OTel signals, including metric signals. See the OTel Collector guide for instructions.
- Configure the OTel pipeline to emit metric signals. See the OTel Collector Pipeline guide for instructions.
Example YAML config file
    service:
      extensions: [basicauth/client]
      pipelines:
        traces:
          receivers: [otlp]
          processors: [batch]
          exporters: [otlp, debug, spanmetrics, otlp/traces, opensearch/traces]
        metrics:
          receivers: [otlp, spanmetrics]
          processors: [filter/ottl, transform, batch]
          exporters: [otlphttp/prometheus, otlp/metrics, debug]
        logs:
          receivers: [otlp]
          processors: [batch]
          exporters: [otlp/logs,  opensearch/logs, debug]
- Configure the Data Prepper pipeline to emit the collected metric signals into the OpenSearch metrics index.
Example YAML config file
    otel-metrics-pipeline:
      workers: 8
      delay: 3000
      source:
        otel_metrics_source:
          health_check_service: true
          ssl: false
      buffer:
        bounded_blocking:
          buffer_size: 1024 # max number of records the buffer accepts
          batch_size: 1024 # max number of records the buffer drains after each read
      processor:
        - otel_metrics:
            calculate_histogram_buckets: true
            calculate_exponential_histogram_buckets: true
            exponential_histogram_max_allowed_scale: 10
            flatten_attributes: false
      sink:
        - opensearch:
            hosts: ["https://opensearch-node1:9200"]
            username: "admin"
            password: "my_%New%_passW0rd!@#"
            insecure: true
            index_type: custom
            template_file: "templates/ss4o_metrics.json"
            index: ss4o_metrics-otel-%{yyyy.MM.dd}
            bulk_size: 4
- Ingest metric data into OpenSearch. As the demo starts generating data, the metric signals will be added to the OpenSearch index that supports the OpenTelemetry Metrics schema format.
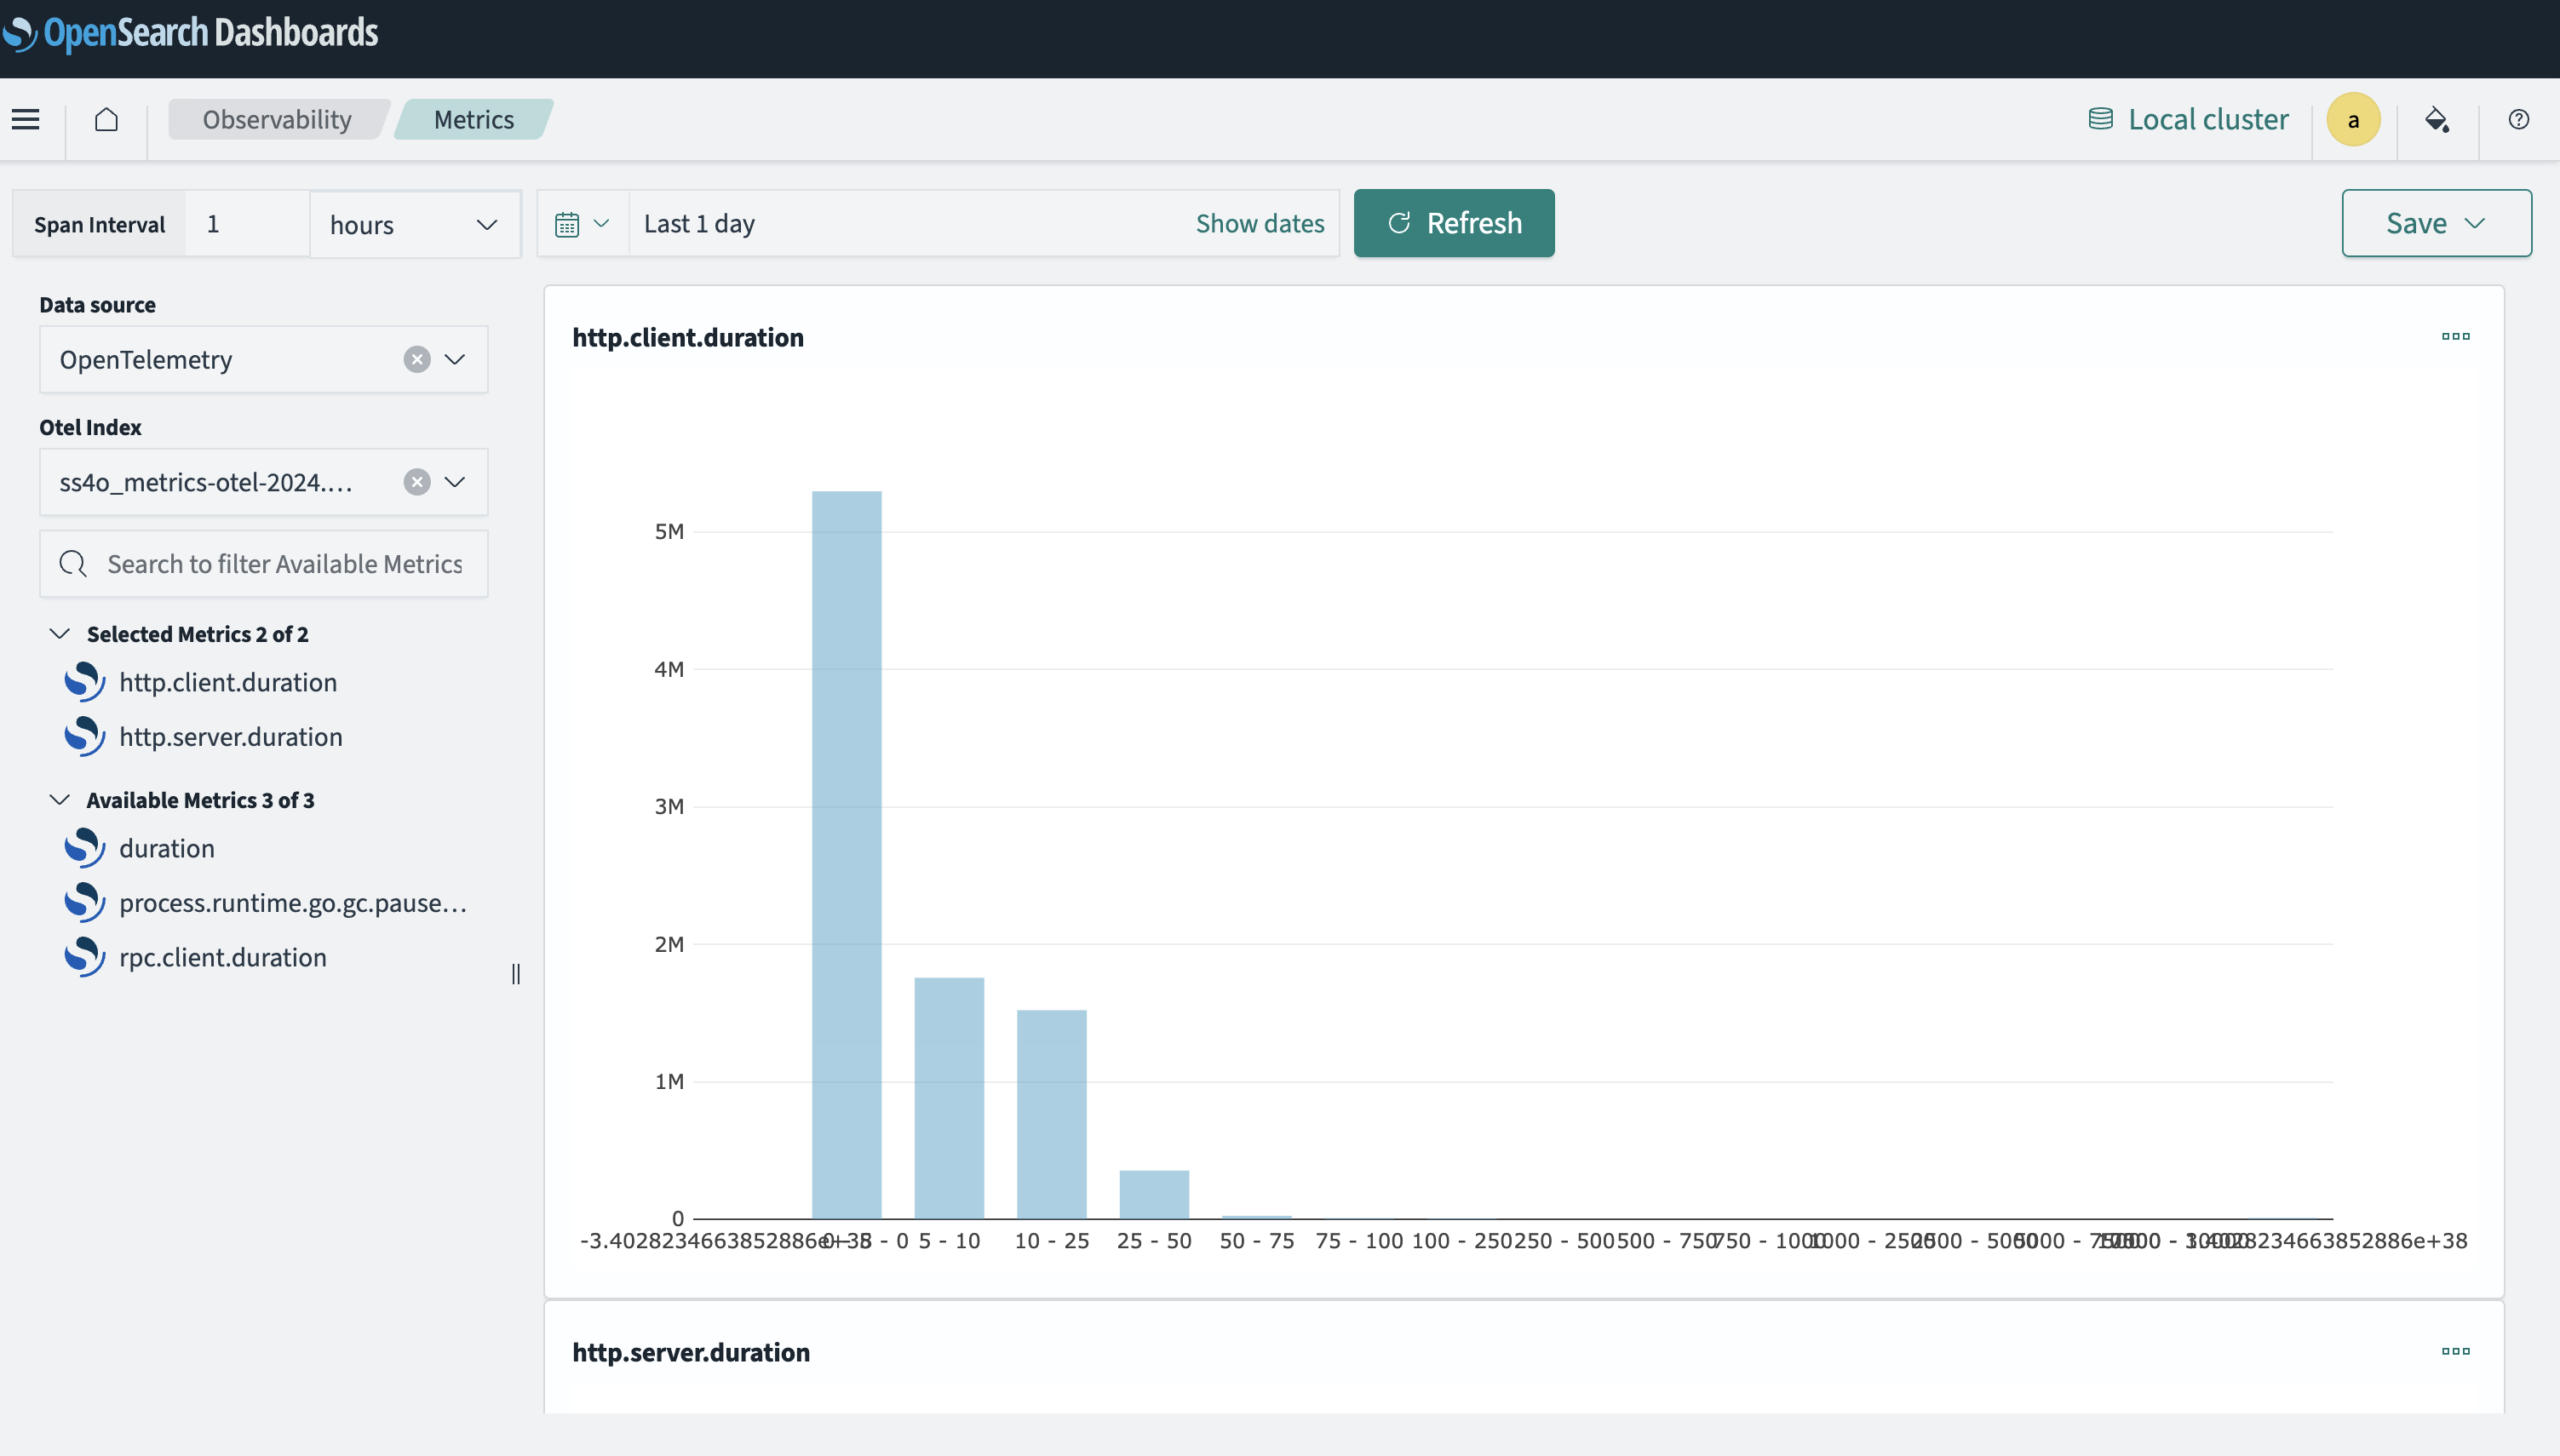
- On the Metrics page, choose
Otel-Indexfrom the Data sources dropdown menu andSimple Schema for Observability Indexfrom the OTel index dropdown menu. A visualization is displayed, as shown in the following image.
Visualizing metrics in remote clusters
Introduced 2.14
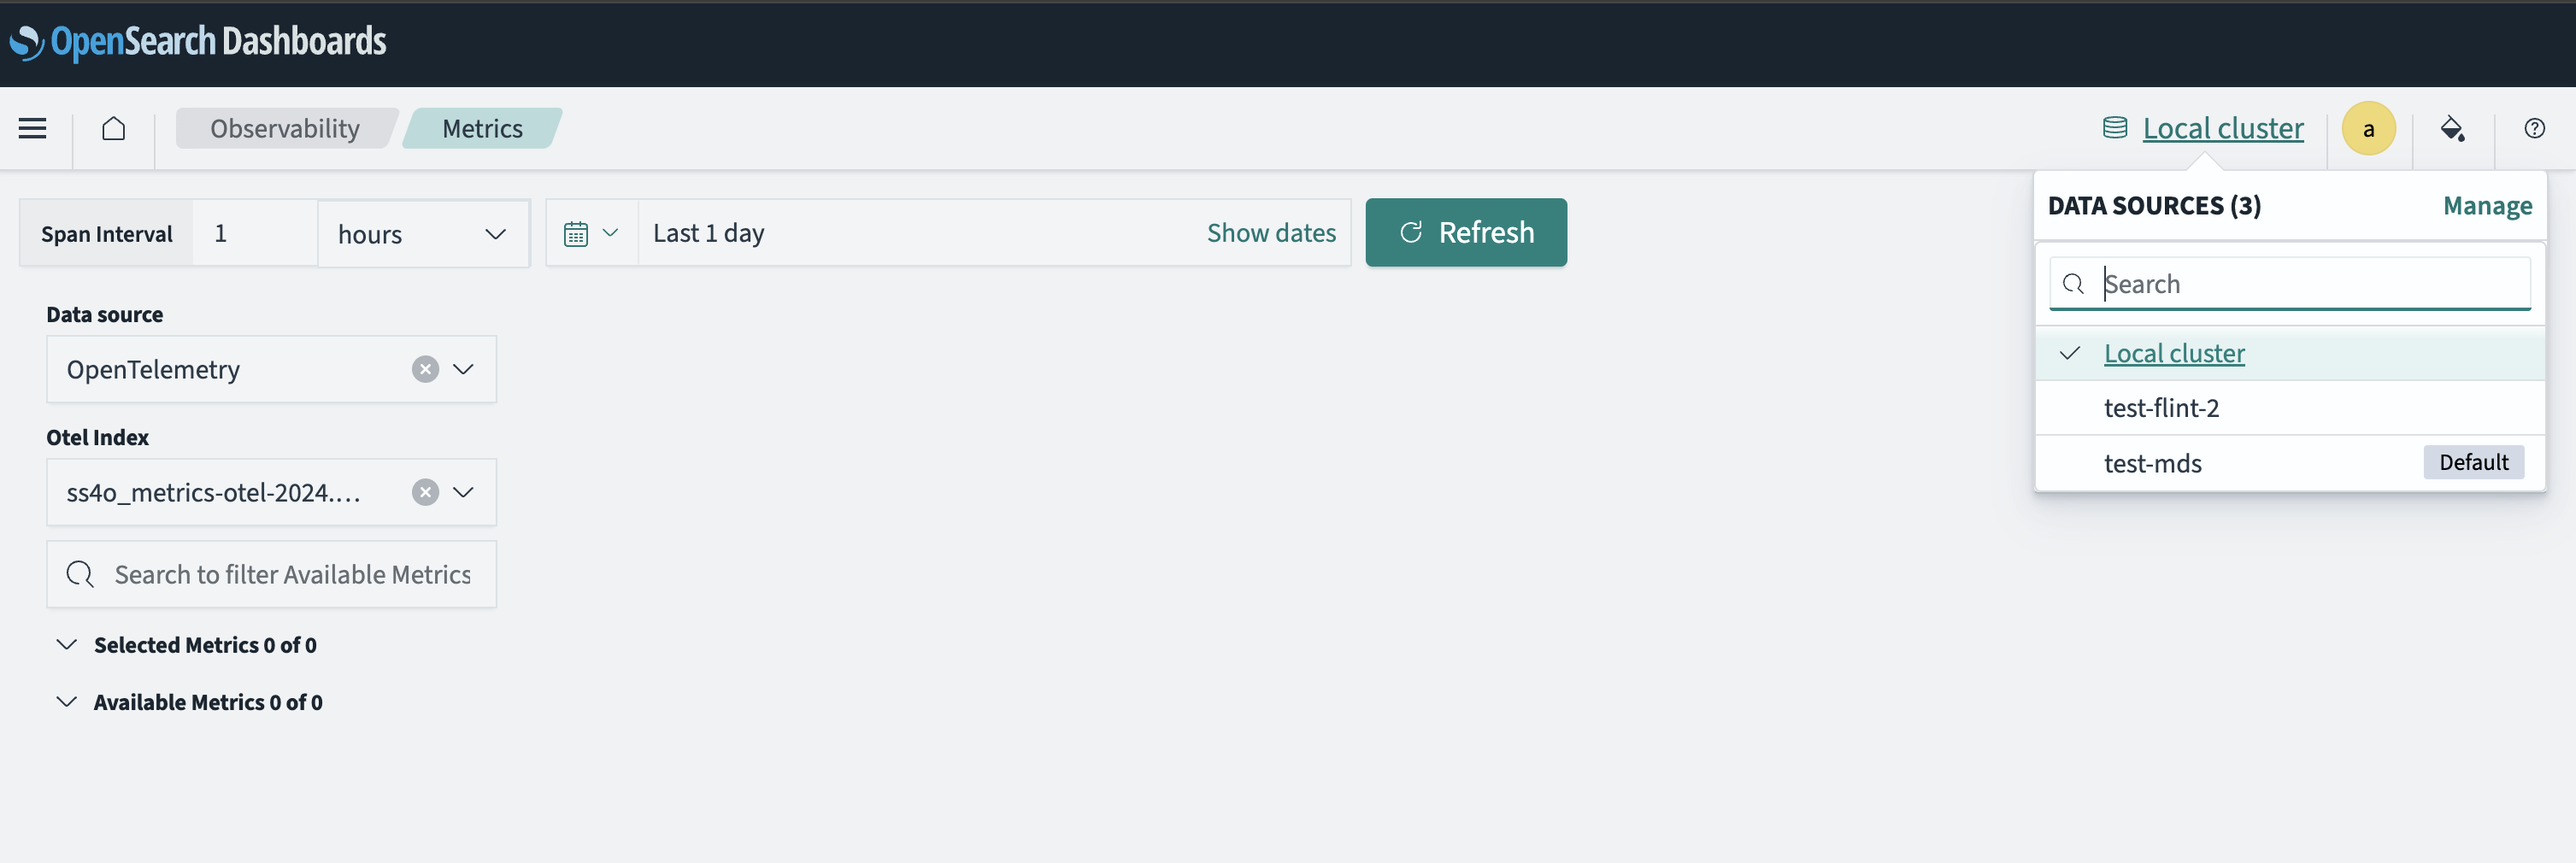
You can view metrics from remote OpenSearch clusters by using the Metrics tool. Select the database icon on the upper-right toolbar and choose a cluster from the DATA SOURCES dropdown menu, as shown in the following image. You can switch from a local cluster to a remote cluster.
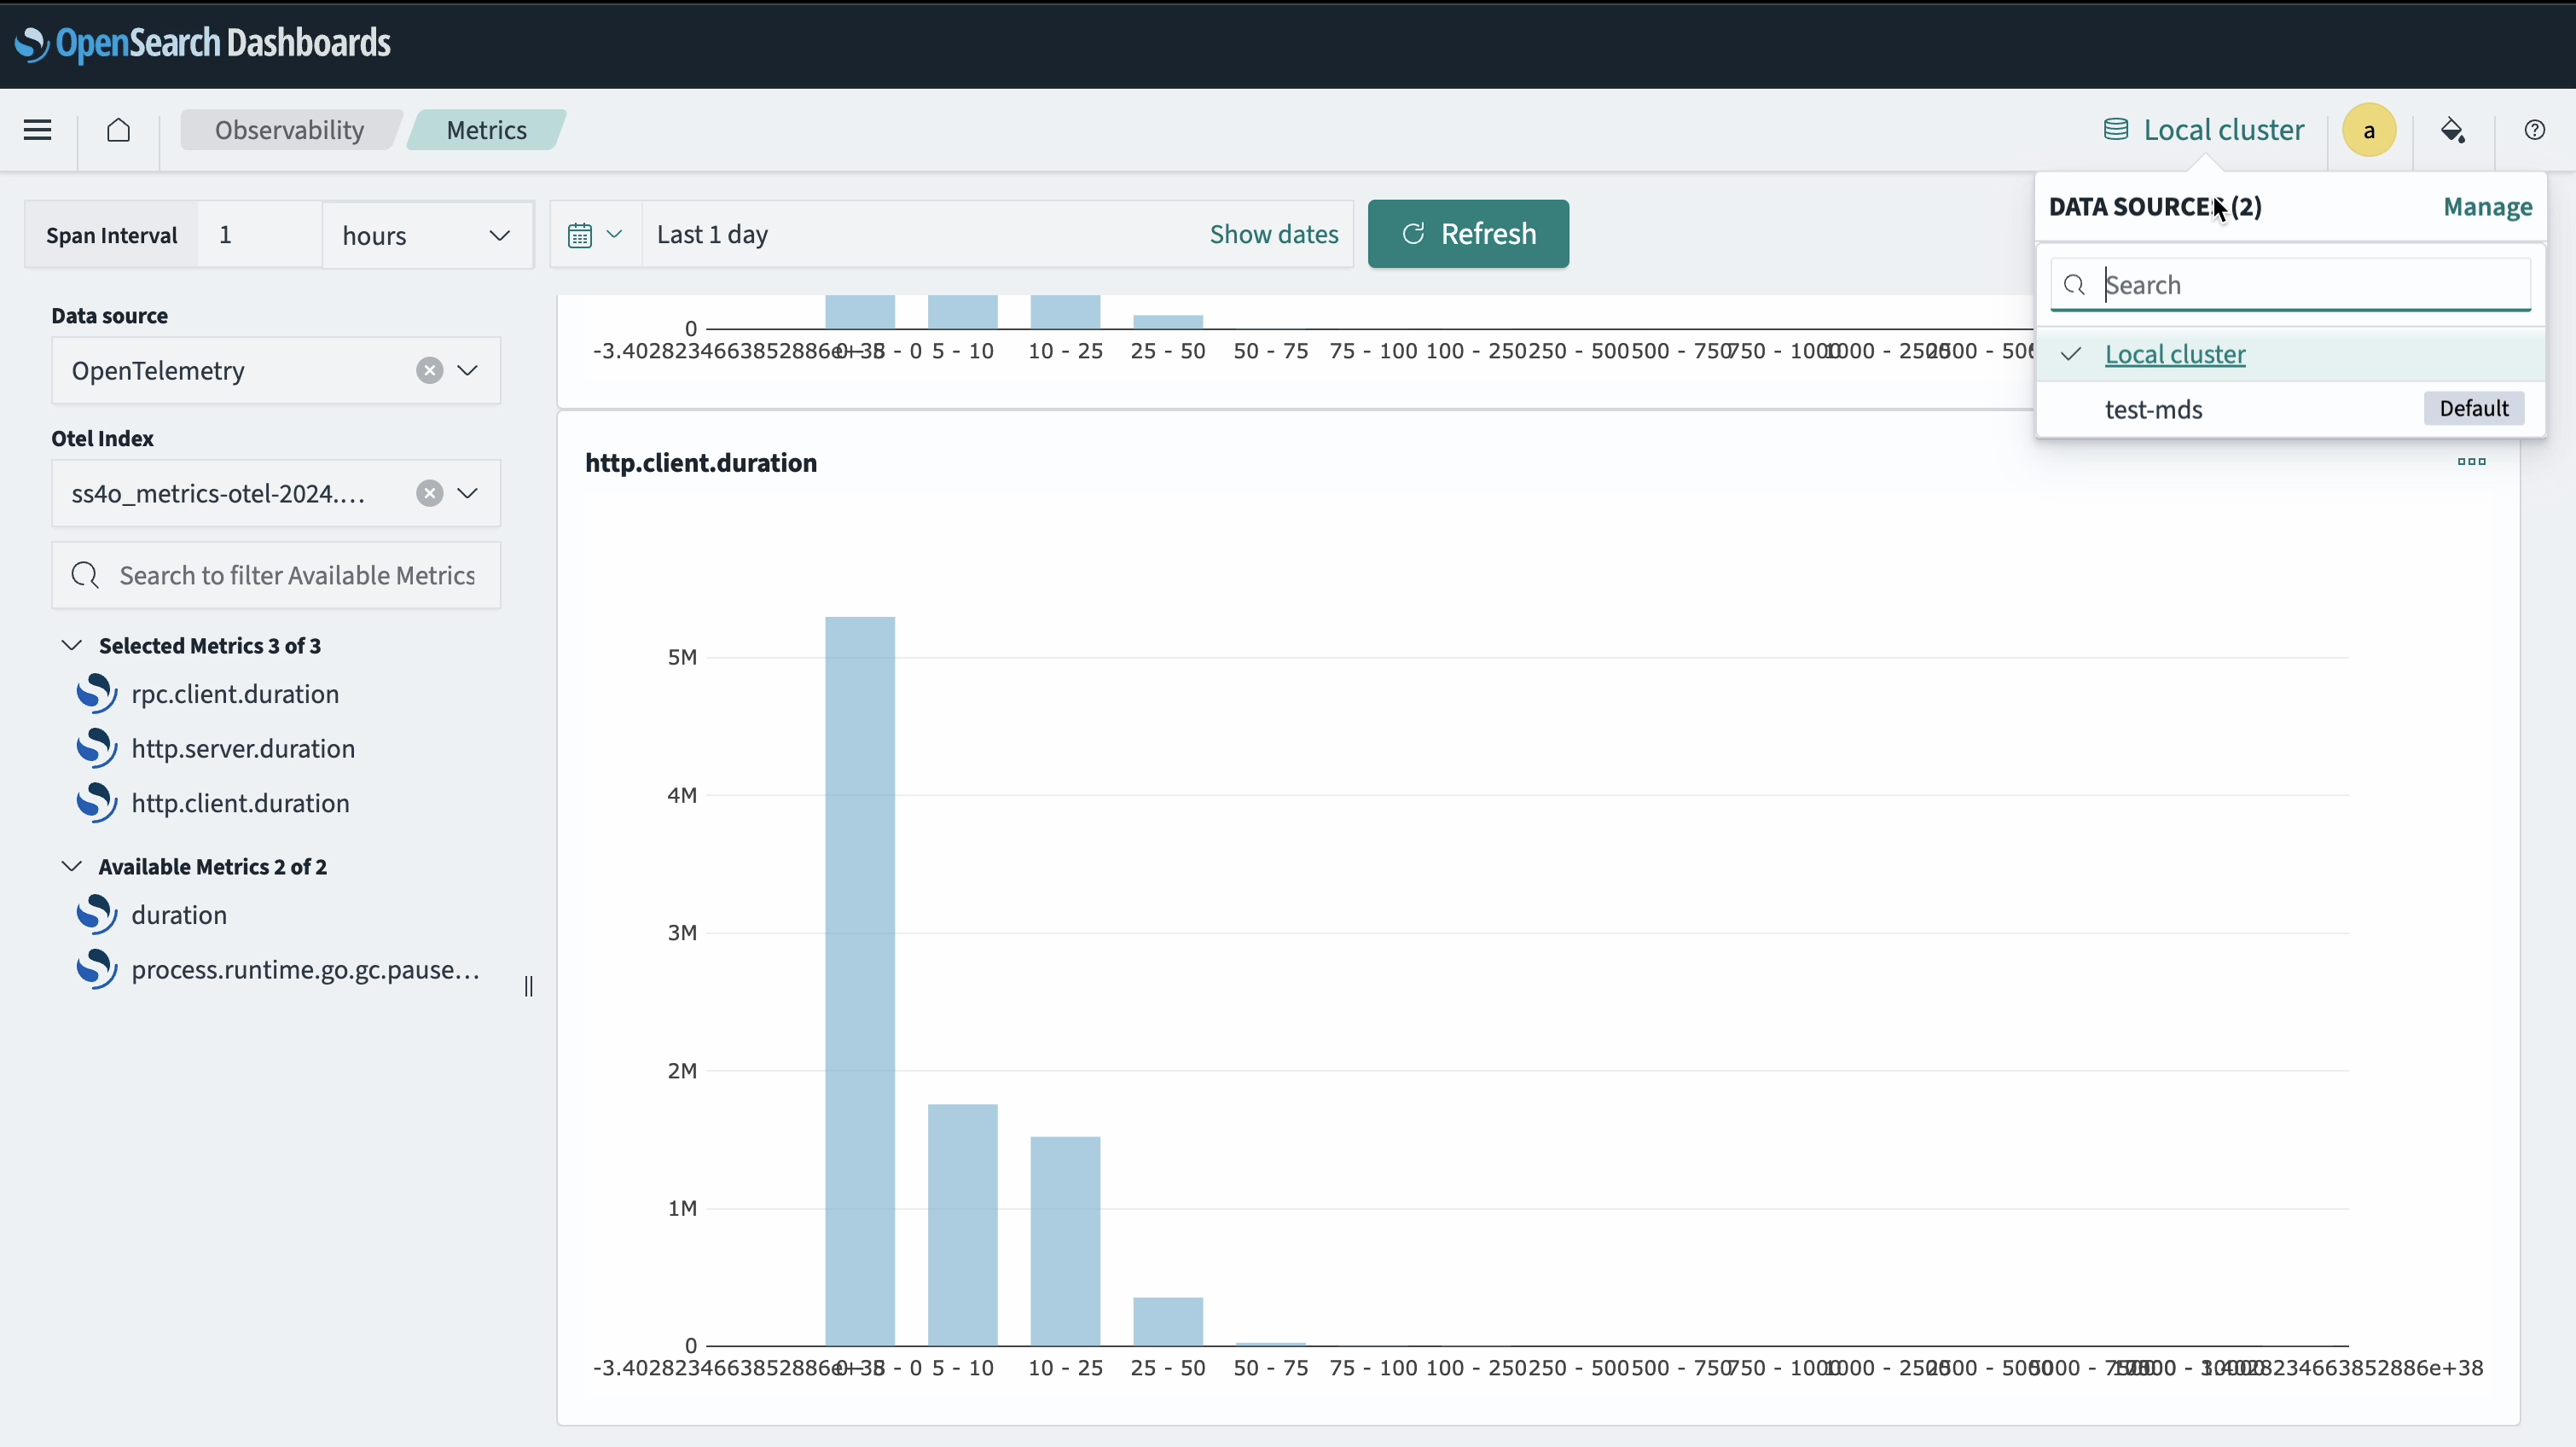
You can also view metric visualizations from other sources alongside local metric visualizations. From the DATA SOURCES dropdown menu, choose the remote metric visualization to add it to the group of visualizations already shown on the dashboard. An example dashboard is shown in the following image.
To learn about multi-cluster support for data sources, see Enable OpenSearch Dashboards to support multiple OpenSearch clusters.
Creating visualizations based on custom metrics
You can create visualizations using the metric data collected by your OpenSearch cluster, including Prometheus metrics and custom metrics.
To create these visualizations, follow these steps:
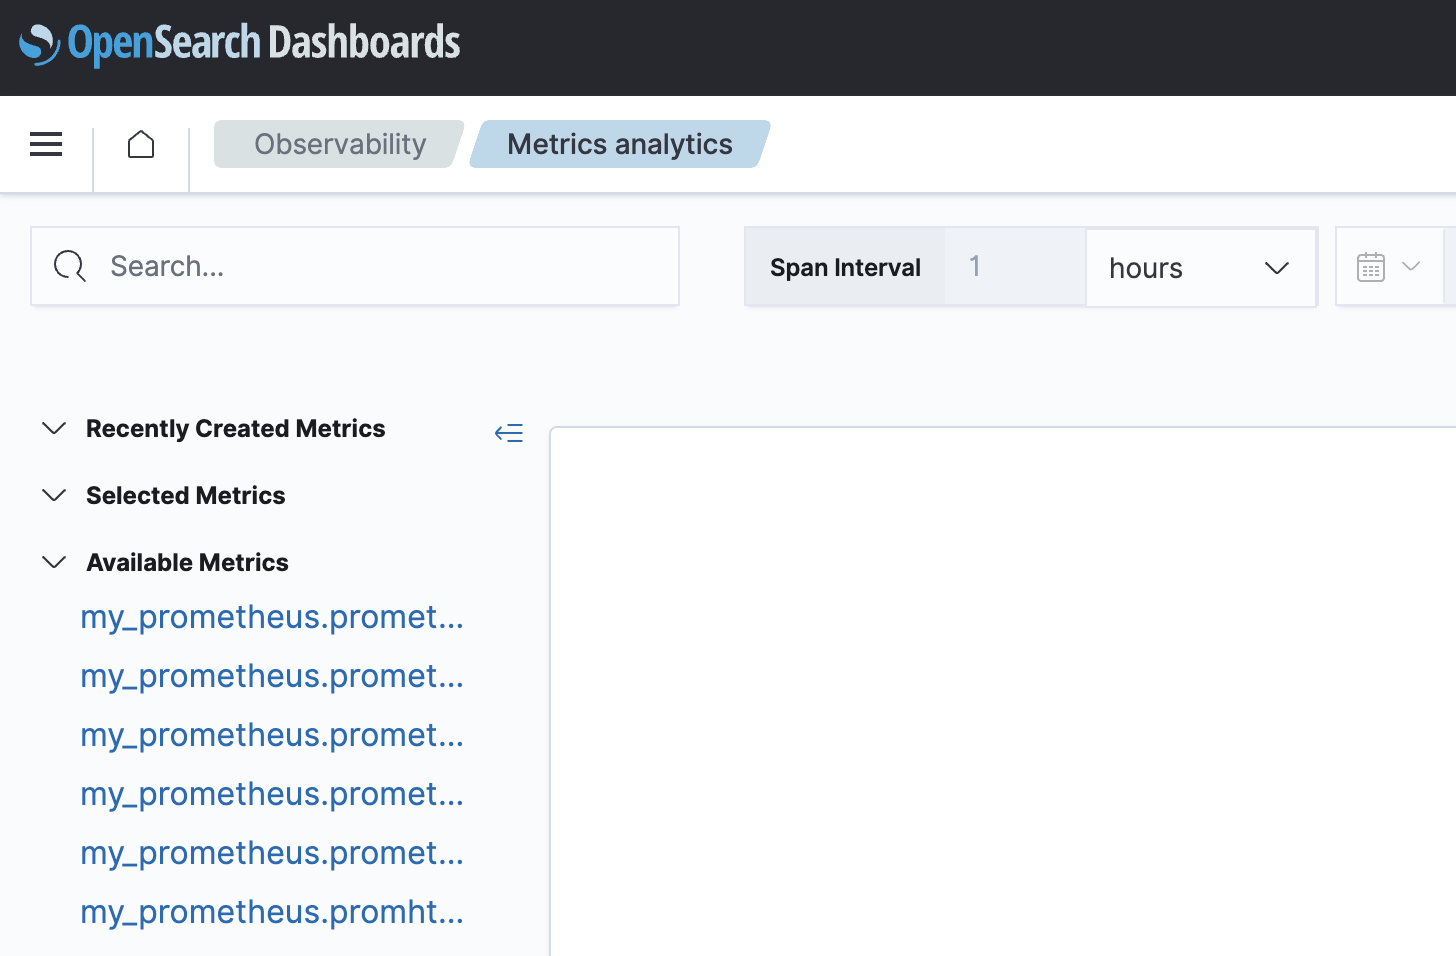
- From the OpenSearch Dashboards main menu, navigate to Observability > Metrics > Available Metrics.
- Choose the metrics to add to your visualization and then select Save.
- When prompted for a Custom operational dashboards/application, choose one of the listed options. You can edit the predefined name values in the Metric Name field.
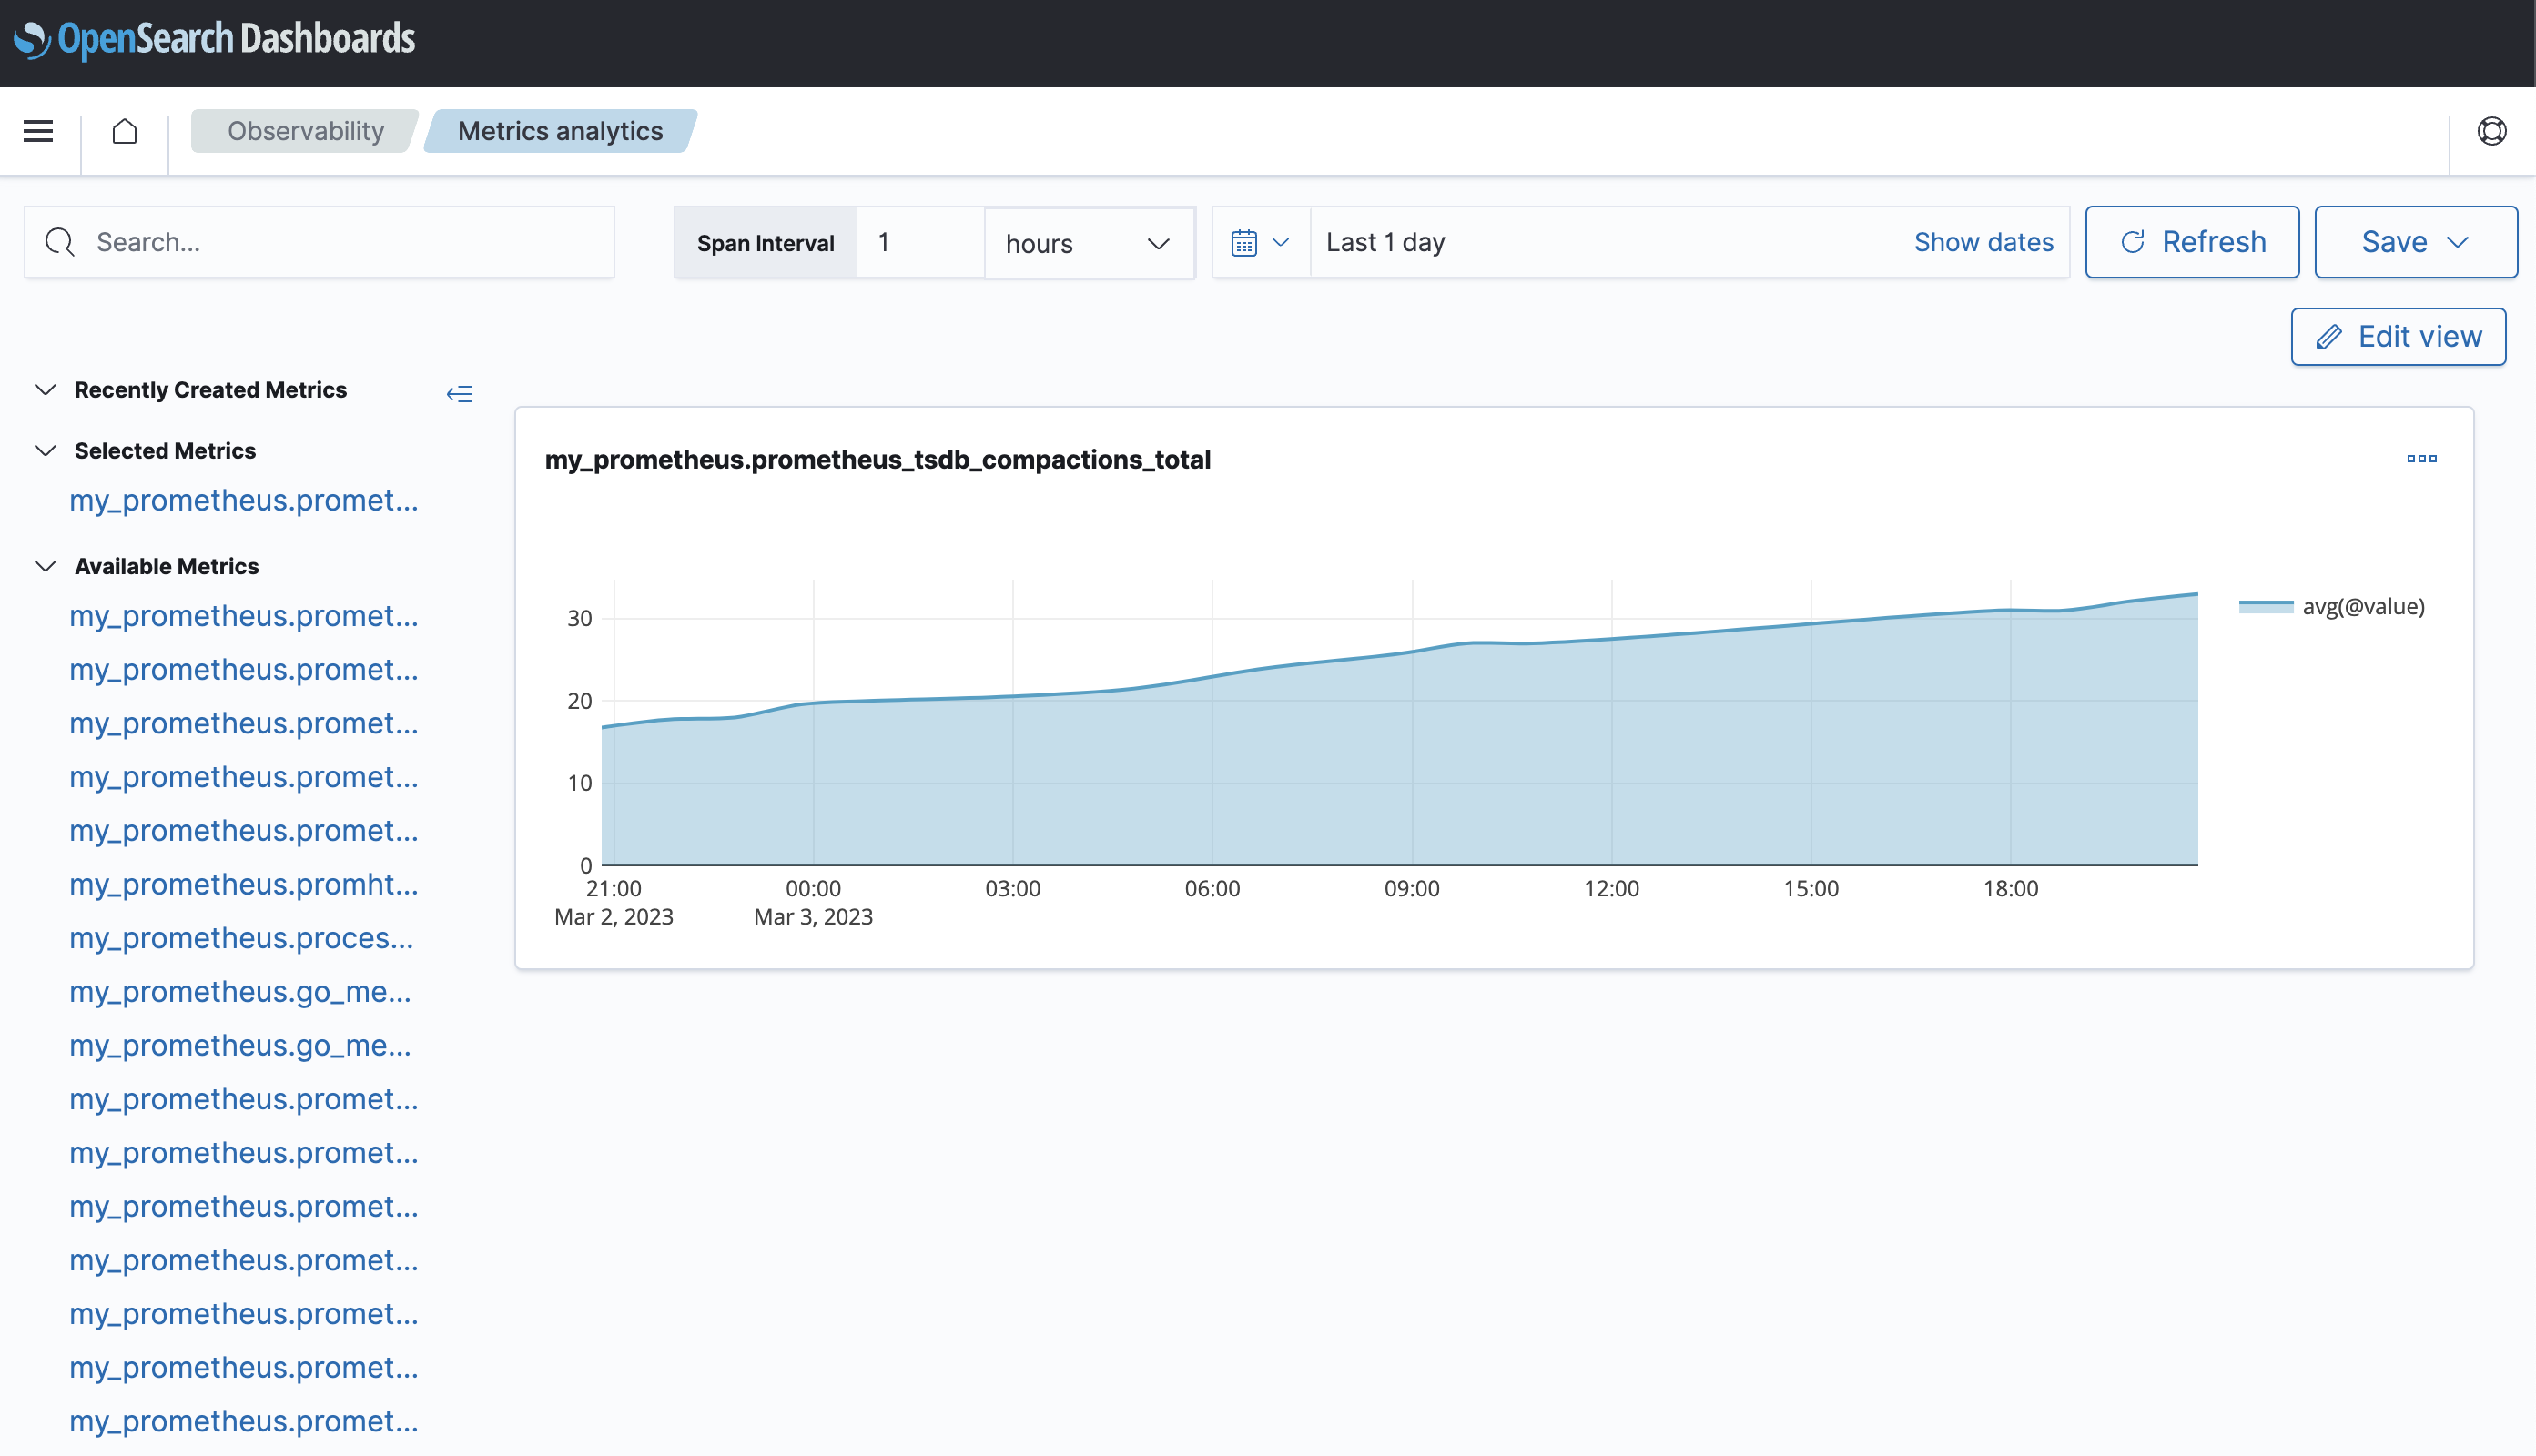
- Select Save to save your visualization. An example visualization is shown in the following image.
Defining PPL queries for Prometheus metrics
You can define Piped Processing Language (PPL) queries to interact with metrics collected by Prometheus. The following is an example PPL query for a Prometheus metric:
source = my_prometheus.prometheus_http_requests_total | stats avg(@value) by span(@timestamp,15s), handler, code
Creating a custom visualization based on the PPL query
To create a custom visualization based on the PPL query, follow these steps:
- From the Logs page, select > Event Explorer.
- On the Explorer page, enter your PPL query and select Run. Then select Save.
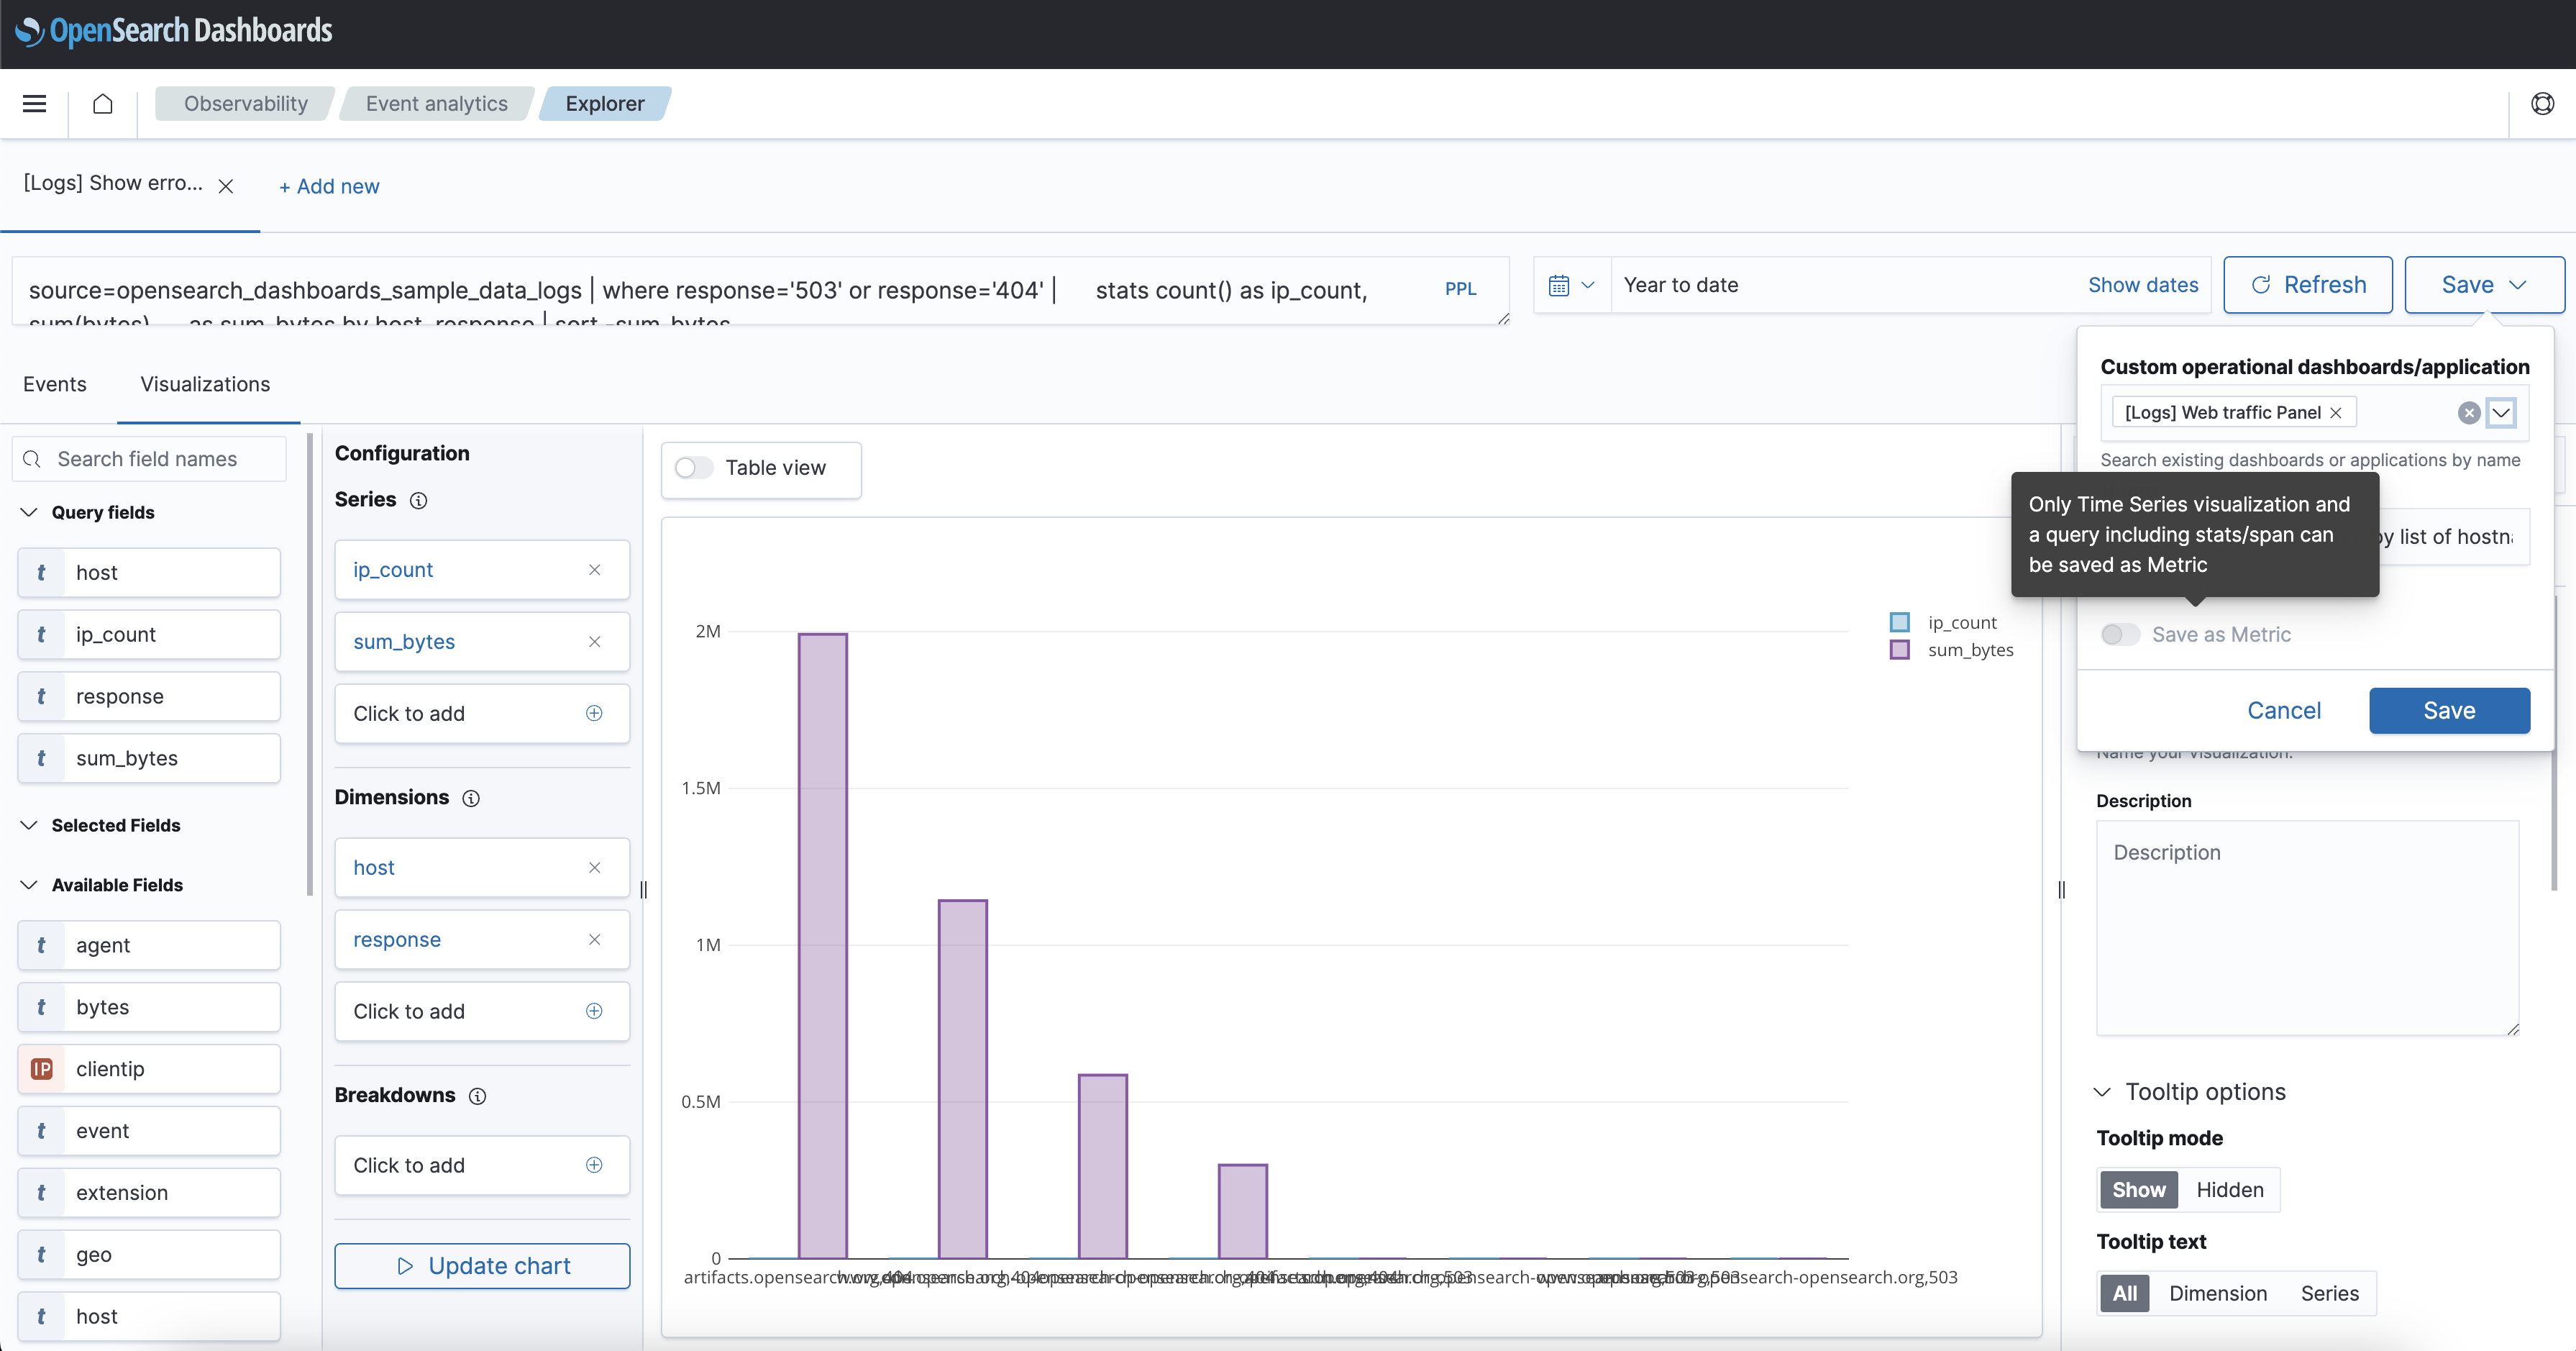
- When prompted to choose a Custom Operational Dashboards/Application, select one of the listed options. Optionally, you can edit the predefined name values in the Metric Name fields and can choose to save the visualization as a metric.
- Select Save to save your custom visualization.
Only queries that include a time-series visualization and statistics or span information can be saved as a metric, as shown in the following image.