You're viewing version 2.15 of the OpenSearch documentation. This version is no longer maintained. For the latest version, see the current documentation. For information about OpenSearch version maintenance, see Release Schedule and Maintenance Policy.
Working with alerts
The Alerts window provides features for viewing and managing alerts. It consists of:
- A bar graph displaying alert counts, dates, and statuses or severities.
- Two tabs:
- Findings: Lists detector-generated alerts, showing details such as alert time, trigger name, and the detector that triggered the alert.
- Correlations: Lists correlation-rule-generated alerts, showing details such as alert time, trigger name, and the correlation rule that triggered the alert.
You can select the Refresh button to refresh information on the Alerts page.
Alerts graph
The Alerts graph displays alerts by their status or severity. Use the Group by dropdown menu to specify either Alert status or Alert severity.
To specify a date range, select the calendar icon to activate the dropdown menu. The date selector window opens. An example window is shown in the following image. 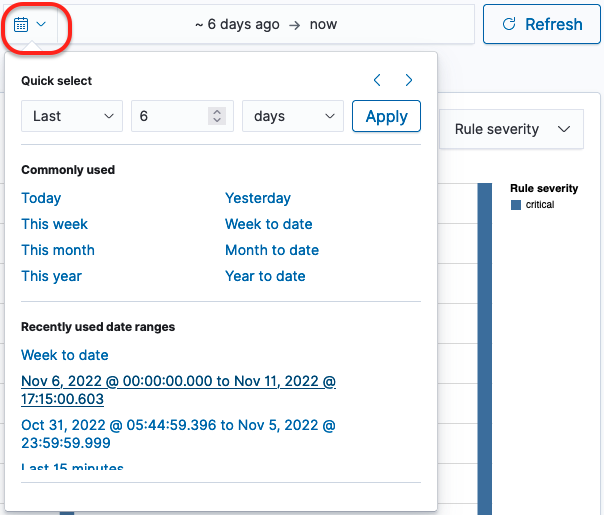
You can use the Quick select settings to specify a date range:
- Select either Last or Next from the first dropdown menu to set the date range to either behind the current setting or ahead of the current setting.
- Select a number from the second dropdown menu to define a value for the range.
- Select a unit of time from the third dropdown menu. Available options are seconds, minutes, hours, days, weeks, months, and years.
- Select the Apply button to apply the time range to the graph. The graph is immediately updated.
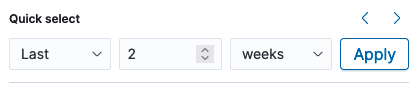
An example window is shown in the following image.
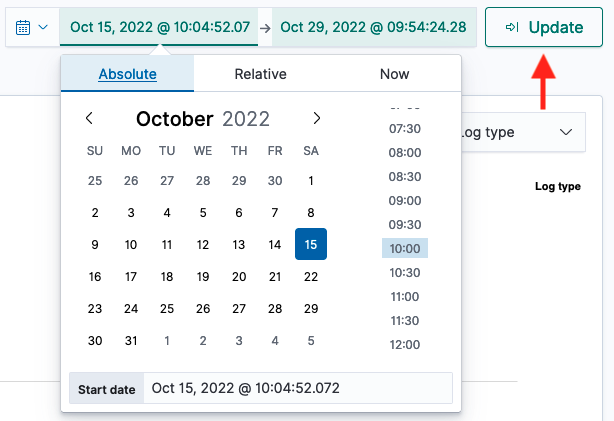
You can use the left and right arrows in the upper-left corner to shift the time range backward or forward, respectively. When you use these arrows, the start date and end date appear in the date range field. You can then select each one to set an absolute, relative, or current date and time. For absolute and relative changes, select the Update button to apply the changes.
An example window is shown in the following image.
As an alternative, you can select an option in the Commonly used section (see the preceding image of the calendar dropdown menu) to conveniently set a date range. Options include Today, Yesterday, this week, and week to date.
When a commonly used date range is selected, you can select the Show dates label in the date range field to populate the ranges. You can then select either the start date or end date to specify an absolute, relative, or current date and time setting. For absolute and relative changes, select the Update button to apply the changes.
You can also select an option from the Recently used date ranges section to revert to a previous setting.
Alerts list
The Alerts list displays all alerts, with two tabs for different types of alerts:
- Findings: The Alerts list displays all findings according to the time when the alert was triggered, the alert’s trigger name, the detector that triggered the alert, the alert status, and the alert severity.
- Correlations: The Alerts list displays all correlations, including the correlation rule and time window, the alert’s trigger name, the correlation rule name that triggered the alert, the alert status, and the alert severity.
Use the Alert severity dropdown menu to filter the list of alerts by severity. Use the Status dropdown menu to filter the list by alert status.