You're viewing version 2.18 of the OpenSearch documentation. This version is no longer maintained. For the latest version, see the current documentation. For information about OpenSearch version maintenance, see Release Schedule and Maintenance Policy.
Alert insights
This is an experimental feature and is not recommended for use in a production environment. For updates on the progress the feature or if you want to leave feedback, join the discussion in the OpenSearch forum.
The OpenSearch Dashboards Assistant alert insights help generate alert summaries and provide log patterns based on the logs that triggered the alert.
Configuring alert insights
To configure alert insights, use the following steps.
Prerequisite
Before using alert insights, you must have the alerting and alerting-dashboards plugins installed on your cluster. By default, these plugins are installed as part of standard OpenSearch distributions. For more information, see Installing plugins.
Step 1: Enable alert insights
To enable alert insights, configure the following opensearch_dashboards.yml setting:
assistant.alertInsight.enabled: true
Step 2: Create the agents
To orchestrate alert insights, you’ll need to create the necessary agents. Create a workflow template for creating all necessary agents by sending the following request:
Request
POST /_plugins/_flow_framework/workflow?provision=true
{
  "name": "Alert Summary Agent",
  "description": "Create Alert Summary Agent using Claude on BedRock",
  "use_case": "REGISTER_AGENT",
  "version": {
    "template": "1.0.0",
    "compatibility": ["2.17.0", "3.0.0"]
  },
  "workflows": {
    "provision": {
      "user_params": {},
      "nodes": [
        {
          "id": "create_claude_connector",
          "type": "create_connector",
          "previous_node_inputs": {},
          "user_inputs": {
            "version": "1",
            "name": "Claude instant runtime Connector",
            "protocol": "aws_sigv4",
            "description": "The connector to BedRock service for Claude model",
            "actions": [
              {
                "headers": {
                  "x-amz-content-sha256": "required",
                  "content-type": "application/json"
                },
                "method": "POST",
                "request_body": "{\"prompt\":\"\\n\\nHuman: ${parameters.prompt}\\n\\nAssistant:\", \"max_tokens_to_sample\":${parameters.max_tokens_to_sample}, \"temperature\":${parameters.temperature},  \"anthropic_version\":\"${parameters.anthropic_version}\" }",
                "action_type": "predict",
                "url": "https://bedrock-runtime.us-west-2.amazonaws.com/model/anthropic.claude-instant-v1/invoke"
              }
            ],
            "credential": {
                "access_key": "<YOUR_ACCESS_KEY>",
                "secret_key": "<YOUR_SECRET_KEY>",
                "session_token": "<YOUR_SESSION_TOKEN>"
            },
            "parameters": {
              "region": "us-west-2",
              "endpoint": "bedrock-runtime.us-west-2.amazonaws.com",
              "content_type": "application/json",
              "auth": "Sig_V4",
              "max_tokens_to_sample": "8000",
              "service_name": "bedrock",
              "temperature": "0.0001",
              "response_filter": "$.completion",
              "anthropic_version": "bedrock-2023-05-31"
            }
          }
        },
        {
          "id": "register_claude_model",
          "type": "register_remote_model",
          "previous_node_inputs": {
            "create_claude_connector": "connector_id"
          },
          "user_inputs": {
            "description": "Claude model",
            "deploy": true,
            "name": "claude-instant"
          }
        },
        {
          "id": "create_alert_summary_ml_model_tool",
          "type": "create_tool",
          "previous_node_inputs": {
            "register_claude_model": "model_id"
          },
          "user_inputs": {
            "parameters": {
              "prompt": "You are an OpenSearch Alert Assistant to help summarize the alerts.\n Here is the detail of alert: ${parameters.context};\n The question is: ${parameters.question}."
            },
            "name": "MLModelTool",
            "type": "MLModelTool"
          }
        },
        {
          "id": "create_alert_summary_agent",
          "type": "register_agent",
          "previous_node_inputs": {
            "create_alert_summary_ml_model_tool": "tools"
          },
          "user_inputs": {
            "parameters": {},
            "type": "flow",
            "name": "Alert Summary Agent",
            "description": "this is an alert summary agent"
          }
        }
      ]
    }
  }
}
For sample agent templates, see Flow Framework sample templates. Note the agent ID; you’ll use it in the following step.
For this example, use the templates to create the following agents:
- An alert insights agent, see flow template
- Two summary agents:
- A basic alert summary agent, see flow template
- An agent for an alert summary that includes log patterns, see flow template
These agents require different prompts. The prompt for the log patterns summary must include a placeholder
${parameters.topNLogPatternData}and additional instructions to guide the LLM on using this information effectively. Note that log patterns are available only for query monitors created using OpenSearch Dashboards.
Step 3: Create the root agents
Next, create root agents for agents created in the previous step.
Create a root agent for the alert summary agent:
POST /.plugins-ml-config/_doc/os_summary
{
  "type": "os_root_agent",
  "configuration": {
    "agent_id": "<SUMMARY_AGENT_ID>"
  }
}
Create a root agent for the alert summary with log patterns agent:
POST /.plugins-ml-config/_doc/os_summary_with_log_pattern
{
  "type": "os_root_agent",
  "configuration": {
    "agent_id": "<SUMMARY_WITH_LOG_PATTERNS_AGENT_ID>"
  }
}
Create a root agent for the alert insights agent:
POST /.plugins-ml-config/_doc/os_insight
{
  "type": "os_root_agent",
  "configuration": {
    "agent_id": "<ALERT_INSIGHTS_AGENT_ID>"
  }
}
The created os_insight agent provides alert insights related to OpenSearch cluster metrics. For insights about alerts unrelated to OpenSearch cluster metrics, you need to register an agent with this template and change the agent name to KB_For_Alert_Insight.
This example demonstrates a system index. In security-enabled domains, only superadmins have permissions to execute this code. For information about making superadmin calls, see System indexes. For access permissions, contact your system administrator.
Step 4: Test the agents
You can verify that the agents were created successfully by calling the agents with an example payload.
To test the alert summary agent, send the following request:
POST /_plugins/_ml/agents/<SUMMARY_AGENT_ID>/_execute
{
  "parameters": {
    "question": "Please summarize this alert, do not use any tool.",
    "context": "\n            Here is the detail information about alert Error log over 100\n            ### Monitor definition\n {\"type\":\"monitor\",\"schema_version\":8,\"name\":\"loghub-apache-error-log\",\"monitor_type\":\"query_level_monitor\",\"enabled\":false,\"enabled_time\":null,\"schedule\":{\"period\":{\"interval\":1,\"unit\":\"MINUTES\"}},\"inputs\":[{\"search\":{\"indices\":[\"loghub-apache-new\"],\"query\":{\"size\":0,\"query\":{\"bool\":{\"filter\":[{\"range\":{\"Time\":{\"from\":\"10/12/24 11:21 am CST||-1000000h\",\"to\":\"10/12/24 11:21 am CST\",\"include_lower\":true,\"include_upper\":true,\"boost\":1}}},{\"term\":{\"Level\":{\"value\":\"error\",\"boost\":1}}}],\"adjust_pure_negative\":true,\"boost\":1}}}}}],\"triggers\":[{\"query_level_trigger\":{\"id\":\"NAq7fpIBRJyww-JMjwP_\",\"name\":\"Error log over 100\",\"severity\":\"1\",\"condition\":{\"script\":{\"source\":\"ctx.results[0].hits.total.value > 100\",\"lang\":\"painless\"}},\"actions\":[]}}],\"last_update_time\":1728714554388,\"owner\":\"alerting\",\"associated_workflows\":[],\"associatedCompositeMonitorCnt\":0,\"item_type\":\"query_level_monitor\",\"id\":\"NQq7fpIBRJyww-JMkAMC\",\"version\":3}\n\n            ### Active Alert\n {\"ACTIVE\":1,\"ACKNOWLEDGED\":0,\"ERROR\":0,\"total\":1,\"alerts\":[{\"id\":\"Wgq8fpIBRJyww-JMegNr\",\"monitor_id\":\"NQq7fpIBRJyww-JMkAMC\",\"workflow_id\":\"\",\"workflow_name\":\"\",\"associated_alert_ids\":[],\"schema_version\":5,\"monitor_version\":1,\"monitor_name\":\"loghub-apache-error-log\",\"execution_id\":\"NQq7fpIBRJyww-JMkAMC_2024-10-12T03:18:54.311214115_22d189ce-5e93-4927-b8bb-bcf61b7537e3\",\"trigger_id\":\"NAq7fpIBRJyww-JMjwP_\",\"trigger_name\":\"Error log over 100\",\"finding_ids\":[],\"related_doc_ids\":[],\"state\":\"ACTIVE\",\"error_message\":null,\"alert_history\":[],\"severity\":\"1\",\"action_execution_results\":[],\"start_time\":\"10/12/24 11:18 am CST\",\"last_notification_time\":\"10/12/24 11:21 am CST\",\"end_time\":null,\"acknowledged_time\":null,\"alert_source\":\"monitor\"}],\"trigger_name\":\"Error log over 100\",\"severity\":\"1\",\"start_time\":\"10/12/24 11:18 am CST\",\"last_notification_time\":\"10/12/24 11:21 am CST\",\"monitor_name\":\"loghub-apache-error-log\",\"monitor_id\":\"NQq7fpIBRJyww-JMkAMC\",\"alert_source\":\"monitor\",\"triggerID\":\"NAq7fpIBRJyww-JMjwP_\"}\n\n            ### Value triggers this alert\n 595\n\n            ### Alert query DSL {\"query\":{\"bool\":{\"filter\":[{\"range\":{\"Time\":{\"from\":\"2024-10-12T03:21:54+00:00||-1000000h\",\"to\":\"2024-10-12T03:21:54+00:00\",\"include_lower\":true,\"include_upper\":true,\"boost\":1}}},{\"term\":{\"Level\":{\"value\":\"error\",\"boost\":1}}}],\"adjust_pure_negative\":true,\"boost\":1}}} \n",
  }
}
To test the alert summary with log patterns agent, send the following request:
POST /_plugins/_ml/agents/<SUMMARY_WITH_LOG_PATTERNS_AGENT_ID>/_execute
{
"parameters": {
"question": "Please summarize this alert, do not use any tool.",
"context": "\n Here is the detail information about alert Error log over 100\n ### Monitor definition\n {\"type\":\"monitor\",\"schema_version\":8,\"name\":\"loghub-apache-error-log\",\"monitor_type\":\"query_level_monitor\",\"enabled\":false,\"enabled_time\":null,\"schedule\":{\"period\":{\"interval\":1,\"unit\":\"MINUTES\"}},\"inputs\":[{\"search\":{\"indices\":[\"loghub-apache-new\"],\"query\":{\"size\":0,\"query\":{\"bool\":{\"filter\":[{\"range\":{\"Time\":{\"from\":\"10/12/24 11:21 am CST||-1000000h\",\"to\":\"10/12/24 11:21 am CST\",\"include_lower\":true,\"include_upper\":true,\"boost\":1}}},{\"term\":{\"Level\":{\"value\":\"error\",\"boost\":1}}}],\"adjust_pure_negative\":true,\"boost\":1}}}}}],\"triggers\":[{\"query_level_trigger\":{\"id\":\"NAq7fpIBRJyww-JMjwP_\",\"name\":\"Error log over 100\",\"severity\":\"1\",\"condition\":{\"script\":{\"source\":\"ctx.results[0].hits.total.value > 100\",\"lang\":\"painless\"}},\"actions\":[]}}],\"last_update_time\":1728714554388,\"owner\":\"alerting\",\"associated_workflows\":[],\"associatedCompositeMonitorCnt\":0,\"item_type\":\"query_level_monitor\",\"id\":\"NQq7fpIBRJyww-JMkAMC\",\"version\":3}\n\n ### Active Alert\n {\"ACTIVE\":1,\"ACKNOWLEDGED\":0,\"ERROR\":0,\"total\":1,\"alerts\":[{\"id\":\"Wgq8fpIBRJyww-JMegNr\",\"monitor_id\":\"NQq7fpIBRJyww-JMkAMC\",\"workflow_id\":\"\",\"workflow_name\":\"\",\"associated_alert_ids\":[],\"schema_version\":5,\"monitor_version\":1,\"monitor_name\":\"loghub-apache-error-log\",\"execution_id\":\"NQq7fpIBRJyww-JMkAMC_2024-10-12T03:18:54.311214115_22d189ce-5e93-4927-b8bb-bcf61b7537e3\",\"trigger_id\":\"NAq7fpIBRJyww-JMjwP_\",\"trigger_name\":\"Error log over 100\",\"finding_ids\":[],\"related_doc_ids\":[],\"state\":\"ACTIVE\",\"error_message\":null,\"alert_history\":[],\"severity\":\"1\",\"action_execution_results\":[],\"start_time\":\"10/12/24 11:18 am CST\",\"last_notification_time\":\"10/12/24 11:21 am CST\",\"end_time\":null,\"acknowledged_time\":null,\"alert_source\":\"monitor\"}],\"trigger_name\":\"Error log over 100\",\"severity\":\"1\",\"start_time\":\"10/12/24 11:18 am CST\",\"last_notification_time\":\"10/12/24 11:21 am CST\",\"monitor_name\":\"loghub-apache-error-log\",\"monitor_id\":\"NQq7fpIBRJyww-JMkAMC\",\"alert_source\":\"monitor\",\"triggerID\":\"NAq7fpIBRJyww-JMjwP_\"}\n\n ### Value triggers this alert\n 595\n\n ### Alert query DSL {\"query\":{\"bool\":{\"filter\":[{\"range\":{\"Time\":{\"from\":\"2024-10-12T03:21:54+00:00||-1000000h\",\"to\":\"2024-10-12T03:21:54+00:00\",\"include_lower\":true,\"include_upper\":true,\"boost\":1}}},{\"term\":{\"Level\":{\"value\":\"error\",\"boost\":1}}}],\"adjust_pure_negative\":true,\"boost\":1}}} \n",
"topNLogPatternData": "[[539,["[Sun Dec 04 07:12:44 2005] [error] mod_jk child workerEnv in error state 6","[Sun Dec 04 06:19:18 2005] [error] mod_jk child workerEnv in error state 6","[Sun Dec 04 07:18:00 2005] [error] mod_jk child workerEnv in error state 6","[Sun Dec 04 16:52:49 2005] [error] mod_jk child workerEnv in error state 7","[Sun Dec 04 06:59:47 2005] [error] mod_jk child workerEnv in error state 8","[Sun Dec 04 07:11:22 2005] [error] mod_jk child workerEnv in error state 6","[Sun Dec 04 07:18:00 2005] [error] mod_jk child workerEnv in error state 6","[Sun Dec 04 17:01:47 2005] [error] mod_jk child workerEnv in error state 6","[Sun Dec 04 17:31:12 2005] [error] mod_jk child workerEnv in error state 6","[Sun Dec 04 05:04:04 2005] [error] mod_jk child workerEnv in error state 7","[Sun Dec 04 20:24:49 2005] [error] mod_jk child workerEnv in error state 8","[Sun Dec 04 06:16:23 2005] [error] mod_jk child workerEnv in error state 6","[Sun Dec 04 20:47:17 2005] [error] mod_jk child workerEnv in error state 7","[Sun Dec 04 06:30:43 2005] [error] mod_jk child workerEnv in error state 6","[Mon Dec 05 06:35:27 2005] [error] mod_jk child workerEnv in error state 6","[Sun Dec 04 07:07:30 2005] [error] mod_jk child workerEnv in error state 8","[Sun Dec 04 07:18:00 2005] [error] mod_jk child workerEnv in error state 7","[Sun Dec 04 16:32:56 2005] [error] mod_jk child workerEnv in error state 6","[Sun Dec 04 17:01:47 2005] [error] mod_jk child workerEnv in error state 6","[Sun Dec 04 16:52:49 2005] [error] mod_jk child workerEnv in error state 8"],"[ :: ] [] _ "],[32,["[Sun Dec 04 14:29:00 2005] [error] [client 4.245.93.87] Directory index forbidden by rule: /var/www/html/","[Sun Dec 04 08:54:17 2005] [error] [client 147.31.138.75] Directory index forbidden by rule: /var/www/html/","[Sun Dec 04 17:34:57 2005] [error] [client 61.138.216.82] Directory index forbidden by rule: /var/www/html/","[Sun Dec 04 07:45:45 2005] [error] [client 63.13.186.196] Directory index forbidden by rule: /var/www/html/","[Sun Dec 04 10:53:30 2005] [error] [client 218.76.139.20] Directory index forbidden by rule: /var/www/html/","[Mon Dec 05 10:48:48 2005] [error] [client 67.166.248.235] Directory index forbidden by rule: /var/www/html/","[Sun Dec 04 15:18:36 2005] [error] [client 67.154.58.130] Directory index forbidden by rule: /var/www/html/","[Mon Dec 05 01:30:32 2005] [error] [client 211.62.201.48] Directory index forbidden by rule: /var/www/html/","[Mon Dec 05 16:45:04 2005] [error] [client 216.216.185.130] Directory index forbidden by rule: /var/www/html/","[Mon Dec 05 17:31:39 2005] [error] [client 218.75.106.250] Directory index forbidden by rule: /var/www/html/","[Mon Dec 05 19:00:56 2005] [error] [client 68.228.3.15] Directory index forbidden by rule: /var/www/html/","[Mon Dec 05 19:14:09 2005] [error] [client 61.220.139.68] Directory index forbidden by rule: /var/www/html/","[Sun Dec 04 09:35:12 2005] [error] [client 207.203.80.15] Directory index forbidden by rule: /var/www/html/","[Mon Dec 05 10:28:44 2005] [error] [client 198.232.168.9] Directory index forbidden by rule: /var/www/html/","[Sun Dec 04 16:24:05 2005] [error] [client 58.225.62.140] Directory index forbidden by rule: /var/www/html/","[Sun Dec 04 17:53:43 2005] [error] [client 218.39.132.175] Directory index forbidden by rule: /var/www/html/","[Sun Dec 04 12:33:13 2005] [error] [client 208.51.151.210] Directory index forbidden by rule: /var/www/html/","[Sun Dec 04 15:59:01 2005] [error] [client 24.83.37.136] Directory index forbidden by rule: /var/www/html/","[Sun Dec 04 11:42:43 2005] [error] [client 216.127.124.16] Directory index forbidden by rule: /var/www/html/","[Sun Dec 04 05:15:09 2005] [error] [client 222.166.160.184] Directory index forbidden by rule: /var/www/html/"],"[ :: ] [] [ ...] : ////"],[12,["[Sun Dec 04 20:47:17 2005] [error] mod_jk child init 1 -2","[Sun Dec 04 20:47:17 2005] [error] mod_jk child init 1 -2","[Mon Dec 05 07:57:02 2005] [error] mod_jk child init 1 -2","[Sun Dec 04 17:43:12 2005] [error] mod_jk child init 1 -2","[Sun Dec 04 20:47:17 2005] [error] mod_jk child init 1 -2","[Sun Dec 04 20:47:16 2005] [error] mod_jk child init 1 -2","[Mon Dec 05 07:57:02 2005] [error] mod_jk child init 1 -2","[Sun Dec 04 17:43:12 2005] [error] mod_jk child init 1 -2","[Mon Dec 05 11:06:52 2005] [error] mod_jk child init 1 -2","[Mon Dec 05 11:06:52 2005] [error] mod_jk child init 1 -2","[Mon Dec 05 11:06:52 2005] [error] mod_jk child init 1 -2","[Mon Dec 05 11:06:52 2005] [error] mod_jk child init 1 -2"],"[ :: ] [] _ -"]]"
}
}
To test the alert insights agent, send the following request:
POST /_plugins/_ml/agents/<ALERT_INSIGHTS_AGENT_ID>/_execute
{
  "parameters": {
    "question": "Please provide your insight on this alerts.",
    "context": "\n            Here is the detail information about alert Error log over 100\n            ### Monitor definition\n {\"type\":\"monitor\",\"schema_version\":8,\"name\":\"loghub-apache-error-log\",\"monitor_type\":\"query_level_monitor\",\"enabled\":false,\"enabled_time\":null,\"schedule\":{\"period\":{\"interval\":1,\"unit\":\"MINUTES\"}},\"inputs\":[{\"search\":{\"indices\":[\"loghub-apache-new\"],\"query\":{\"size\":0,\"query\":{\"bool\":{\"filter\":[{\"range\":{\"Time\":{\"from\":\"10/12/24 11:21 am CST||-1000000h\",\"to\":\"10/12/24 11:21 am CST\",\"include_lower\":true,\"include_upper\":true,\"boost\":1}}},{\"term\":{\"Level\":{\"value\":\"error\",\"boost\":1}}}],\"adjust_pure_negative\":true,\"boost\":1}}}}}],\"triggers\":[{\"query_level_trigger\":{\"id\":\"NAq7fpIBRJyww-JMjwP_\",\"name\":\"Error log over 100\",\"severity\":\"1\",\"condition\":{\"script\":{\"source\":\"ctx.results[0].hits.total.value > 100\",\"lang\":\"painless\"}},\"actions\":[]}}],\"last_update_time\":1728714554388,\"owner\":\"alerting\",\"associated_workflows\":[],\"associatedCompositeMonitorCnt\":0,\"item_type\":\"query_level_monitor\",\"id\":\"NQq7fpIBRJyww-JMkAMC\",\"version\":3}\n\n            ### Active Alert\n {\"ACTIVE\":1,\"ACKNOWLEDGED\":0,\"ERROR\":0,\"total\":1,\"alerts\":[{\"id\":\"Wgq8fpIBRJyww-JMegNr\",\"monitor_id\":\"NQq7fpIBRJyww-JMkAMC\",\"workflow_id\":\"\",\"workflow_name\":\"\",\"associated_alert_ids\":[],\"schema_version\":5,\"monitor_version\":1,\"monitor_name\":\"loghub-apache-error-log\",\"execution_id\":\"NQq7fpIBRJyww-JMkAMC_2024-10-12T03:18:54.311214115_22d189ce-5e93-4927-b8bb-bcf61b7537e3\",\"trigger_id\":\"NAq7fpIBRJyww-JMjwP_\",\"trigger_name\":\"Error log over 100\",\"finding_ids\":[],\"related_doc_ids\":[],\"state\":\"ACTIVE\",\"error_message\":null,\"alert_history\":[],\"severity\":\"1\",\"action_execution_results\":[],\"start_time\":\"10/12/24 11:18 am CST\",\"last_notification_time\":\"10/12/24 11:21 am CST\",\"end_time\":null,\"acknowledged_time\":null,\"alert_source\":\"monitor\"}],\"trigger_name\":\"Error log over 100\",\"severity\":\"1\",\"start_time\":\"10/12/24 11:18 am CST\",\"last_notification_time\":\"10/12/24 11:21 am CST\",\"monitor_name\":\"loghub-apache-error-log\",\"monitor_id\":\"NQq7fpIBRJyww-JMkAMC\",\"alert_source\":\"monitor\",\"triggerID\":\"NAq7fpIBRJyww-JMjwP_\"}\n\n            ### Value triggers this alert\n 595\n\n            ### Alert query DSL {\"query\":{\"bool\":{\"filter\":[{\"range\":{\"Time\":{\"from\":\"2024-10-12T03:21:54+00:00||-1000000h\",\"to\":\"2024-10-12T03:21:54+00:00\",\"include_lower\":true,\"include_upper\":true,\"boost\":1}}},{\"term\":{\"Level\":{\"value\":\"error\",\"boost\":1}}}],\"adjust_pure_negative\":true,\"boost\":1}}} \n",
    "summary": <OUTPUT FROM ALERT SUMMARY AGENT>
  }
}
Generating an alert summary
You can generate an alert summary by calling the /api/assistant/summary API endpoint. To generate an alert summary, the fields index, dsl, and topNLogPatternData are optional. If all three fields are provided, the agent will provide a summary with log pattern analysis; otherwise, it will provide a general summary:
POST /api/assistant/summary
{
  "summaryType": "alerts",
  "question": "Please summarize this alert, do not use any tool.",
  "context": "\n            Here is the detail information about alert Error log over 100\n            ### Monitor definition\n {\"type\":\"monitor\",\"schema_version\":8,\"name\":\"loghub-apache-error-log\",\"monitor_type\":\"query_level_monitor\",\"enabled\":false,\"enabled_time\":null,\"schedule\":{\"period\":{\"interval\":1,\"unit\":\"MINUTES\"}},\"inputs\":[{\"search\":{\"indices\":[\"loghub-apache-new\"],\"query\":{\"size\":0,\"query\":{\"bool\":{\"filter\":[{\"range\":{\"Time\":{\"from\":\"10/12/24 11:21 am CST||-1000000h\",\"to\":\"10/12/24 11:21 am CST\",\"include_lower\":true,\"include_upper\":true,\"boost\":1}}},{\"term\":{\"Level\":{\"value\":\"error\",\"boost\":1}}}],\"adjust_pure_negative\":true,\"boost\":1}}}}}],\"triggers\":[{\"query_level_trigger\":{\"id\":\"NAq7fpIBRJyww-JMjwP_\",\"name\":\"Error log over 100\",\"severity\":\"1\",\"condition\":{\"script\":{\"source\":\"ctx.results[0].hits.total.value > 100\",\"lang\":\"painless\"}},\"actions\":[]}}],\"last_update_time\":1728714554388,\"owner\":\"alerting\",\"associated_workflows\":[],\"associatedCompositeMonitorCnt\":0,\"item_type\":\"query_level_monitor\",\"id\":\"NQq7fpIBRJyww-JMkAMC\",\"version\":3}\n\n            ### Active Alert\n {\"ACTIVE\":1,\"ACKNOWLEDGED\":0,\"ERROR\":0,\"total\":1,\"alerts\":[{\"id\":\"Wgq8fpIBRJyww-JMegNr\",\"monitor_id\":\"NQq7fpIBRJyww-JMkAMC\",\"workflow_id\":\"\",\"workflow_name\":\"\",\"associated_alert_ids\":[],\"schema_version\":5,\"monitor_version\":1,\"monitor_name\":\"loghub-apache-error-log\",\"execution_id\":\"NQq7fpIBRJyww-JMkAMC_2024-10-12T03:18:54.311214115_22d189ce-5e93-4927-b8bb-bcf61b7537e3\",\"trigger_id\":\"NAq7fpIBRJyww-JMjwP_\",\"trigger_name\":\"Error log over 100\",\"finding_ids\":[],\"related_doc_ids\":[],\"state\":\"ACTIVE\",\"error_message\":null,\"alert_history\":[],\"severity\":\"1\",\"action_execution_results\":[],\"start_time\":\"10/12/24 11:18 am CST\",\"last_notification_time\":\"10/12/24 11:21 am CST\",\"end_time\":null,\"acknowledged_time\":null,\"alert_source\":\"monitor\"}],\"trigger_name\":\"Error log over 100\",\"severity\":\"1\",\"start_time\":\"10/12/24 11:18 am CST\",\"last_notification_time\":\"10/12/24 11:21 am CST\",\"monitor_name\":\"loghub-apache-error-log\",\"monitor_id\":\"NQq7fpIBRJyww-JMkAMC\",\"alert_source\":\"monitor\",\"triggerID\":\"NAq7fpIBRJyww-JMjwP_\"}\n\n            ### Value triggers this alert\n 595\n\n            ### Alert query DSL {\"query\":{\"bool\":{\"filter\":[{\"range\":{\"Time\":{\"from\":\"2024-10-12T03:21:54+00:00||-1000000h\",\"to\":\"2024-10-12T03:21:54+00:00\",\"include_lower\":true,\"include_upper\":true,\"boost\":1}}},{\"term\":{\"Level\":{\"value\":\"error\",\"boost\":1}}}],\"adjust_pure_negative\":true,\"boost\":1}}} \n",
  "index": "loghub-apache-new",
  "dsl": "{\"query\":{\"bool\":{\"filter\":[{\"range\":{\"Time\":{\"from\":\"2024-10-12T03:21:54+00:00||-1000000h\",\"to\":\"2024-10-12T03:21:54+00:00\",\"include_lower\":true,\"include_upper\":true,\"boost\":1}}},{\"term\":{\"Level\":{\"value\":\"error\",\"boost\":1}}}],\"adjust_pure_negative\":true,\"boost\":1}}}",
  "topNLogPatternData": "[[539,["[Sun Dec 04 07:12:44 2005] [error] mod_jk child workerEnv in error state 6","[Sun Dec 04 06:19:18 2005] [error] mod_jk child workerEnv in error state 6","[Sun Dec 04 07:18:00 2005] [error] mod_jk child workerEnv in error state 6","[Sun Dec 04 16:52:49 2005] [error] mod_jk child workerEnv in error state 7","[Sun Dec 04 06:59:47 2005] [error] mod_jk child workerEnv in error state 8","[Sun Dec 04 07:11:22 2005] [error] mod_jk child workerEnv in error state 6","[Sun Dec 04 07:18:00 2005] [error] mod_jk child workerEnv in error state 6","[Sun Dec 04 17:01:47 2005] [error] mod_jk child workerEnv in error state 6","[Sun Dec 04 17:31:12 2005] [error] mod_jk child workerEnv in error state 6","[Sun Dec 04 05:04:04 2005] [error] mod_jk child workerEnv in error state 7","[Sun Dec 04 20:24:49 2005] [error] mod_jk child workerEnv in error state 8","[Sun Dec 04 06:16:23 2005] [error] mod_jk child workerEnv in error state 6","[Sun Dec 04 20:47:17 2005] [error] mod_jk child workerEnv in error state 7","[Sun Dec 04 06:30:43 2005] [error] mod_jk child workerEnv in error state 6","[Mon Dec 05 06:35:27 2005] [error] mod_jk child workerEnv in error state 6","[Sun Dec 04 07:07:30 2005] [error] mod_jk child workerEnv in error state 8","[Sun Dec 04 07:18:00 2005] [error] mod_jk child workerEnv in error state 7","[Sun Dec 04 16:32:56 2005] [error] mod_jk child workerEnv in error state 6","[Sun Dec 04 17:01:47 2005] [error] mod_jk child workerEnv in error state 6","[Sun Dec 04 16:52:49 2005] [error] mod_jk child workerEnv in error state 8"],"[   :: ] [] _      "],[32,["[Sun Dec 04 14:29:00 2005] [error] [client 4.245.93.87] Directory index forbidden by rule: /var/www/html/","[Sun Dec 04 08:54:17 2005] [error] [client 147.31.138.75] Directory index forbidden by rule: /var/www/html/","[Sun Dec 04 17:34:57 2005] [error] [client 61.138.216.82] Directory index forbidden by rule: /var/www/html/","[Sun Dec 04 07:45:45 2005] [error] [client 63.13.186.196] Directory index forbidden by rule: /var/www/html/","[Sun Dec 04 10:53:30 2005] [error] [client 218.76.139.20] Directory index forbidden by rule: /var/www/html/","[Mon Dec 05 10:48:48 2005] [error] [client 67.166.248.235] Directory index forbidden by rule: /var/www/html/","[Sun Dec 04 15:18:36 2005] [error] [client 67.154.58.130] Directory index forbidden by rule: /var/www/html/","[Mon Dec 05 01:30:32 2005] [error] [client 211.62.201.48] Directory index forbidden by rule: /var/www/html/","[Mon Dec 05 16:45:04 2005] [error] [client 216.216.185.130] Directory index forbidden by rule: /var/www/html/","[Mon Dec 05 17:31:39 2005] [error] [client 218.75.106.250] Directory index forbidden by rule: /var/www/html/","[Mon Dec 05 19:00:56 2005] [error] [client 68.228.3.15] Directory index forbidden by rule: /var/www/html/","[Mon Dec 05 19:14:09 2005] [error] [client 61.220.139.68] Directory index forbidden by rule: /var/www/html/","[Sun Dec 04 09:35:12 2005] [error] [client 207.203.80.15] Directory index forbidden by rule: /var/www/html/","[Mon Dec 05 10:28:44 2005] [error] [client 198.232.168.9] Directory index forbidden by rule: /var/www/html/","[Sun Dec 04 16:24:05 2005] [error] [client 58.225.62.140] Directory index forbidden by rule: /var/www/html/","[Sun Dec 04 17:53:43 2005] [error] [client 218.39.132.175] Directory index forbidden by rule: /var/www/html/","[Sun Dec 04 12:33:13 2005] [error] [client 208.51.151.210] Directory index forbidden by rule: /var/www/html/","[Sun Dec 04 15:59:01 2005] [error] [client 24.83.37.136] Directory index forbidden by rule: /var/www/html/","[Sun Dec 04 11:42:43 2005] [error] [client 216.127.124.16] Directory index forbidden by rule: /var/www/html/","[Sun Dec 04 05:15:09 2005] [error] [client 222.166.160.184] Directory index forbidden by rule: /var/www/html/"],"[   :: ] [] [ ...]     : ////"],[12,["[Sun Dec 04 20:47:17 2005] [error] mod_jk child init 1 -2","[Sun Dec 04 20:47:17 2005] [error] mod_jk child init 1 -2","[Mon Dec 05 07:57:02 2005] [error] mod_jk child init 1 -2","[Sun Dec 04 17:43:12 2005] [error] mod_jk child init 1 -2","[Sun Dec 04 20:47:17 2005] [error] mod_jk child init 1 -2","[Sun Dec 04 20:47:16 2005] [error] mod_jk child init 1 -2","[Mon Dec 05 07:57:02 2005] [error] mod_jk child init 1 -2","[Sun Dec 04 17:43:12 2005] [error] mod_jk child init 1 -2","[Mon Dec 05 11:06:52 2005] [error] mod_jk child init 1 -2","[Mon Dec 05 11:06:52 2005] [error] mod_jk child init 1 -2","[Mon Dec 05 11:06:52 2005] [error] mod_jk child init 1 -2","[Mon Dec 05 11:06:52 2005] [error] mod_jk child init 1 -2"],"[   :: ] [] _    -"]]"
}
The following table describes the Assistant Summary API parameters.
| Parameter | Required/Optional | Description |
|---|---|---|
summaryType | Required | Specifies the type of application calling this API. Use alerts for alert insights. |
question | Required | Specifies the user’s question regarding alert insights. Default is Please summarize this alert, do not use any tool. |
context | Required | Provides context for the alert, including the alert monitor definition, active alerts, and trigger values. |
index | Optional | The index that the alert monitors. If this parameter is not provided, log pattern analysis is not returned. |
dsl | Optional | The DSL query for alert monitoring. If this parameter is not provided, log pattern analysis is not returned. |
topNLogPatternData | Optional | Log patterns for the alert trigger data. If this parameter is not provided, log pattern analysis is not returned. |
Generating alert insights
You can generate alert insights by calling the /api/assistant/insight API endpoint. To generate alert insights, all of the following parameters are required:
POST /api/assistant/insight
{
  "summaryType": "alerts",
  "insightType": "user_insight"
  "context": "\n            Here is the detail information about alert Error log over 100\n            ### Monitor definition\n {\"type\":\"monitor\",\"schema_version\":8,\"name\":\"loghub-apache-error-log\",\"monitor_type\":\"query_level_monitor\",\"enabled\":false,\"enabled_time\":null,\"schedule\":{\"period\":{\"interval\":1,\"unit\":\"MINUTES\"}},\"inputs\":[{\"search\":{\"indices\":[\"loghub-apache-new\"],\"query\":{\"size\":0,\"query\":{\"bool\":{\"filter\":[{\"range\":{\"Time\":{\"from\":\"10/12/24 11:21 am CST||-1000000h\",\"to\":\"10/12/24 11:21 am CST\",\"include_lower\":true,\"include_upper\":true,\"boost\":1}}},{\"term\":{\"Level\":{\"value\":\"error\",\"boost\":1}}}],\"adjust_pure_negative\":true,\"boost\":1}}}}}],\"triggers\":[{\"query_level_trigger\":{\"id\":\"NAq7fpIBRJyww-JMjwP_\",\"name\":\"Error log over 100\",\"severity\":\"1\",\"condition\":{\"script\":{\"source\":\"ctx.results[0].hits.total.value > 100\",\"lang\":\"painless\"}},\"actions\":[]}}],\"last_update_time\":1728714554388,\"owner\":\"alerting\",\"associated_workflows\":[],\"associatedCompositeMonitorCnt\":0,\"item_type\":\"query_level_monitor\",\"id\":\"NQq7fpIBRJyww-JMkAMC\",\"version\":3}\n\n            ### Active Alert\n {\"ACTIVE\":1,\"ACKNOWLEDGED\":0,\"ERROR\":0,\"total\":1,\"alerts\":[{\"id\":\"Wgq8fpIBRJyww-JMegNr\",\"monitor_id\":\"NQq7fpIBRJyww-JMkAMC\",\"workflow_id\":\"\",\"workflow_name\":\"\",\"associated_alert_ids\":[],\"schema_version\":5,\"monitor_version\":1,\"monitor_name\":\"loghub-apache-error-log\",\"execution_id\":\"NQq7fpIBRJyww-JMkAMC_2024-10-12T03:18:54.311214115_22d189ce-5e93-4927-b8bb-bcf61b7537e3\",\"trigger_id\":\"NAq7fpIBRJyww-JMjwP_\",\"trigger_name\":\"Error log over 100\",\"finding_ids\":[],\"related_doc_ids\":[],\"state\":\"ACTIVE\",\"error_message\":null,\"alert_history\":[],\"severity\":\"1\",\"action_execution_results\":[],\"start_time\":\"10/12/24 11:18 am CST\",\"last_notification_time\":\"10/12/24 11:21 am CST\",\"end_time\":null,\"acknowledged_time\":null,\"alert_source\":\"monitor\"}],\"trigger_name\":\"Error log over 100\",\"severity\":\"1\",\"start_time\":\"10/12/24 11:18 am CST\",\"last_notification_time\":\"10/12/24 11:21 am CST\",\"monitor_name\":\"loghub-apache-error-log\",\"monitor_id\":\"NQq7fpIBRJyww-JMkAMC\",\"alert_source\":\"monitor\",\"triggerID\":\"NAq7fpIBRJyww-JMjwP_\"}\n\n            ### Value triggers this alert\n 595\n\n            ### Alert query DSL {\"query\":{\"bool\":{\"filter\":[{\"range\":{\"Time\":{\"from\":\"2024-10-12T03:21:54+00:00||-1000000h\",\"to\":\"2024-10-12T03:21:54+00:00\",\"include_lower\":true,\"include_upper\":true,\"boost\":1}}},{\"term\":{\"Level\":{\"value\":\"error\",\"boost\":1}}}],\"adjust_pure_negative\":true,\"boost\":1}}} \n",
  "question": "Please provide your insight on this alerts.",
  "summary": <OUTPUT FROM ALERT SUMMARY AGENT>
}
The following table describes the Assistant Insight API parameters.
| Parameter | Required/Optional | Description |
|---|---|---|
summaryType | Required | Specifies the type of application calling this API. Use alerts for alert insights. |
insightType | Required | Defines the alert type. Use os_insight for cluster metrics alerts and user_insight for other alert types. |
question | Required | Specifies the user’s question regarding alert insights. Default is Please provide your insight on this alerts. |
context | Required | Provides context for the alert, including the alert monitor definition, active alerts, and trigger values. |
summary | Required | The result returned by the alert summary agent. |
Viewing alert insights in OpenSearch Dashboards
Before viewing alert insights, you must configure alerts in OpenSearch Dashboards. For more information, see Alerting.
To view alert insights in OpenSearch Dashboards, use the following steps:
-
On the top menu bar, go to OpenSearch Plugins > Alerting. All alerts are displayed.
-
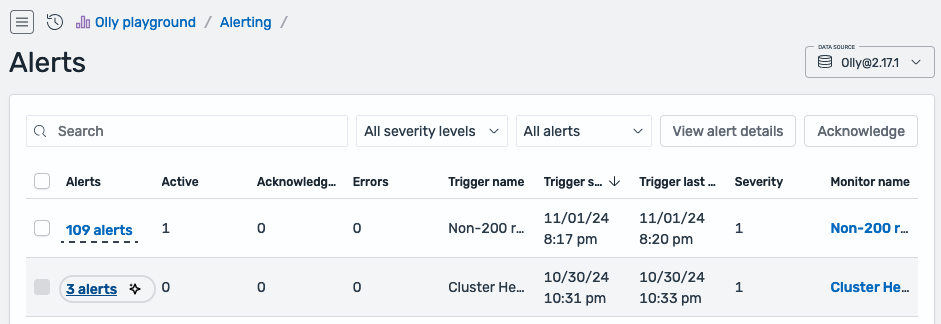
Hover over the alerts for your desired monitor. If you configured alert insights, you will see a sparkle icon (
 ) next to the alerts in the Alerts column, as shown in the following image.
-
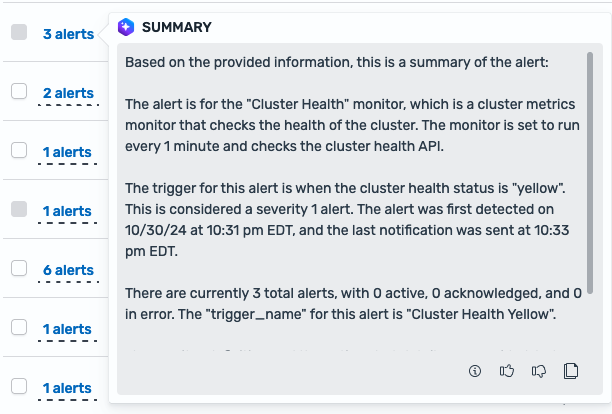
Select the alerts label or the sparkle icon. You will see the generated summary, as shown in the following image.

-
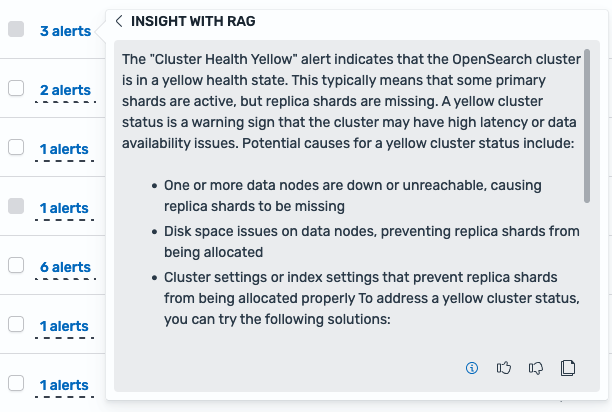
Select the information icon (
 ) to view alert insights. You will see the generated alert insights, as shown in the following image.