You're viewing version 2.18 of the OpenSearch documentation. This version is no longer maintained. For the latest version, see the current documentation. For information about OpenSearch version maintenance, see Release Schedule and Maintenance Policy.
Analyzing Jaeger trace data
Introduced 2.5
The trace analytics functionality in the OpenSearch Observability plugin now supports Jaeger trace data. If you use OpenSearch as the backend for Jaeger trace data, you can use the built-in trace analytics capabilities. This provides support for OpenTelemetry (OTel) trace data.
When you perform trace analytics, you can select from two data sources:
- OpenSearch Data Prepper – Data ingested into OpenSearch through OpenSearch Data Prepper
- Jaeger – Trace data stored within OpenSearch as its backend
If you store your Jaeger trace data in OpenSearch, you can now use the built-in trace analytics capabilities to analyze the error rates and latency. You can also filter the traces and analyze the span details of a trace to pinpoint any service issues.
When you ingest Jaeger data into OpenSearch, it gets stored in a different index than the OTel-generated index that gets created when you run data through OpenSearch Data Prepper. Use the data source selector in OpenSearch Dashboards to indicate the data source on which you want to perform trace analytics.
Jaeger trace data that you can analyze includes span data as well as service and operation endpoint data.
By default, each time you ingest data for Jaeger, it creates a separate index for that day.
To learn more about Jaeger data tracing, see the Jaeger documentation.
Data ingestion requirements
To perform trace analytics on Jaeger data, you need to configure error capability.
Jaeger data that is ingested into OpenSearch must have the environment variable ES_TAGS_AS_FIELDS_ALL set to true for errors. If data is not ingested in this format, it will not work for errors, and error data will not be available for traces in trace analytics with OpenSearch.
About data ingestion with Jaeger indexes
Trace analytics for non-Jaeger data uses OTel indexes with the naming conventions otel-v1-apm-span-* or otel-v1-apm-service-map*.
Jaeger indexes follow the naming conventions jaeger-span-* or jaeger-service-*.
Setting up OpenSearch to use Jaeger data
The following section provides a sample Docker Compose file that contains the configuration required to enable errors for trace analytics.
Step 1: Run the Docker Compose file
Use the following Docker Compose file to enable Jaeger data for trace analytics. Set the ES_TAGS_AS_FIELDS_ALL environment variable set to true to enable errors to be added to trace data.
Copy the following Docker Compose file and save it as docker-compose.yml:
version: '3'
services:
  opensearch-node1: # This is also the hostname of the container within the Docker network (i.e. https://opensearch-node1/)
    image: opensearchproject/opensearch:latest # Specifying the latest available image - modify if you want a specific version
    container_name: opensearch-node1
    environment:
      - cluster.name=opensearch-cluster # Name the cluster
      - node.name=opensearch-node1 # Name the node that will run in this container
      - discovery.seed_hosts=opensearch-node1,opensearch-node2 # Nodes to look for when discovering the cluster
      - cluster.initial_cluster_manager_nodes=opensearch-node1,opensearch-node2 # Nodes eligible to serve as cluster manager
      - bootstrap.memory_lock=true # Disable JVM heap memory swapping
      - "OPENSEARCH_JAVA_OPTS=-Xms512m -Xmx512m" # Set min and max JVM heap sizes to at least 50% of system RAM
    ulimits:
      memlock:
        soft: -1 # Set memlock to unlimited (no soft or hard limit)
        hard: -1
      nofile:
        soft: 65536 # Maximum number of open files for the opensearch user - set to at least 65536
        hard: 65536
    volumes:
      - opensearch-data1:/usr/share/opensearch/data # Creates volume called opensearch-data1 and mounts it to the container
    ports:
      - "9200:9200"
      - "9600:9600"
    networks:
      - opensearch-net # All of the containers will join the same Docker bridge network

  opensearch-node2:
    image: opensearchproject/opensearch:latest # This should be the same image used for opensearch-node1 to avoid issues
    container_name: opensearch-node2
    environment:
      - cluster.name=opensearch-cluster
      - node.name=opensearch-node2
      - discovery.seed_hosts=opensearch-node1,opensearch-node2
      - cluster.initial_cluster_manager_nodes=opensearch-node1,opensearch-node2
      - bootstrap.memory_lock=true
      - "OPENSEARCH_JAVA_OPTS=-Xms512m -Xmx512m"
    ulimits:
      memlock:
        soft: -1
        hard: -1
      nofile:
        soft: 65536
        hard: 65536
    volumes:
      - opensearch-data2:/usr/share/opensearch/data
    networks:
      - opensearch-net
  opensearch-dashboards:
    image: opensearchproject/opensearch-dashboards:latest # Make sure the version of opensearch-dashboards matches the version of opensearch installed on other nodes
    container_name: opensearch-dashboards
    ports:
      - 5601:5601 # Map host port 5601 to container port 5601
    expose:
      - "5601" # Expose port 5601 for web access to OpenSearch Dashboards
    environment:
      OPENSEARCH_HOSTS: '["https://opensearch-node1:9200","https://opensearch-node2:9200"]' # Define the OpenSearch nodes that OpenSearch Dashboards will query
    networks:
      - opensearch-net

  jaeger-collector:
    image: jaegertracing/jaeger-collector:latest
    ports:
      - "14269:14269"
      - "14268:14268"
      - "14267:14267"
      - "14250:14250"
      - "9411:9411"
    networks:
      - opensearch-net
    restart: on-failure
    environment:
      - SPAN_STORAGE_TYPE=opensearch
      - ES_TAGS_AS_FIELDS_ALL=true
      - ES_USERNAME=admin
      - ES_PASSWORD=admin
      - ES_TLS_SKIP_HOST_VERIFY=true
    command: [
      "--es.server-urls=https://opensearch-node1:9200",
      "--es.tls.enabled=true",
    ]
    depends_on:
      - opensearch-node1

  jaeger-agent:
    image: jaegertracing/jaeger-agent:latest
    hostname: jaeger-agent
    command: ["--reporter.grpc.host-port=jaeger-collector:14250"]
    ports:
      - "5775:5775/udp"
      - "6831:6831/udp"
      - "6832:6832/udp"
      - "5778:5778"
    networks:
      - opensearch-net
    restart: on-failure
    environment:
      - SPAN_STORAGE_TYPE=opensearch
    depends_on:
      - jaeger-collector

  hotrod:
    image: jaegertracing/example-hotrod:latest
    ports:
      - "8080:8080"
    command: ["all"]
    environment:
      - JAEGER_AGENT_HOST=jaeger-agent
      - JAEGER_AGENT_PORT=6831
    networks:
      - opensearch-net
    depends_on:
      - jaeger-agent

volumes:
  opensearch-data1:
  opensearch-data2:

networks:
  opensearch-net:
Step 2: Start the cluster
Run the following command to deploy the Docker compose YAML file:
docker compose up -d
To stop the cluster, run the following command:
docker compose down
Step 3: Generate sample data
Use the sample app provided with the Docker file to generate data. After you run the Docker Compose file, it runs the sample app on local host port 8080. To open the app, go to http://localhost:8080.
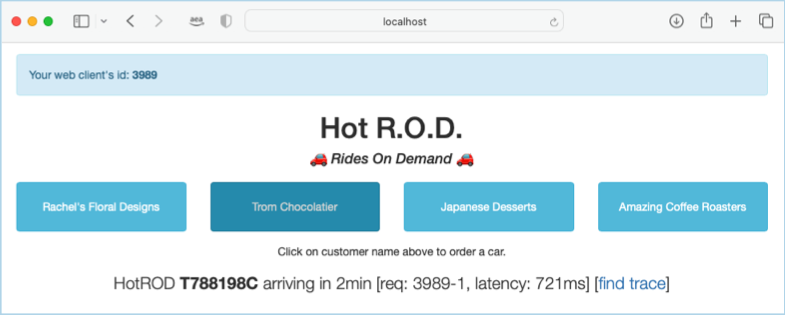
In the sample app, Hot R.O.D., select any button to generate data. Now you can view trace data in Dashboards.
Step 4: View trace data in OpenSearch Dashboards
After you generate Jaeger trace data, you can view it in Dashboards.
Go to Trace analytics at http://localhost:5601/app/observability-dashboards#/trace_analytics/home.
Using trace analytics in OpenSearch Dashboards
To analyze the Jaeger trace data in Dashboards, first set up the trace analytics functionality. To get started, see Get started with trace analytics.
Data sources
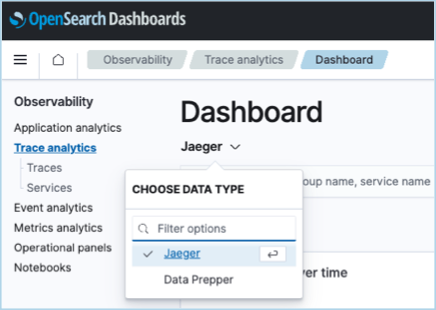
You can specify either OpenSearch Data Prepper or Jaeger as the data source when you perform trace analytics. From Dashboards, go to Observability > Trace analytics and select Jaeger.
Dashboard view
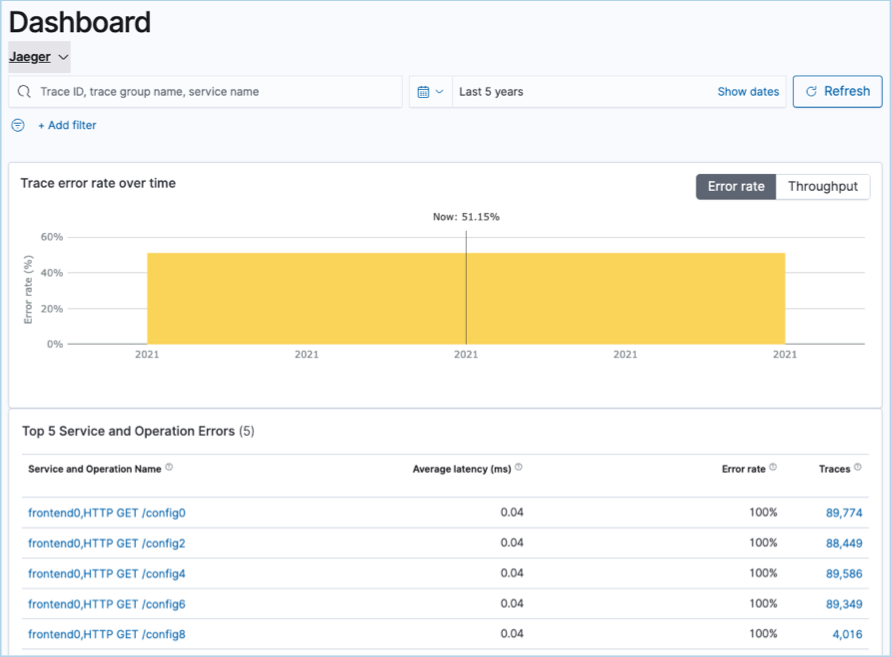
After you select Jaeger as the data source, you can view all of the indexed data in Dashboard view, including Error rate and Throughput.
Error rate
You can view the trace error count over time in Dashboard view and also see the top five combinations of services and operations that have a non-zero error rate.
Throughput
With Throughput selected, you can see the throughput of Jaeger index traces over time.
You can select an individual trace from the Top 5 Service and Operation Latency list and view the detailed trace data.
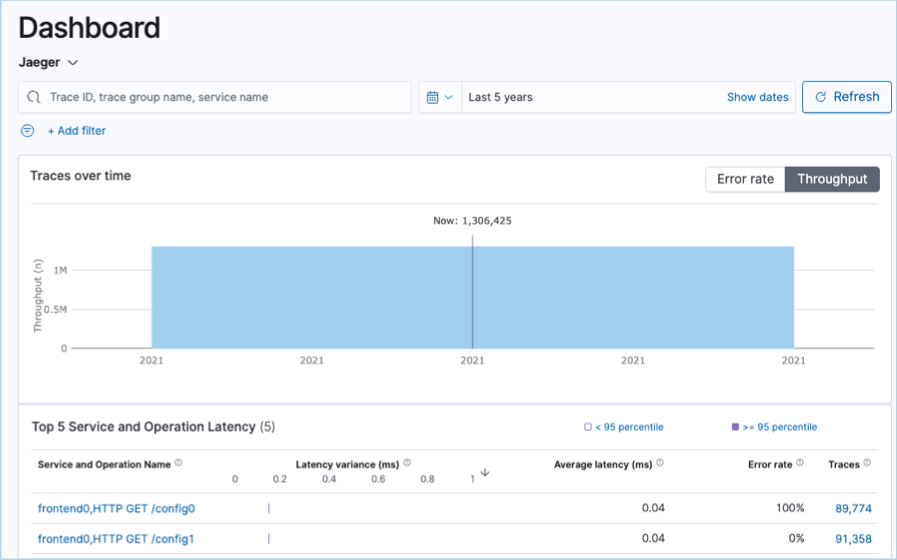
You can also see the combinations of services and operations that have the highest latency.
If you select one of the entries for Service and Operation Name and go to the Traces column to select a trace, it will automatically add the service and operation as filters.
Traces
In Traces, you can see the latency and errors for the filtered service and operation for each individual trace ID in the list.
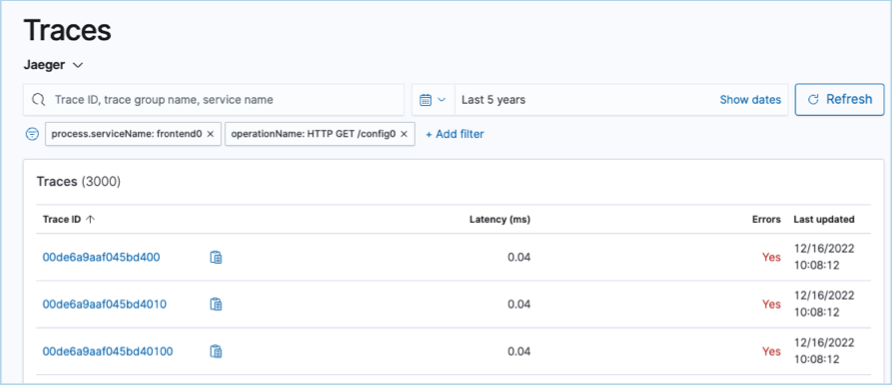
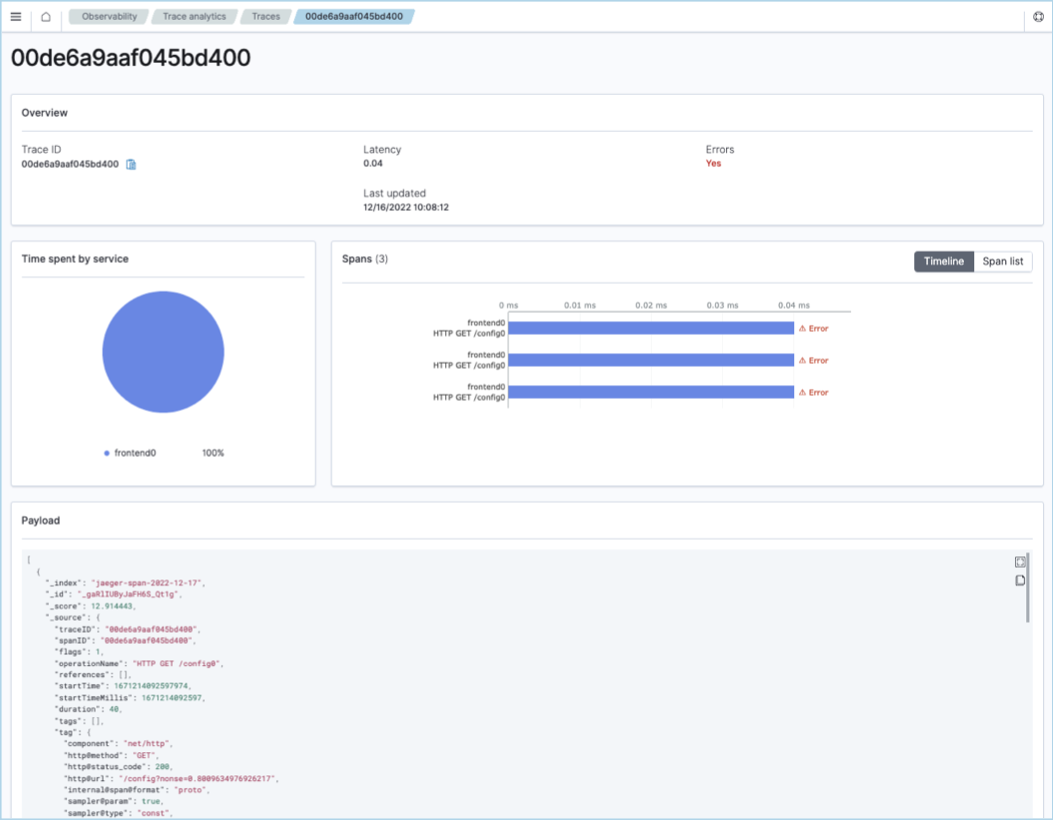
If you select an individual trace ID, you can see more detailed information about the trace, such as Time spent by the service and Spans. You can also view the index payload in JSON format.
Services
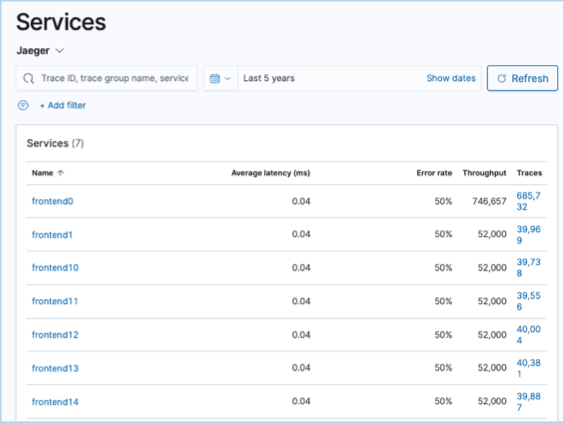
You can also view the individual error rates and latency for each individual service. Go to Observability > Trace analytics > Services. In Services, you can see the average latency, error rate, throughput and trace for each service in the list.
