You're viewing version 2.3 of the OpenSearch documentation. This version is no longer maintained. For the latest version, see the current documentation. For information about OpenSearch version maintenance, see Release Schedule and Maintenance Policy.
The drag-and-drop visualization wizard is an experimental feature in OpenSearch 2.3. Therefore, we do not recommend the use of the drag-and-drop wizard in a production environment. For updates on the progress of drag and drop, or if you want to leave feedback that could help improve the feature, see the Drag and drop git issue.
Using the drag-and-drop wizard
You can use the drag-and-drop visualization wizard in OpenSearch Dashboards to create your data visualizations easily with just a few clicks or a single mouse gesture.
The drag-and-drop visualization wizard:
- Gives you an immediate view of your data without the need to preselect the visualization output.
- Gives you the flexibility to change visualization types and index patterns quickly.
- Gives you the ability to easily navigate between multiple screens.
Try out the wizard
You can try out the wizard locally or in the OpenSearch playground.
Try the wizard in OpenSearch playground
If you’d like to try out the wizard without installing OpenSearch locally, you can do so in the OpenSearch Dashboards playground. The feature is enabled in the playground by default.
Try the wizard locally
To enable the drag-and-drop wizard in your local installation, add the following flag to the opensearch_dashboards.yml file:
wizard.enabled: true
Then confirm that the feature is enabled in OpenSearch Dashboards:
- To open OpenSearch Dashboards:
- If you’re not running the security plugin, go to http://localhost:5601.
- If you’re running the security plugin, go to https://localhost:5601 and log in with your username and password (default is admin/admin).
-
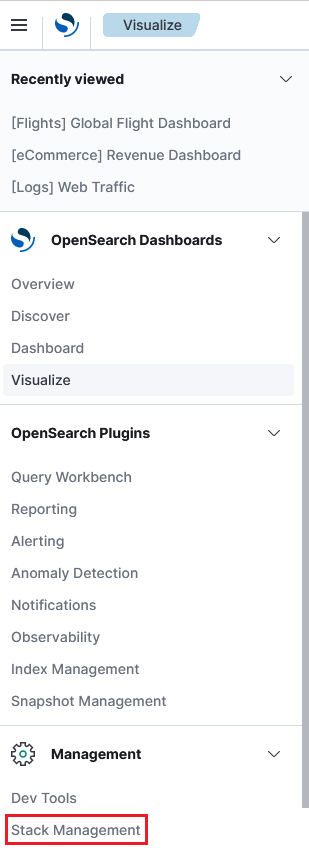
From the top menu, select Management > Stack Management > Advanced Settings.
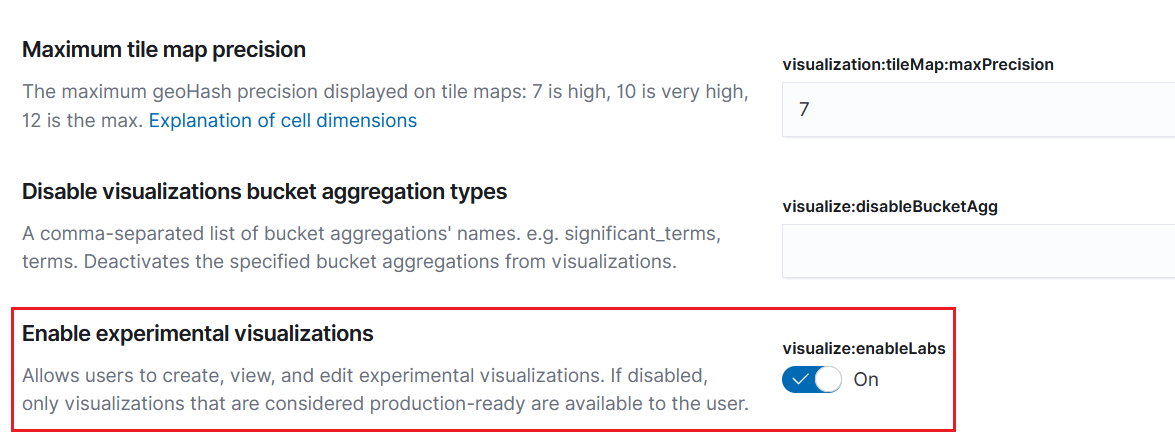
- Select Visualization. The Enable experimental visualizations option should be turned on.
To get started, follow the steps below to create a new visualization using the wizard:
-
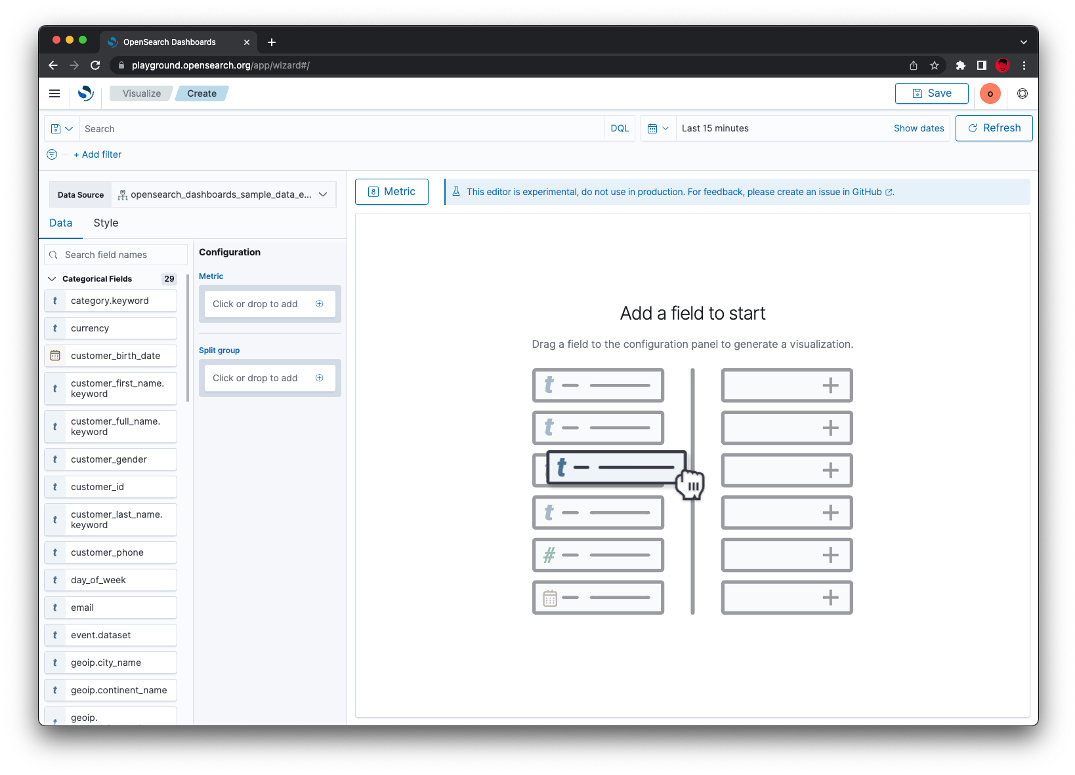
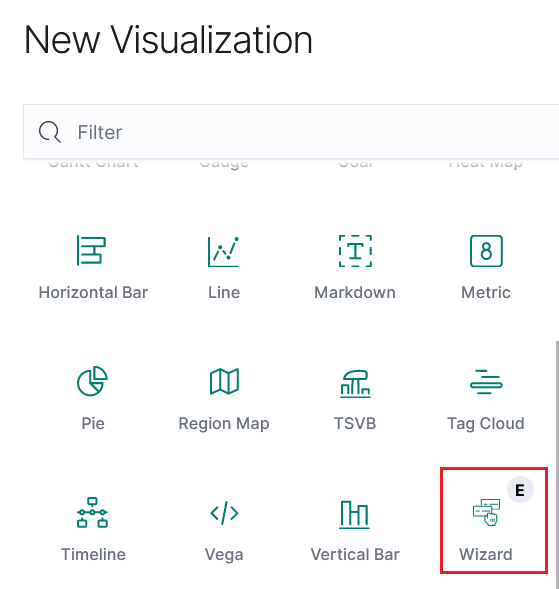
From the top menu, select Visualize > Create visualization > Wizard.
-
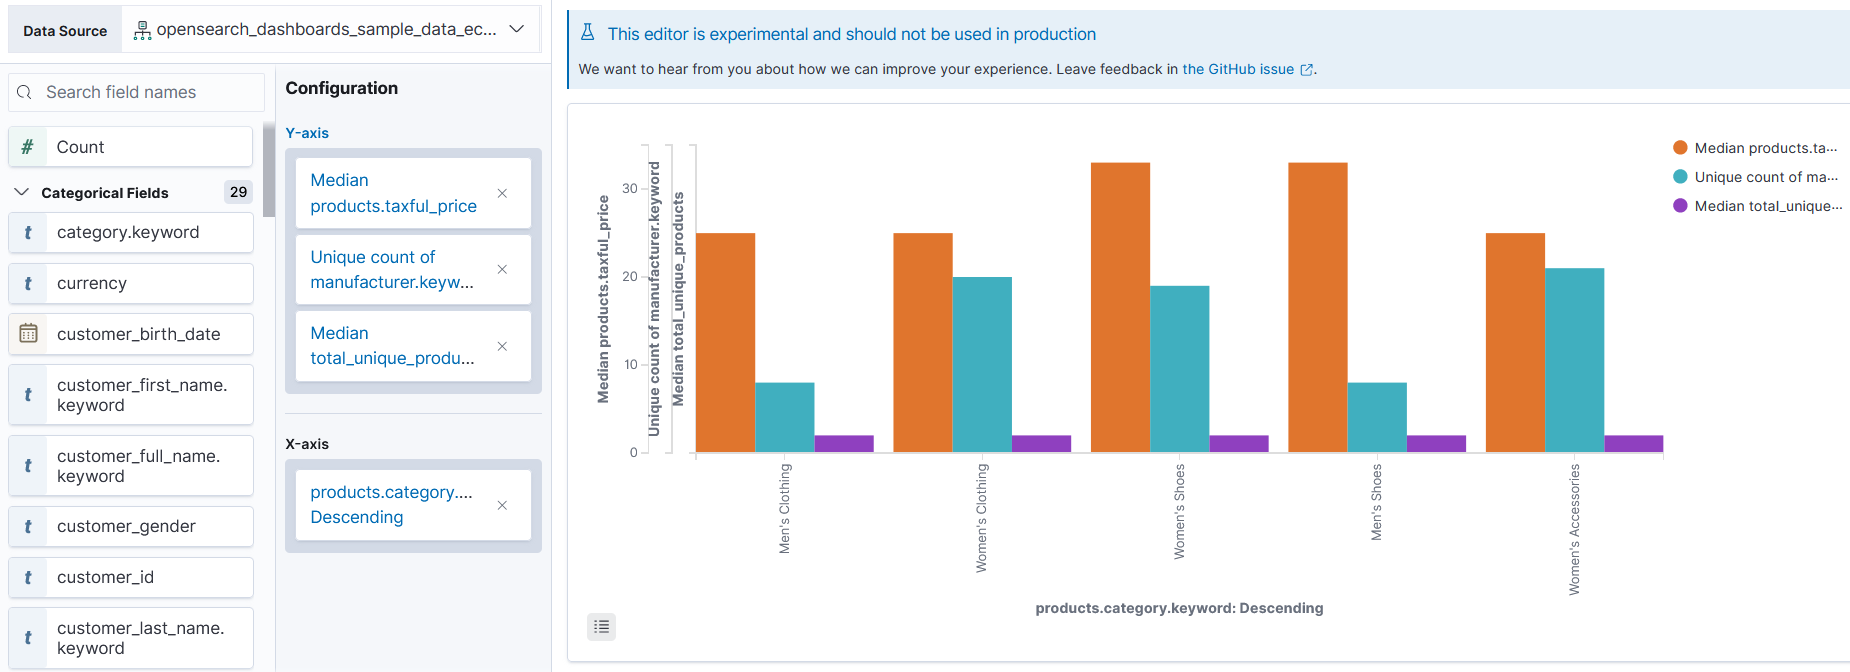
Drag and drop field names from the left column into the Configuration panel to generate a visualization.
Here’s an example visualization. Your visualization will look different depending on your data and the fields you select.
Related topics
- OpenSearch News, September 14, 2022
- Drag-and-drop visualizations demo at OpenSearch Community Meeting, August 16, 2022
- OpenSearch News, March 17, 2022