You're viewing version 2.6 of the OpenSearch documentation. This version is no longer maintained. For the latest version, see the current documentation. For information about OpenSearch version maintenance, see Release Schedule and Maintenance Policy.
Managing ML models in OpenSearch Dashboards
Released in OpenSearch 2.6, the machine learning (ML) functionality in OpenSearch Dashboards is experimental and can’t be used in a production environment. For updates or to leave feedback, see the OpenSearch Forum discussion.
Administrators of machine learning (ML) clusters can use OpenSearch Dashboards to manage and check the status of ML models running inside a cluster. This can help ML developers provision nodes to ensure their models run efficiently.
As of OpenSearch 2.6, you can only upload models using the API. For more information about how to upload a model to your cluster, see Upload model to OpenSearch.
Enabling ML in Dashboards
In OpenSearch 2.6, ML functionality is disabled by default. To enable it, you need to edit the configuration in opensearch_dashboards.yml and then restart your cluster.
To enable the feature:
- In your OpenSearch cluster, navigate to your Dashboards home directory; for example, in Docker,
/usr/share/opensearch-dashboards. - Open your local copy of the Dashboards configuration file
opensearch_dashboards.yml. If you don’t have a copy, get one from GitHub:opensearch_dashboards.yml. - Add the setting
ml_commons_dashboards.enabled:toopensearch_dashboards.yml. Then, set it toml_commons_dashboards.enabled: trueand save the configuration file. - Restart the Dashboards container.
- Verify that the feature configuration settings were created and configured properly by launching OpenSearch Dashboards. The Machine Learning section should appear under OpenSearch plugins.
Accessing ML functionality in Dashboards
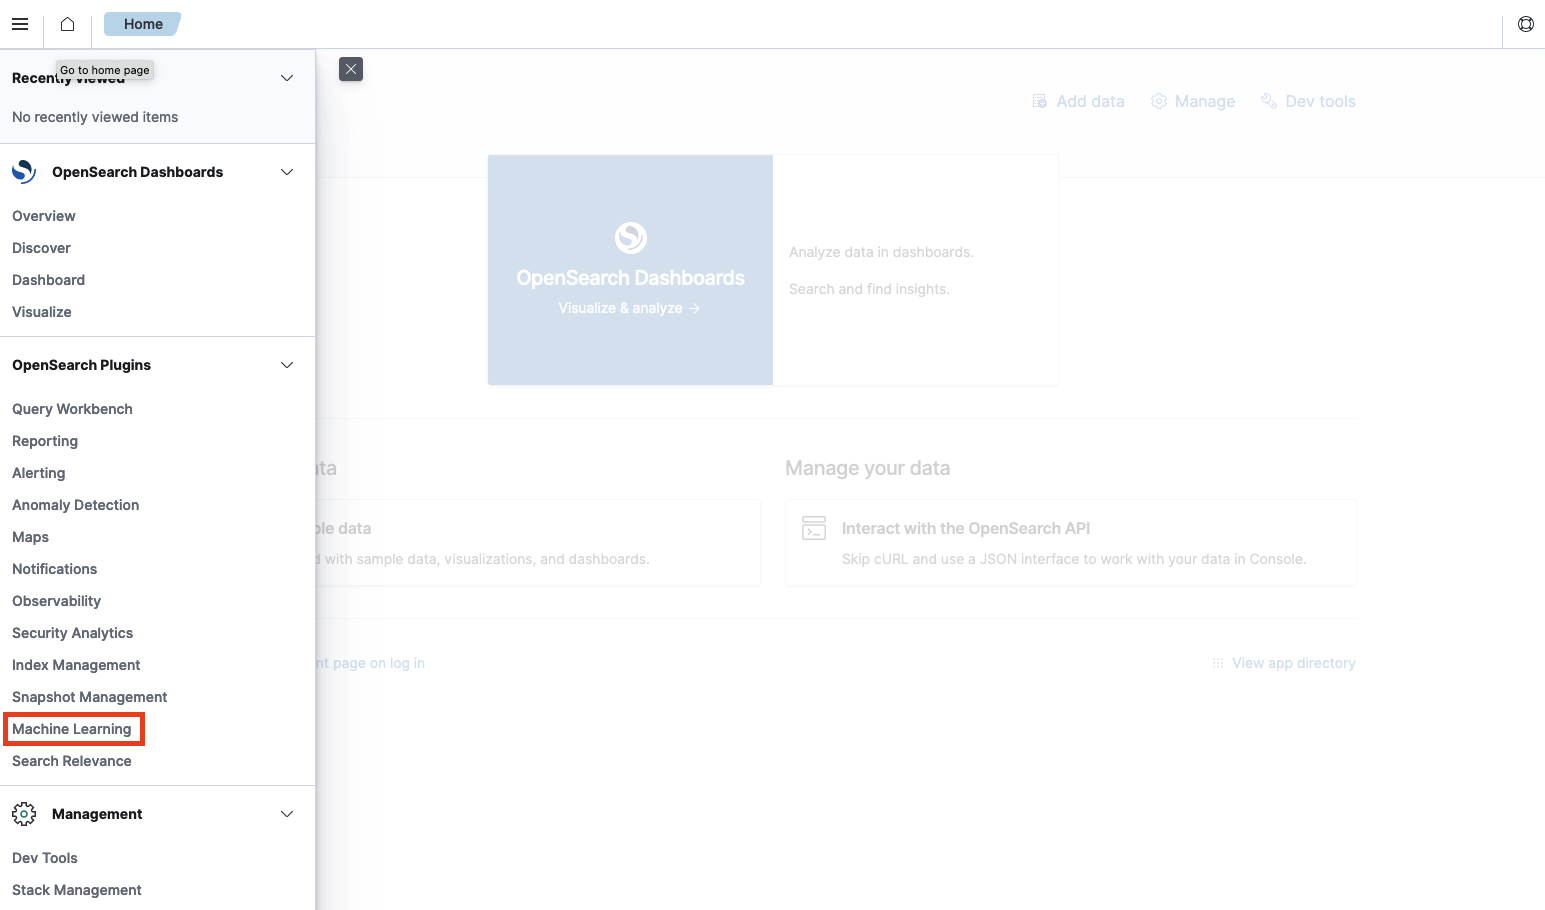
To access ML functionality in OpenSearch Dashboards,select OpenSearch plugins > Machine Learning.

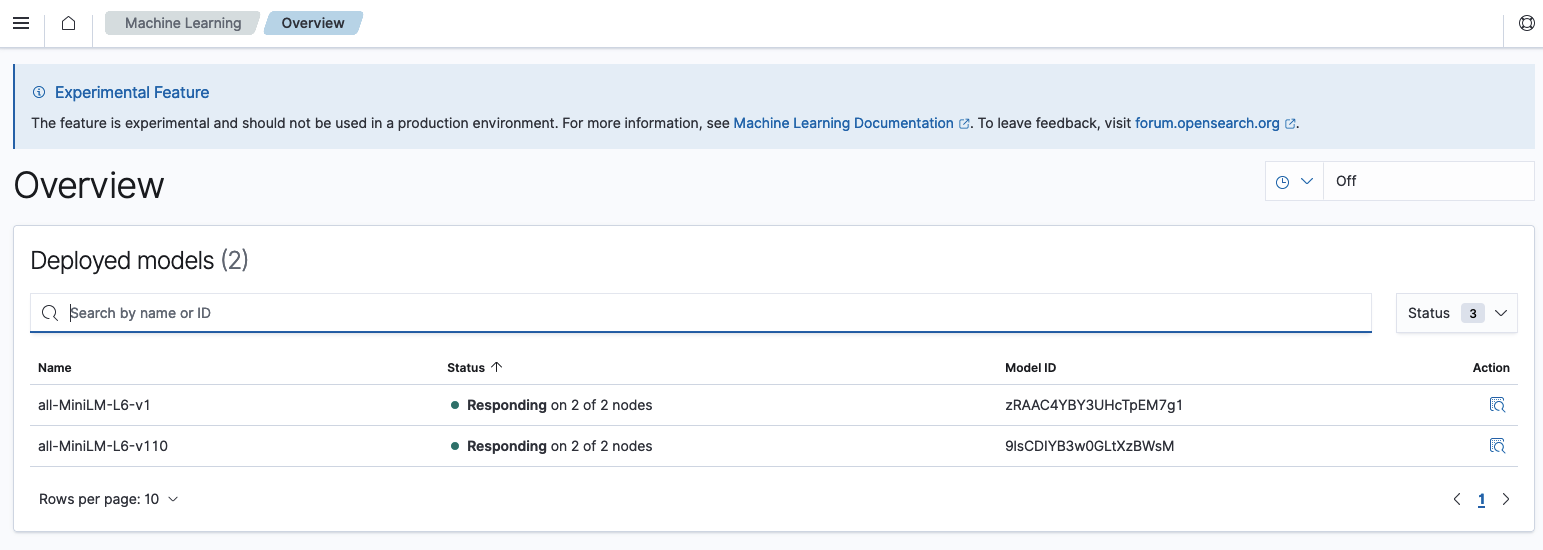
In the Machine Learning section, you now have access to the Deployed models dashboard.
Deployed models dashboard
The deployed models dashboard gives admins the ability to check the status of any models stored inside your OpenSearch cluster.

The dashboard includes the following information about the model:
- Name: The name of the model given upon upload.
- Status: The number of nodes for which the model responds.
- When all nodes are responsive, the status is Green.
- When some nodes are responsive,the status is Yellow.
- When all nodes are unresponsive,the status is Red.
- Model ID: The model ID.
- Action: What actions you can take with the model.
As of OpenSearch 2.6, the only action available is View Status Details, shown in the following image.

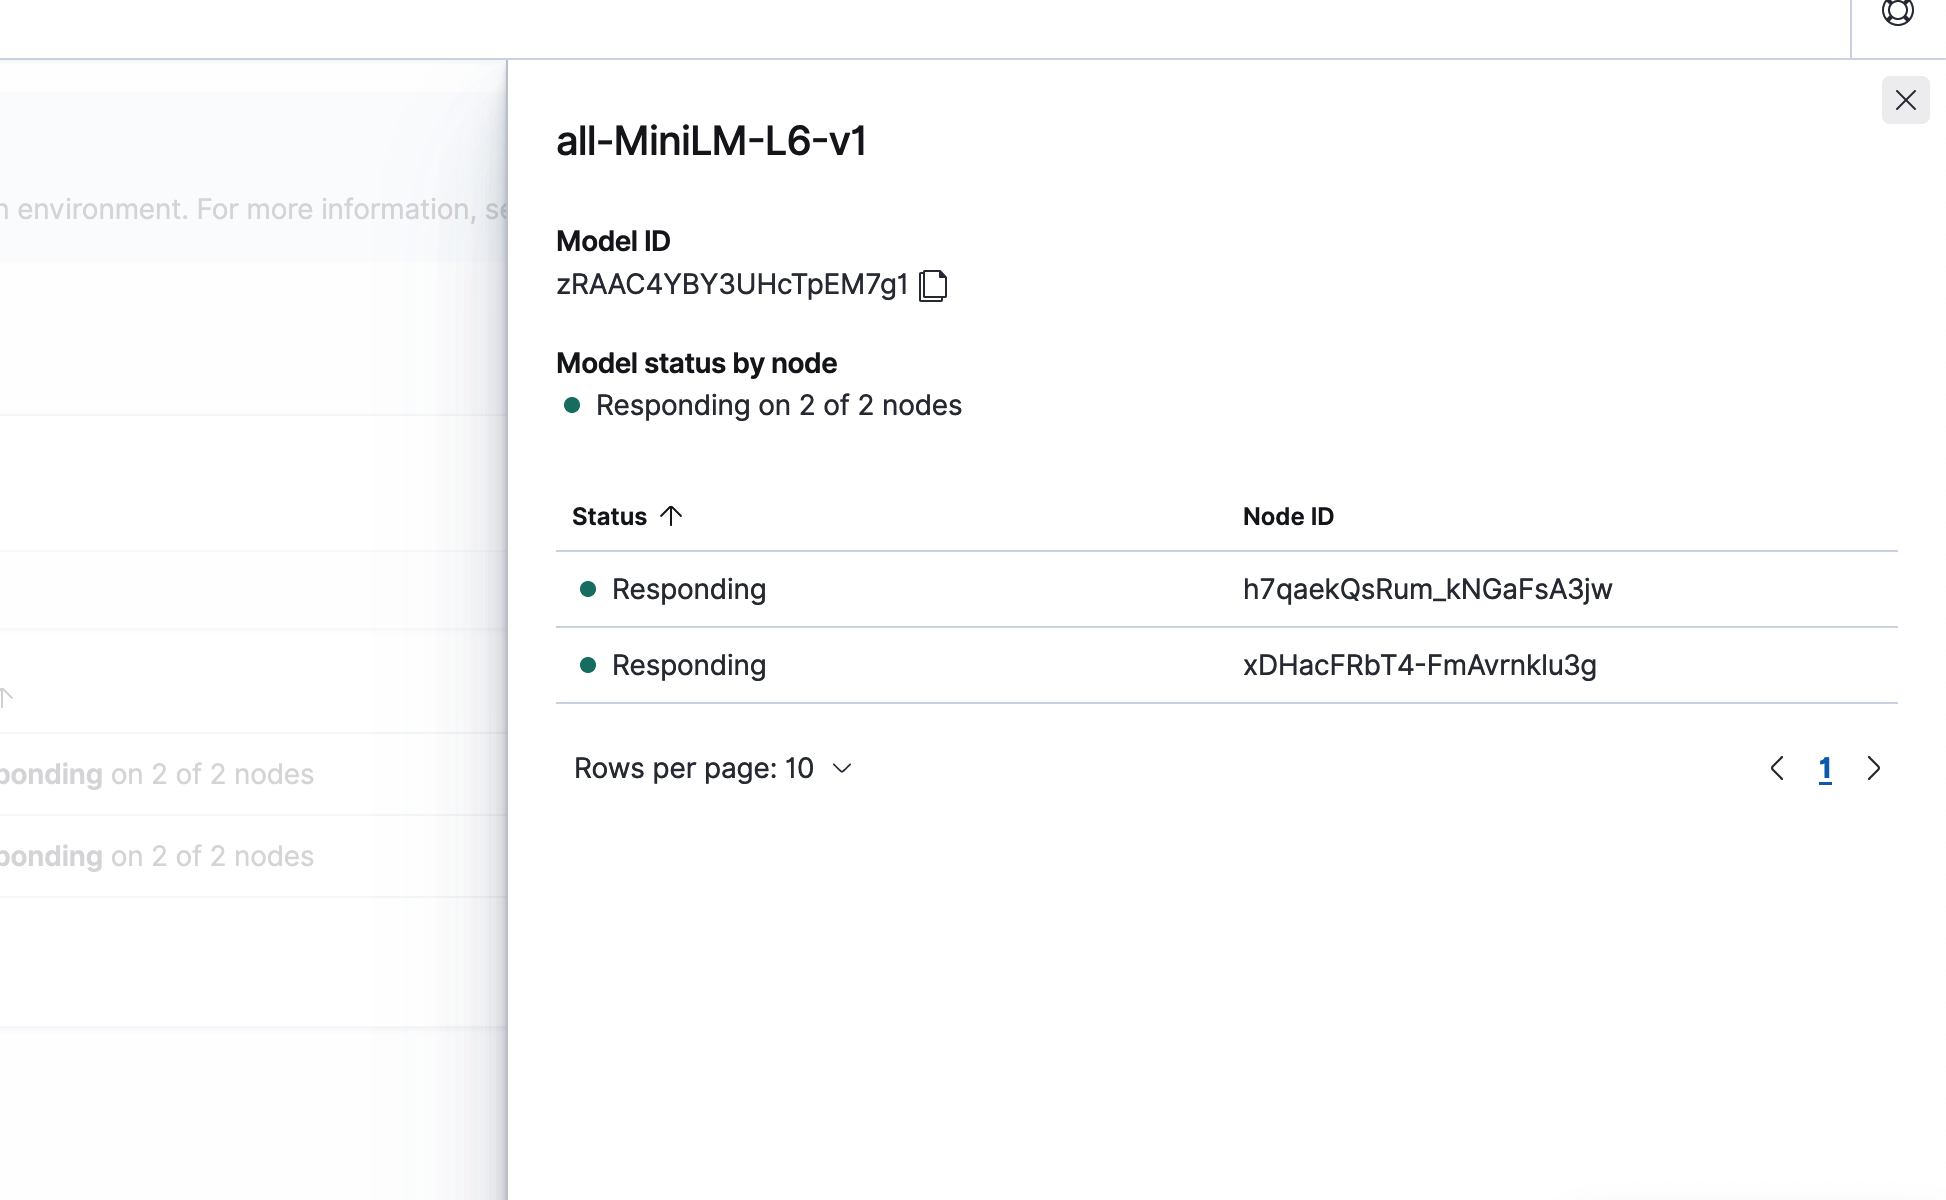
When selected, the Status Details panel appears.
The panel provides the following details inside the panel:
- Model ID
- Model status by node: The number of nodes for which the model is responsive.
A list of nodes gives you a view of each node the model is running on, including each node’s Node ID and status, as shown in the following image. This is useful if you want to use the node’s Node ID to determine why a node is unresponsive.

Next steps
For more information about how to manage ML models in OpenSearch, see Model-serving framework.