You're viewing version 2.8 of the OpenSearch documentation. This version is no longer maintained. For the latest version, see the current documentation. For information about OpenSearch version maintenance, see Release Schedule and Maintenance Policy.
Trace Analytics
Trace Analytics provides a way to ingest and visualize OpenTelemetry data in OpenSearch. This data can help you find and fix performance problems in distributed applications.
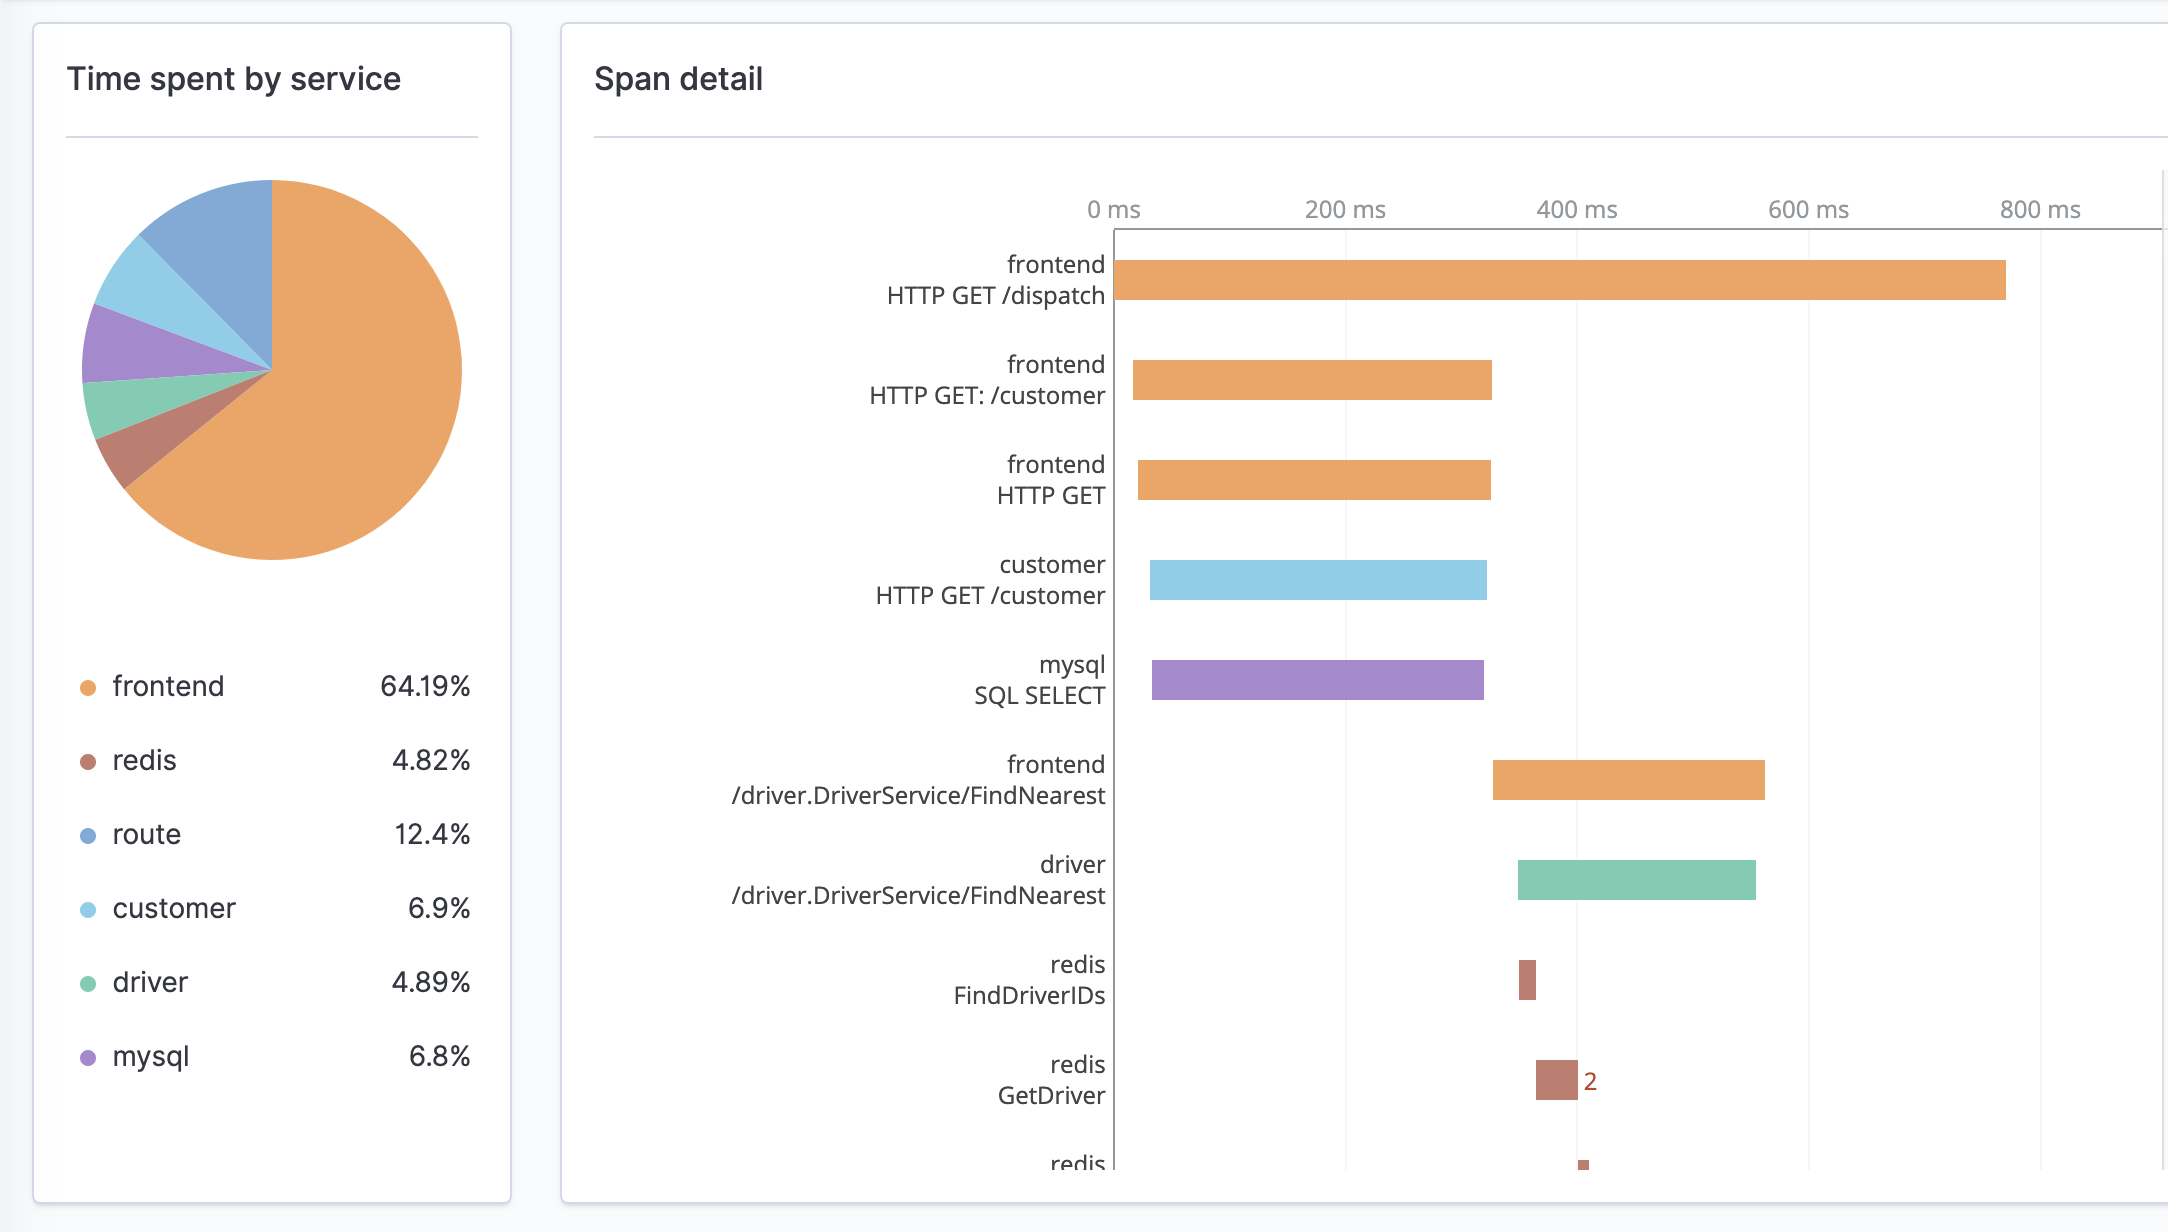
A single operation, such as a user choosing a button, can trigger an extended series of events. The frontend might call a backend service, which calls another service, which queries a database, processes the data, and sends it to the original service, which sends a confirmation to the frontend.
Trace Analytics can help you visualize this flow of events and identify performance problems, as shown in the following image.

Trace Analytics with Jaeger data
Trace Analytics supports Jaeger trace data in the OpenSearch Observability plugin. If you use OpenSearch as the backend for Jaeger trace data, you can use the built-in Trace Analytics capabilities.
To set up your environment to use Trace Analytics, see Analyze Jaeger trace data.