User experience challenges
Software improvements often prioritize adding new features and functionality. Product managers and developers often adopt an agile approach, adding engineering capabilities in iterative steps. Neglecting seamless user experience can lead to a fragmented journey, especially for low-code users. While high-code users might adapt, low-code users often report frustration and dissatisfaction when software updates don’t actually help them achieve their goals.
When navigating software, users utilize two types of memory: episodic and semantic. Episodic memory is grounded in the sequence of time, while semantic memory is conceptual. We are capable of experiencing our online environment in both ways, and switch between the two as we navigate software. When functionality is enhanced incrementally, navigation that fails to consider the logical buildup of user tasks in a software workflow can degrade the experience. Such product experiences end up ill designed and requiring ongoing customer support to help coach, train, and assist the user.
How to measure user experience?
The Customer Outcome Framework employs a top-down view of the customer experience. Customer Experience Outcomes (CXOs) define critical tasks that a product must perform and how well those tasks must be performed. A comprehensive set of CXO measures may include quality and loyalty measures. Additional outcome measures may include satisfaction and frustration scores, UMUXmeasures, UMUX-lite measures, or SUS scores.
OpenSearch experience outcomes
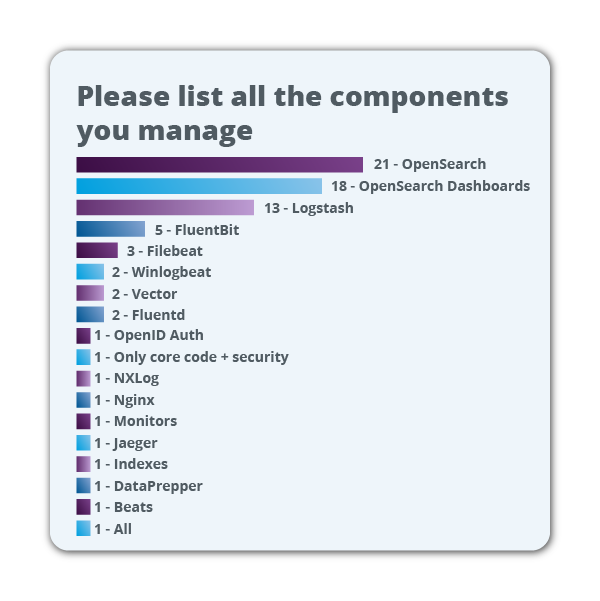
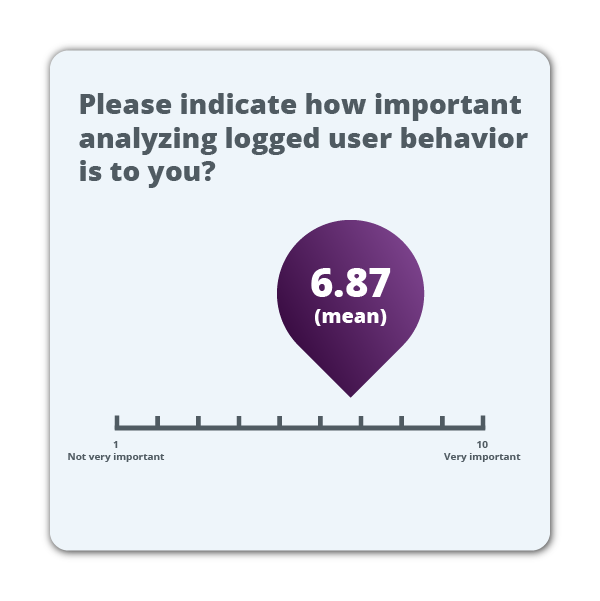
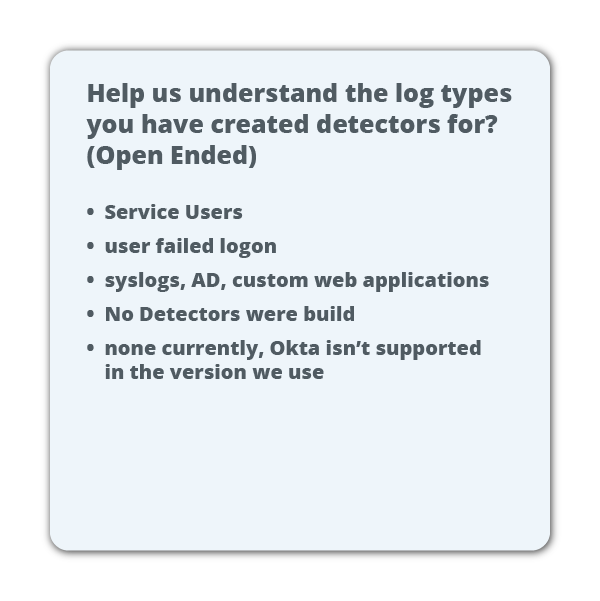
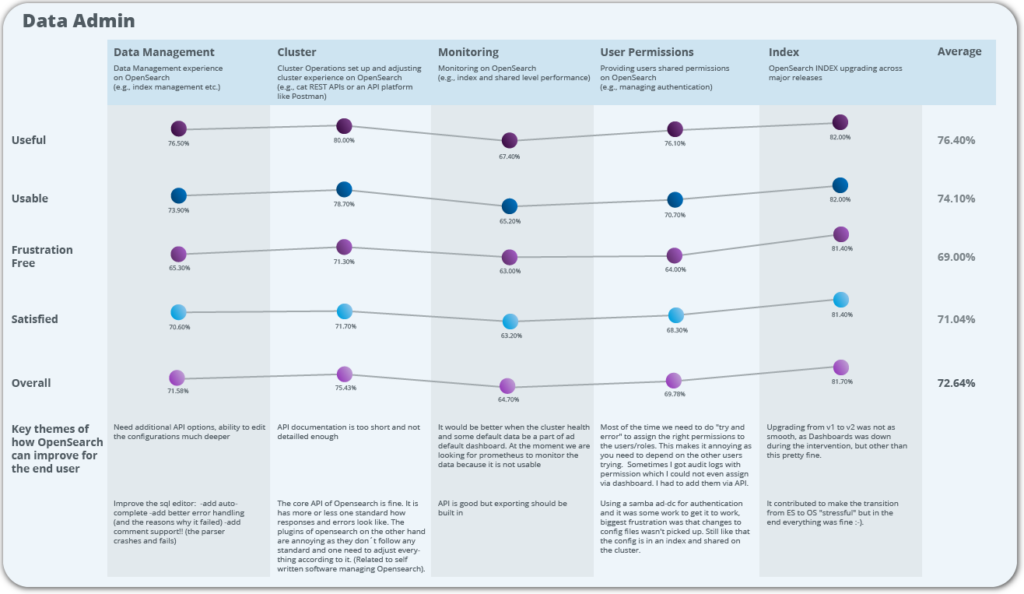
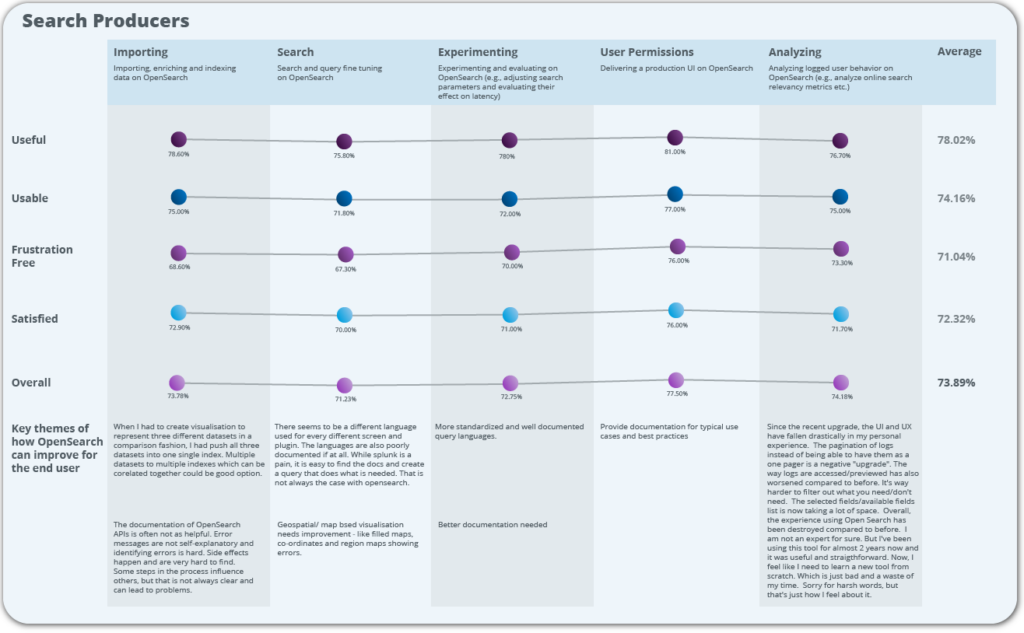
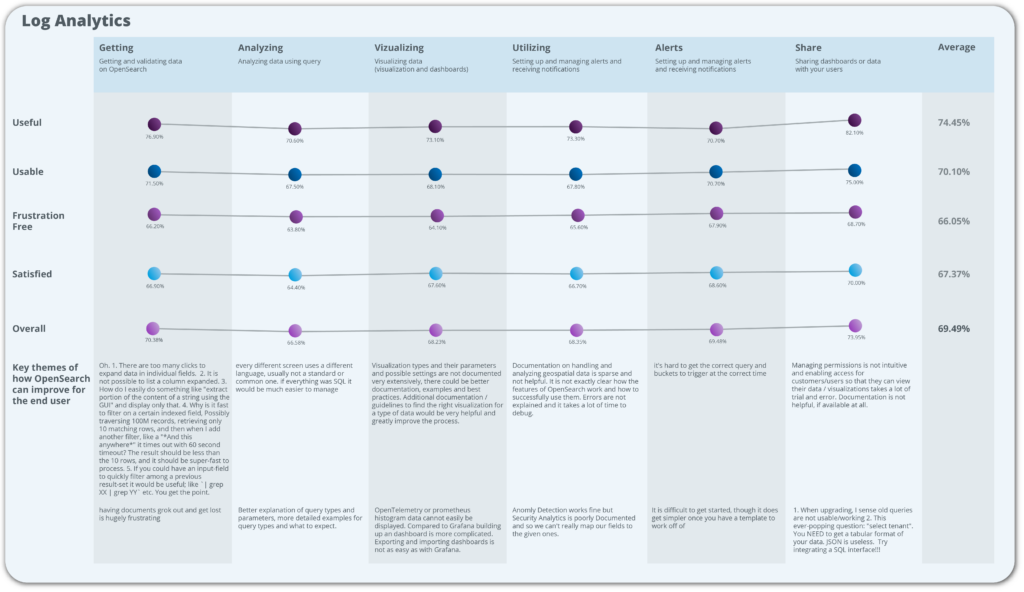
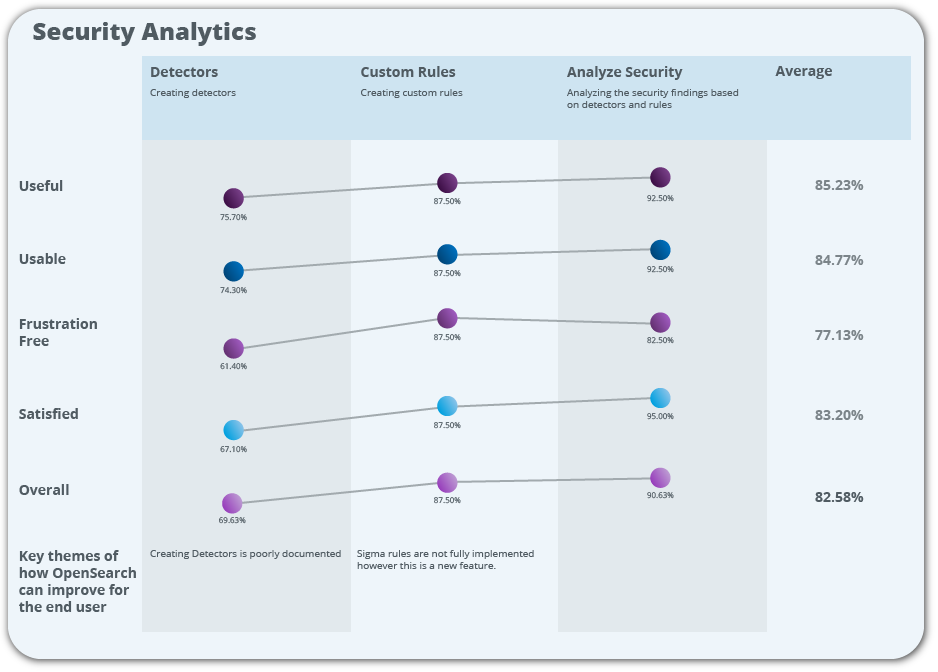
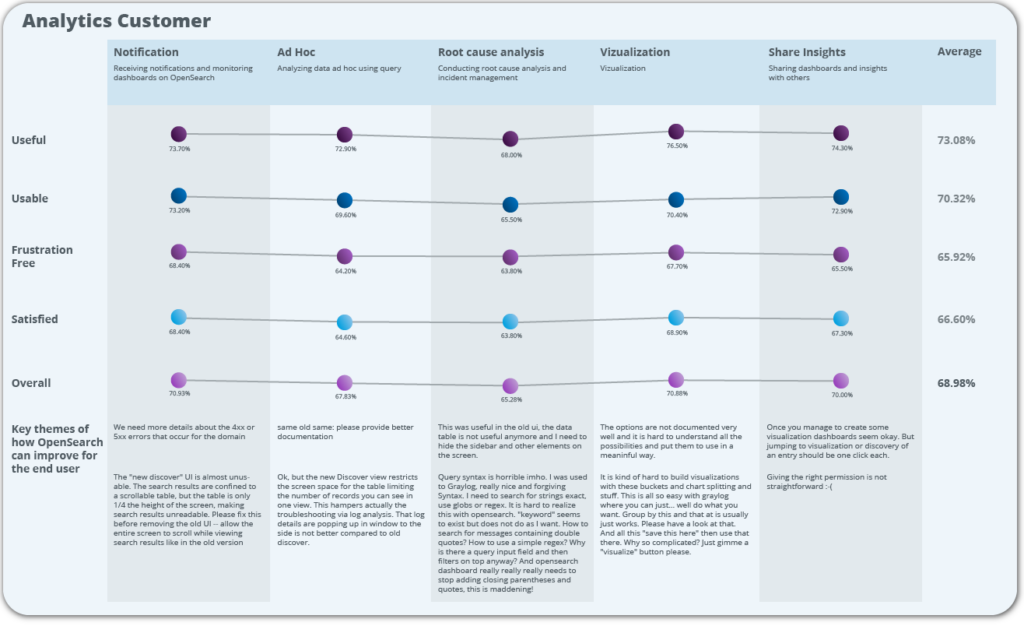
To measure OpenSearch CXOs, we first defined distinct users based on roles and domain expertise. Once we validated these, we then parsed out pivotal nodes of each user’s experience as user flows. We intentionally limited the pivotal experience nodes to 3–6 in number so that we could manage the length of the survey. For each node, we asked users to provide ratings for four measures representing their perception of the experience. We adopted UMUX scale measures to quantify satisfaction, frustration, usefulness, and usability. After each set of ratings, we invited our users to tell us how we might improve. The survey was hosted for two quarters (Q3–Q4 2023), and we obtained 130 responses in total from OpenSearch Dashboards users.
Findings and areas of improvement
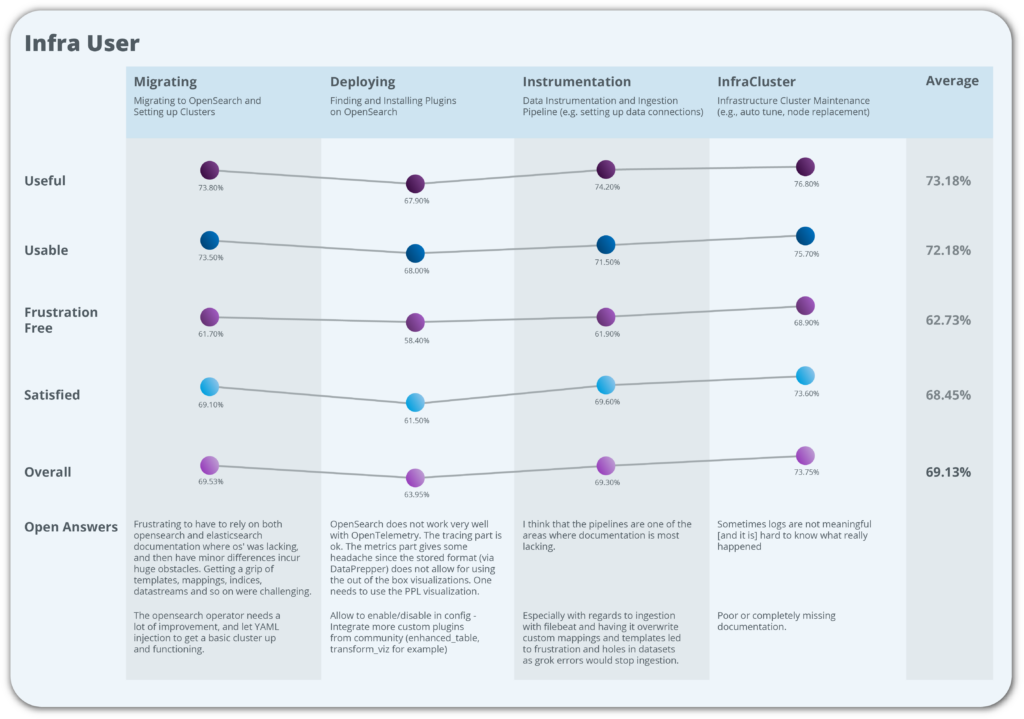
Of the rated experiences, the Security Analytics Producer experience was best rated overall (82.58%). The Dashboards Consumer (68.98%) and Infra Admin experiences (69.13%) indicated opportunities for improvement. The survey results indicated that Infra User experiences, such as Deployment (63.95%) and Migration (69.53%), and Dashboards Consumer experiences, such as Root Cause Analysis (65.28%) and Ad Hoc Analysis (67.83%), could be improved.
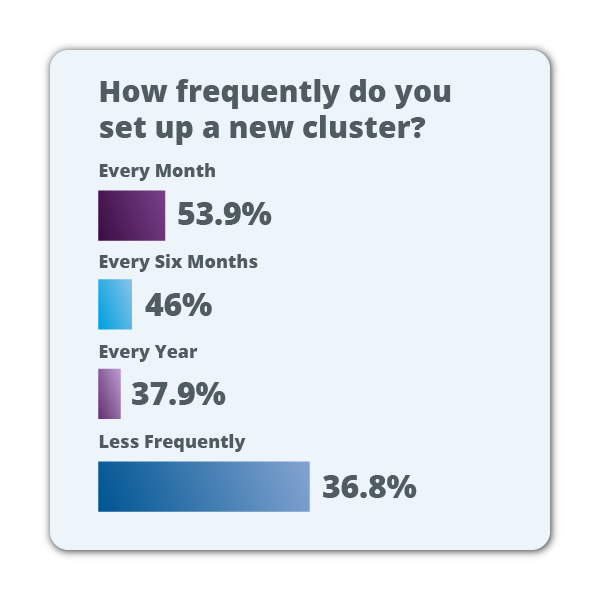
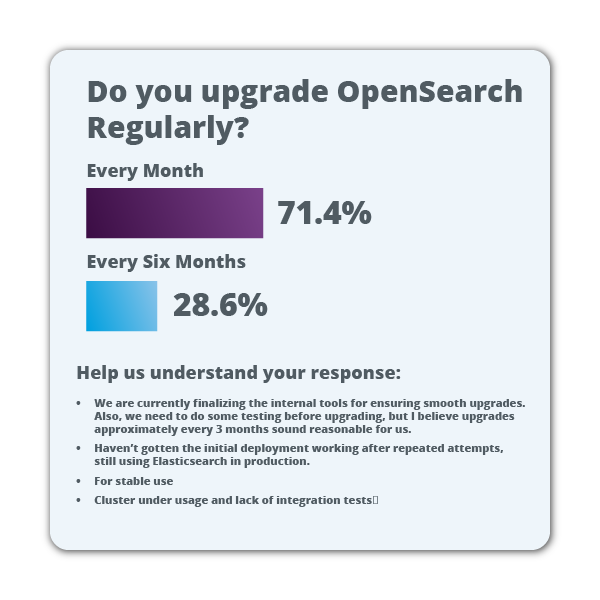
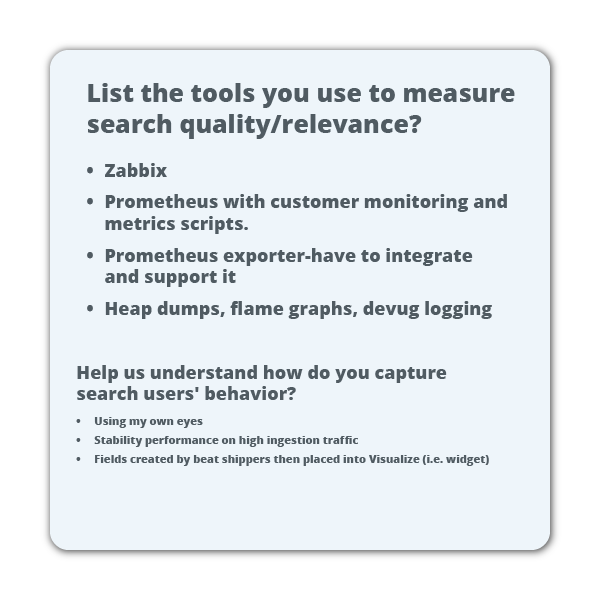
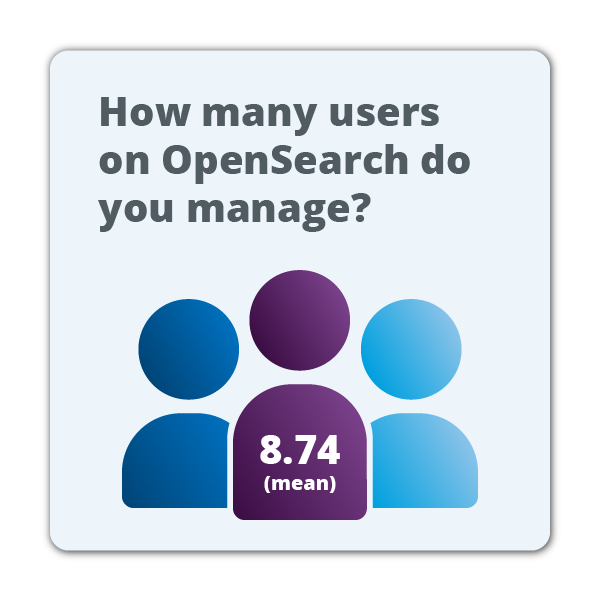
These findings are helping us improve known experiences; however, we are seeking feedback on fragmented user experiences, particularly from the search and analytics user segments. We invite you to provide your feedback through the 2024 Search and Analytics Survey. This survey is hosted by Linux Foundation Research. Feedback data is shown in the following images.
References
- https://lithespeed.com/drive-input-customer-experience-outcomes/
- https://productmanagementuniversity.com/launches-customer-outcome-framework/
- https://www.forrester.com/research/cx-index/
- https://testscience.org/measuring-usability/#UMUX
- https://testscience.org/measuring-usability/#UMUX-LITE
- https://testscience.org/measuring-usability/#SUS