You're viewing version 2.1 of the OpenSearch documentation. This version is no longer maintained. For the latest version, see the current documentation. For information about OpenSearch version maintenance, see Release Schedule and Maintenance Policy.
Performance Analyzer
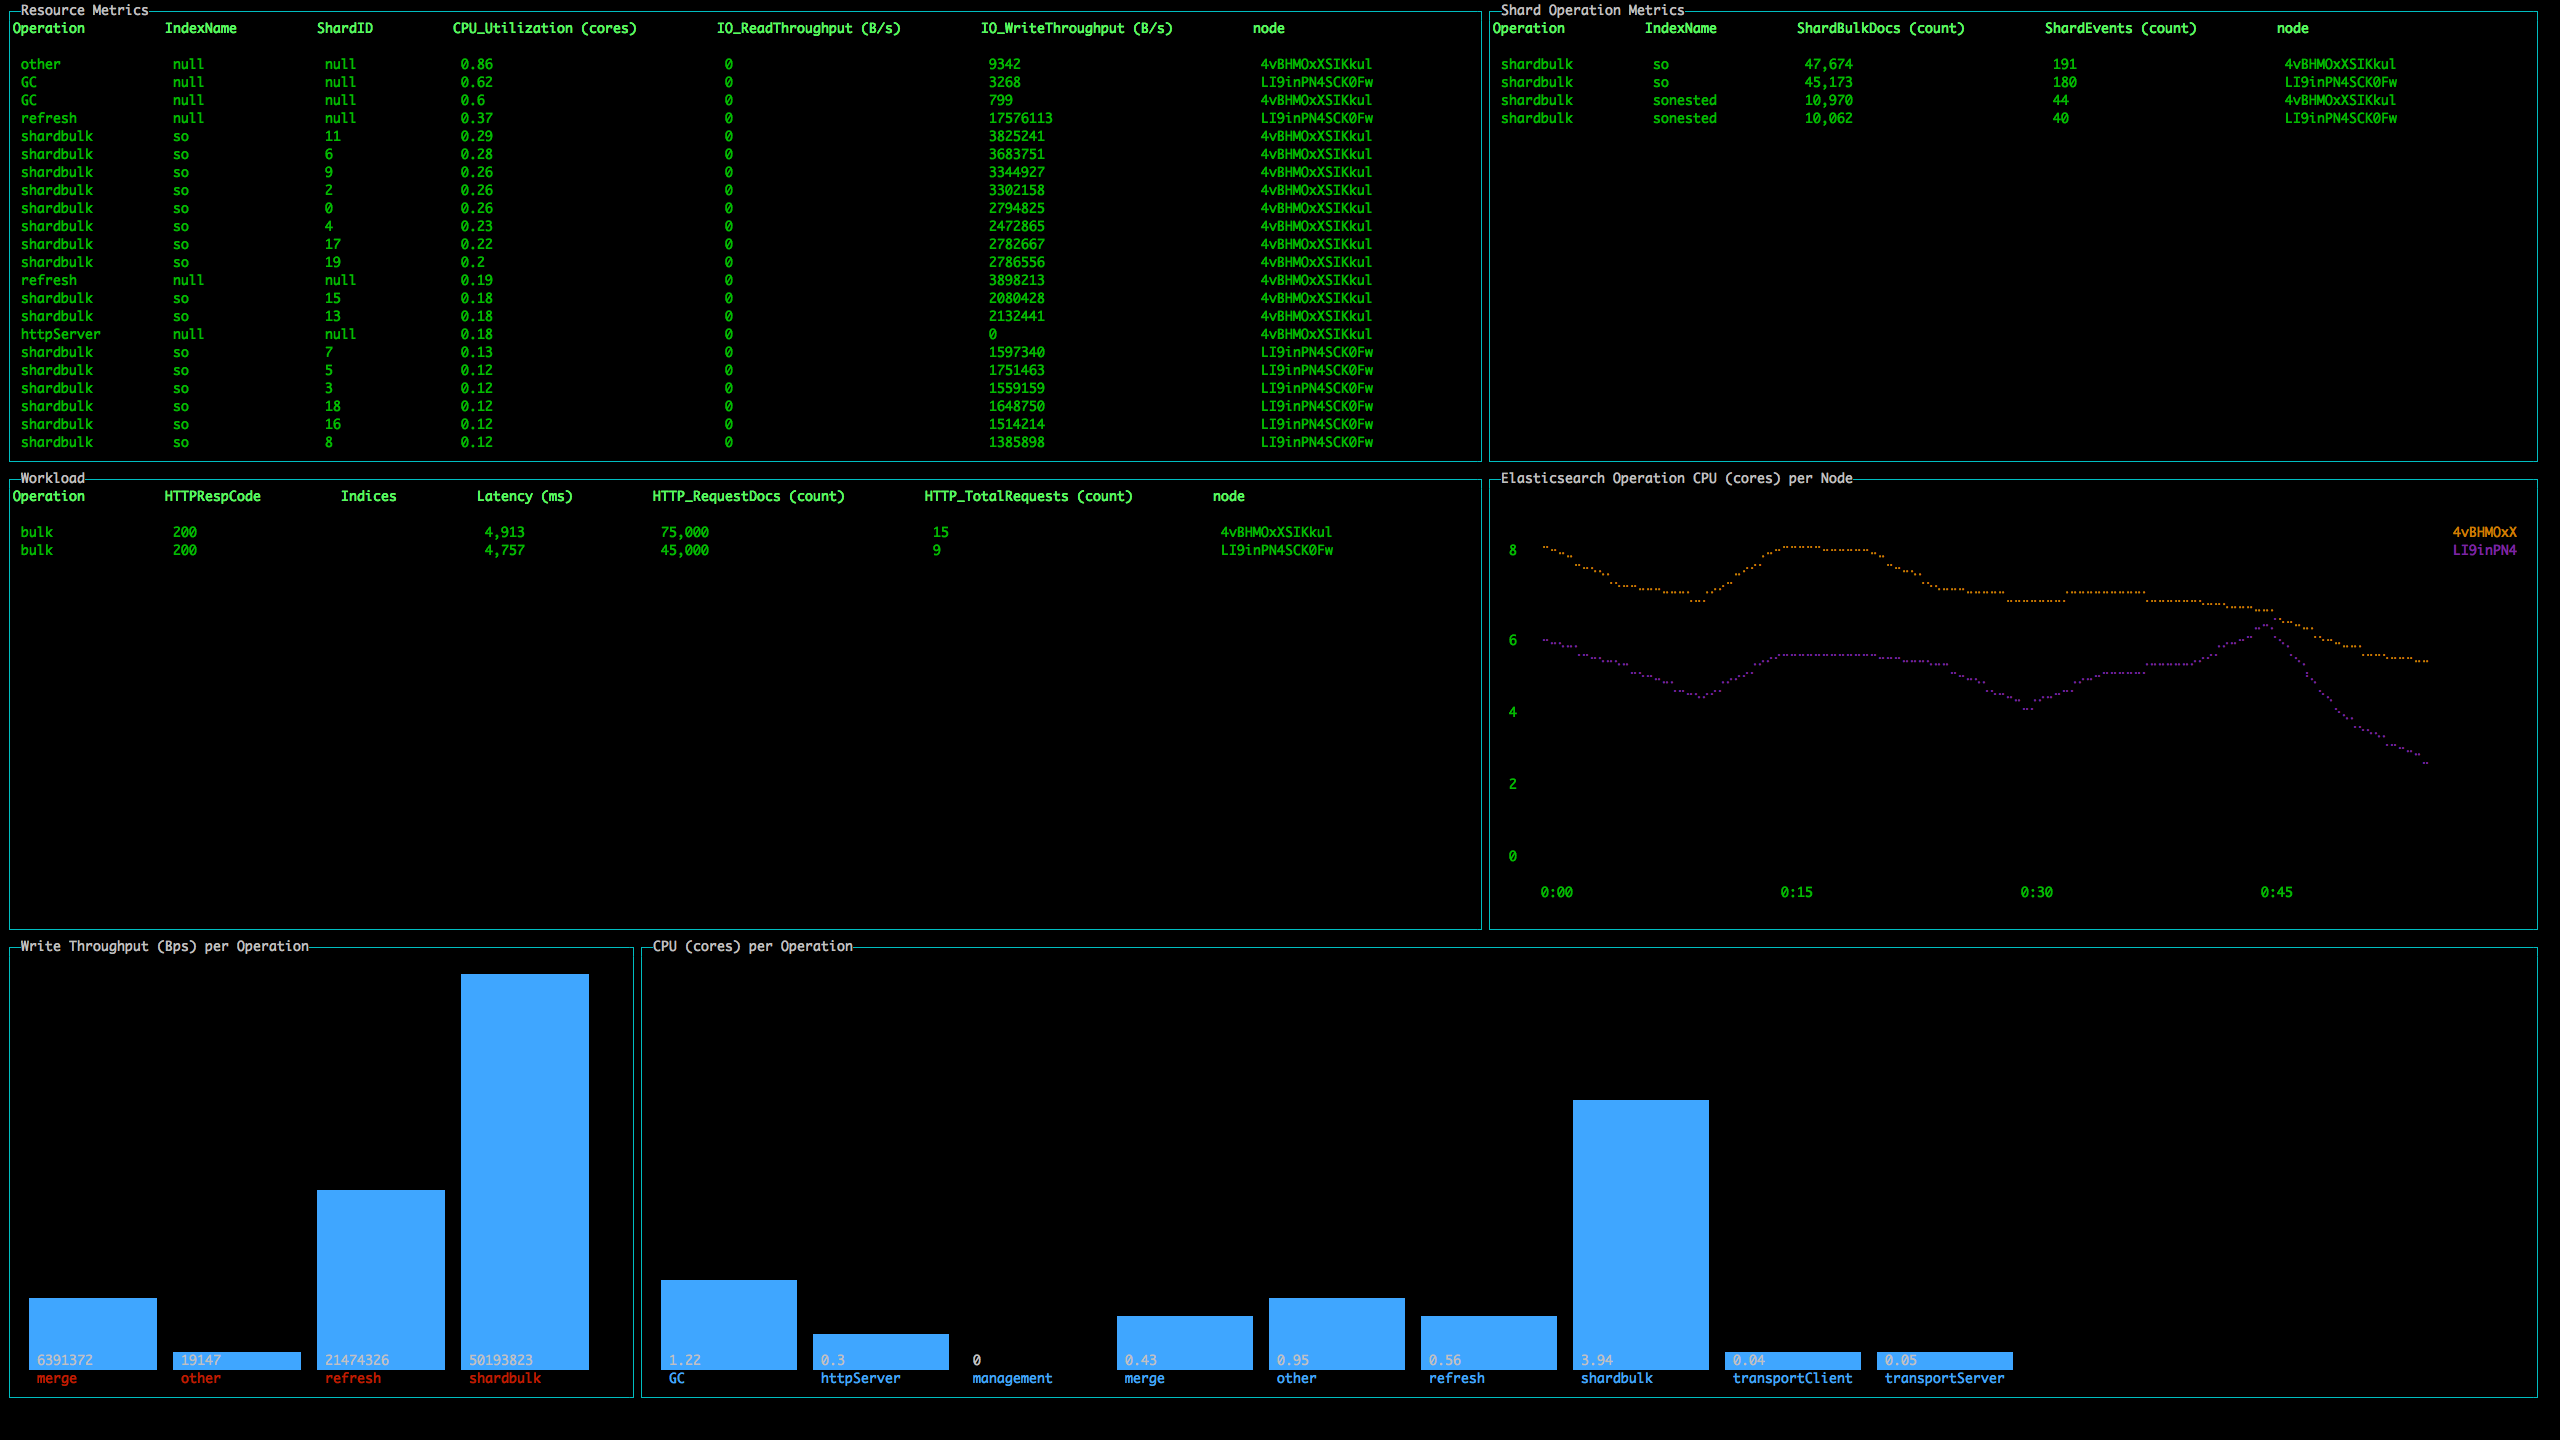
Performance Analyzer is an agent and REST API that allows you to query numerous performance metrics for your cluster, including aggregations of those metrics, independent of the Java Virtual Machine (JVM). PerfTop is the default command line interface (CLI) for displaying those metrics.
To download PerfTop, see Download on the PerfTop release page.
You can also install it using npm:
npm install -g @aws/opensearch-perftop
For enabling Performance Analyzer with tarball installations of OpenSearch, see Configure Performance Analyzer for Tarball Installation.
Get started with PerfTop
The basic syntax is:
./opensearch-perf-top-<operating_system> --dashboard <dashboard>.json --endpoint <endpoint>
If you’re using npm, the syntax is similar:
opensearch-perf-top --dashboard <dashboard> --endpoint <endpoint>
If you’re running PerfTop from a node (i.e. locally), specify port 9600:
./opensearch-perf-top-linux --dashboard dashboards/<dashboard>.json --endpoint localhost:9600
Otherwise, just specify the OpenSearch endpoint:
./opensearch-perf-top-macos --dashboard dashboards/<dashboard>.json --endpoint my-cluster.my-domain.com
PerfTop has four pre-built dashboards in the dashboards directory, but you can also create your own.
You can also load the pre-built dashboards (ClusterOverview, ClusterNetworkMemoryAnalysis, ClusterThreadAnalysis, or NodeAnalysis) without the JSON files, such as --dashboard ClusterThreadAnalysis.
PerfTop has no interactivity. Start the application, monitor the dashboard, and press Esc, Q, or Ctrl + C to quit.
Other options
- For NodeAnalysis and similar custom dashboards, you can add the
--nodename <node_name>argument if you want your dashboard to display metrics for only a single node. - For troubleshooting, add the
--logfile <log-file>.txtargument.
Performance Analyzer configuration
Storage
Performance Analyzer uses /dev/shm for temporary storage. During heavy workloads on a cluster, Performance Analyzer can use up to 1 GB of space.
Docker, however, has a default /dev/shm size of 64 MB. To change this value, you can use the docker run --shm-size 1gb flag or a similar setting in Docker Compose.
If you’re not using Docker, check the size of /dev/shm using df -h. The default value is probably plenty, but if you need to change its size, add the following line to /etc/fstab:
tmpfs /dev/shm tmpfs defaults,noexec,nosuid,size=1G 0 0
Then remount the file system:
mount -o remount /dev/shm
Security
Performance Analyzer supports encryption in transit for requests. It currently does not support client or server authentication for requests. To enable encryption in transit, edit performance-analyzer.properties in your $OPENSEARCH_HOME directory:
vi $OPENSEARCH_HOME/config/opensearch-performance-analyzer/performance-analyzer.properties
Change the following lines to configure encryption in transit. Note that certificate-file-path must be a certificate for the server, not a root CA:
https-enabled = true

#Setup the correct path for certificates
certificate-file-path = specify_path

private-key-file-path = specify_path
Enable Performance Analyzer for RPM/YUM installations
If you installed OpenSearch from an RPM distribution, you can start and stop Performance Analyzer with systemctl:
# Start OpenSearch Performance Analyzer
sudo systemctl start opensearch-performance-analyzer.service
# Stop OpenSearch Performance Analyzer
sudo systemctl stop opensearch-performance-analyzer.service
Configure Performance Analyzer for tarball installations
In a tarball installation, Performance Analyzer collects data when it is enabled. But in order to read that data using the REST API on port 9600, you must first manually launch the associated reader agent process:
-
Make Performance Analyzer accessible outside of the host machine
cd /usr/share/opensearch # navigate to the OpenSearch home directory
cd config/opensearch-performance-analyzer/
vi performance-analyzer.properties
Uncomment the line
#webservice-bind-hostand set it to0.0.0.0:# ======================== OpenSearch performance analyzer plugin config ========================= # NOTE: this is an example for Linux. Please modify the config accordingly if you are using it under other OS. # WebService bind host; default to all interfaces webservice-bind-host = 0.0.0.0 # Metrics data location metrics-location = /dev/shm/performanceanalyzer/ # Metrics deletion interval (minutes) for metrics data. # Interval should be between 1 to 60. metrics-deletion-interval = 1 # If set to true, the system cleans up the files behind it. So at any point, we should expect only 2 # metrics-db-file-prefix-path files. If set to false, no files are cleaned up. This can be useful, if you are archiving # the files and wouldn't like for them to be cleaned up. cleanup-metrics-db-files = true # WebService exposed by App's port webservice-listener-port = 9600 # Metric DB File Prefix Path location metrics-db-file-prefix-path = /tmp/metricsdb_ https-enabled = false #Setup the correct path for certificates certificate-file-path = specify_path private-key-file-path = specify_path # Plugin Stats Metadata file name, expected to be in the same location plugin-stats-metadata = plugin-stats-metadata # Agent Stats Metadata file name, expected to be in the same location agent-stats-metadata = agent-stats-metadata -
Make the CLI executable:
sudo chmod +x ./bin/performance-analyzer-agent-cli -
Launch the agent CLI:
«««< HEAD
OPENSEARCH_HOME="$PWD" OPENSEARCH_PATH_CONF="$PWD/config" ./bin/performance-analyzer-agent-cli
-
In a separate window, enable the Performance Analyzer plugin:
curl -XPOST localhost:9200/_plugins/_performanceanalyzer/cluster/config -H 'Content-Type: application/json' -d '{"enabled": true}'If you receive the
curl: (52) Empty reply from servererror, you are likely protecting your cluster with the security plugin and you need to provide credentials. Modify the following command to use your username and password:curl -XPOST https://localhost:9200/_plugins/_performanceanalyzer/cluster/config -H 'Content-Type: application/json' -d '{"enabled": true}' -u 'admin:admin' -k -
Finally, enable the Root Cause Analyzer (RCA) framework
curl -XPOST localhost:9200/_plugins/_performanceanalyzer/rca/cluster/config -H 'Content-Type: application/json' -d '{"enabled": true}'Similar to step 4, if you run into
curl: (52) Empty reply from server, run the command below to enable RCAcurl -XPOST https://localhost:9200/_plugins/_performanceanalyzer/rca/cluster/config -H 'Content-Type: application/json' -d '{"enabled": true}' -u 'admin:admin' -k======= - Performance analyzer API guide. - RCA. - RCA API guide. - RFC: Root cause analysis.
7bb41fe4 (Make API reference top level (#1637))