You're viewing version 2.1 of the OpenSearch documentation. This version is no longer maintained. For the latest version, see the current documentation. For information about OpenSearch version maintenance, see Release Schedule and Maintenance Policy.
Observability
OpenSearch Dashboards
Observability is collection of plugins and applications that let you visualize data-driven events by using Piped Processing Language to explore, discover, and query data stored in OpenSearch.
Your experience of exploring data might differ, but if you’re new to exploring data to create visualizations, we recommend trying a workflow like the following:
- Explore data within a certain timeframe using Piped Processing Language.
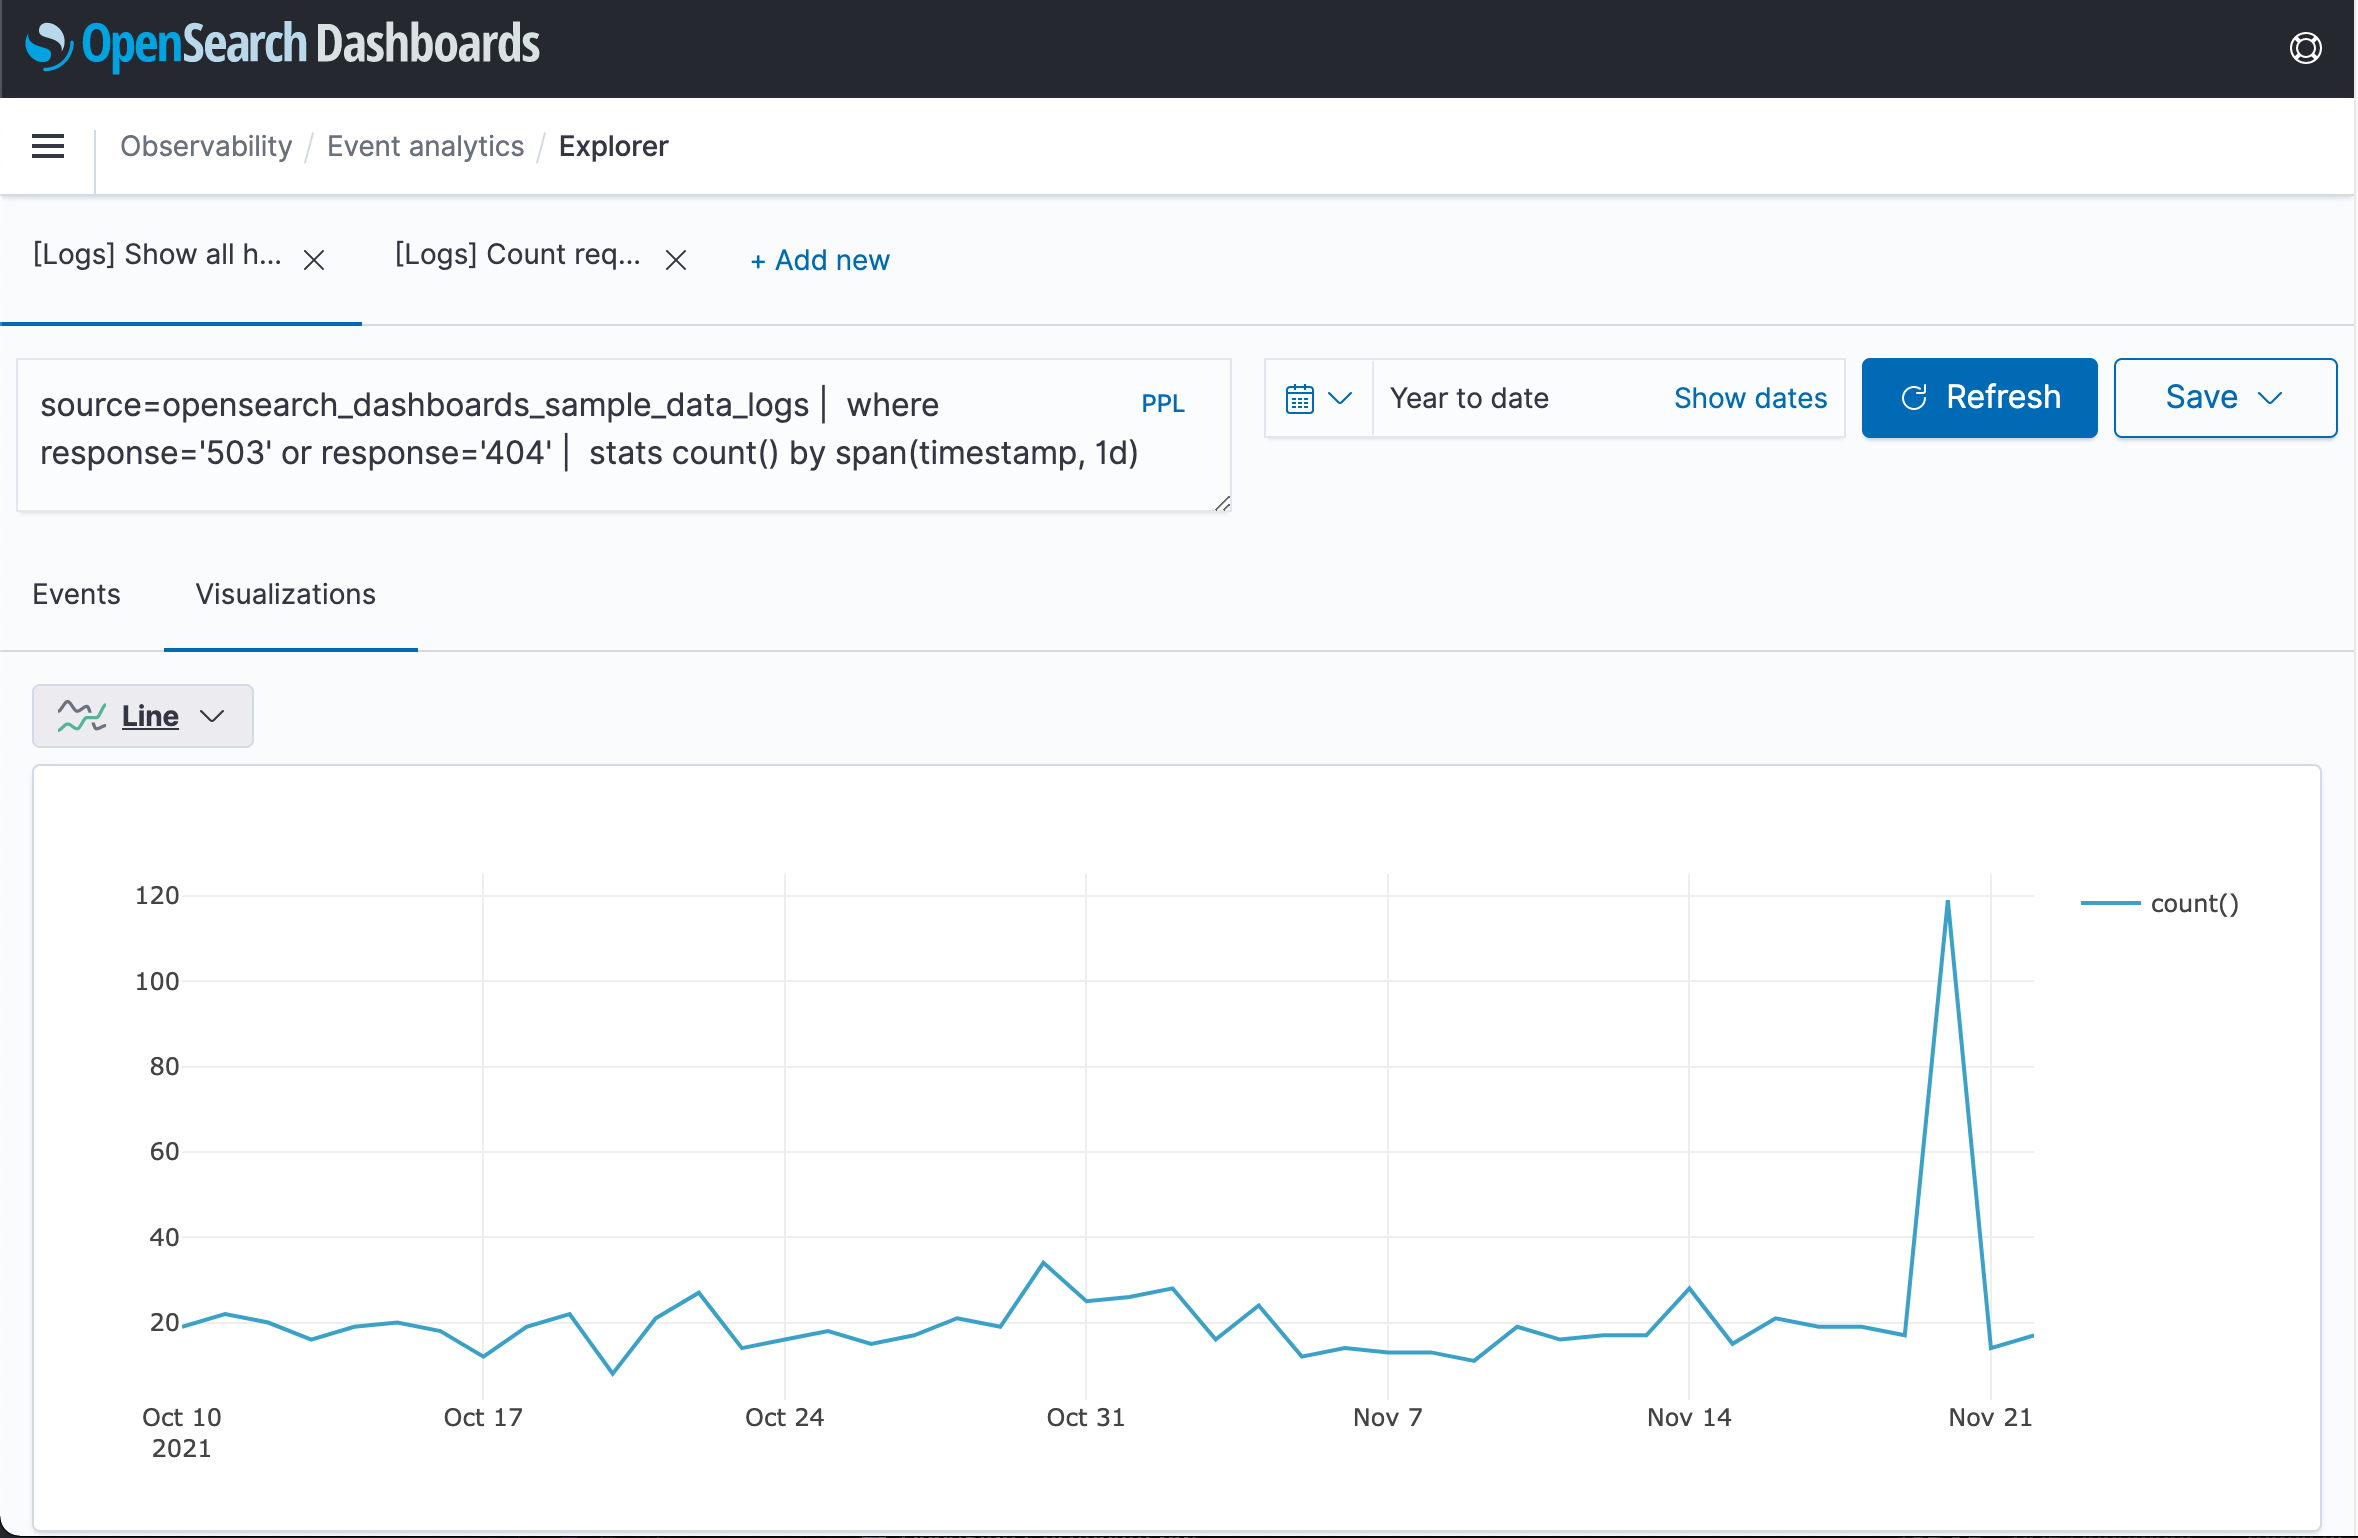
- Use event analytics to turn data-driven events into visualizations.
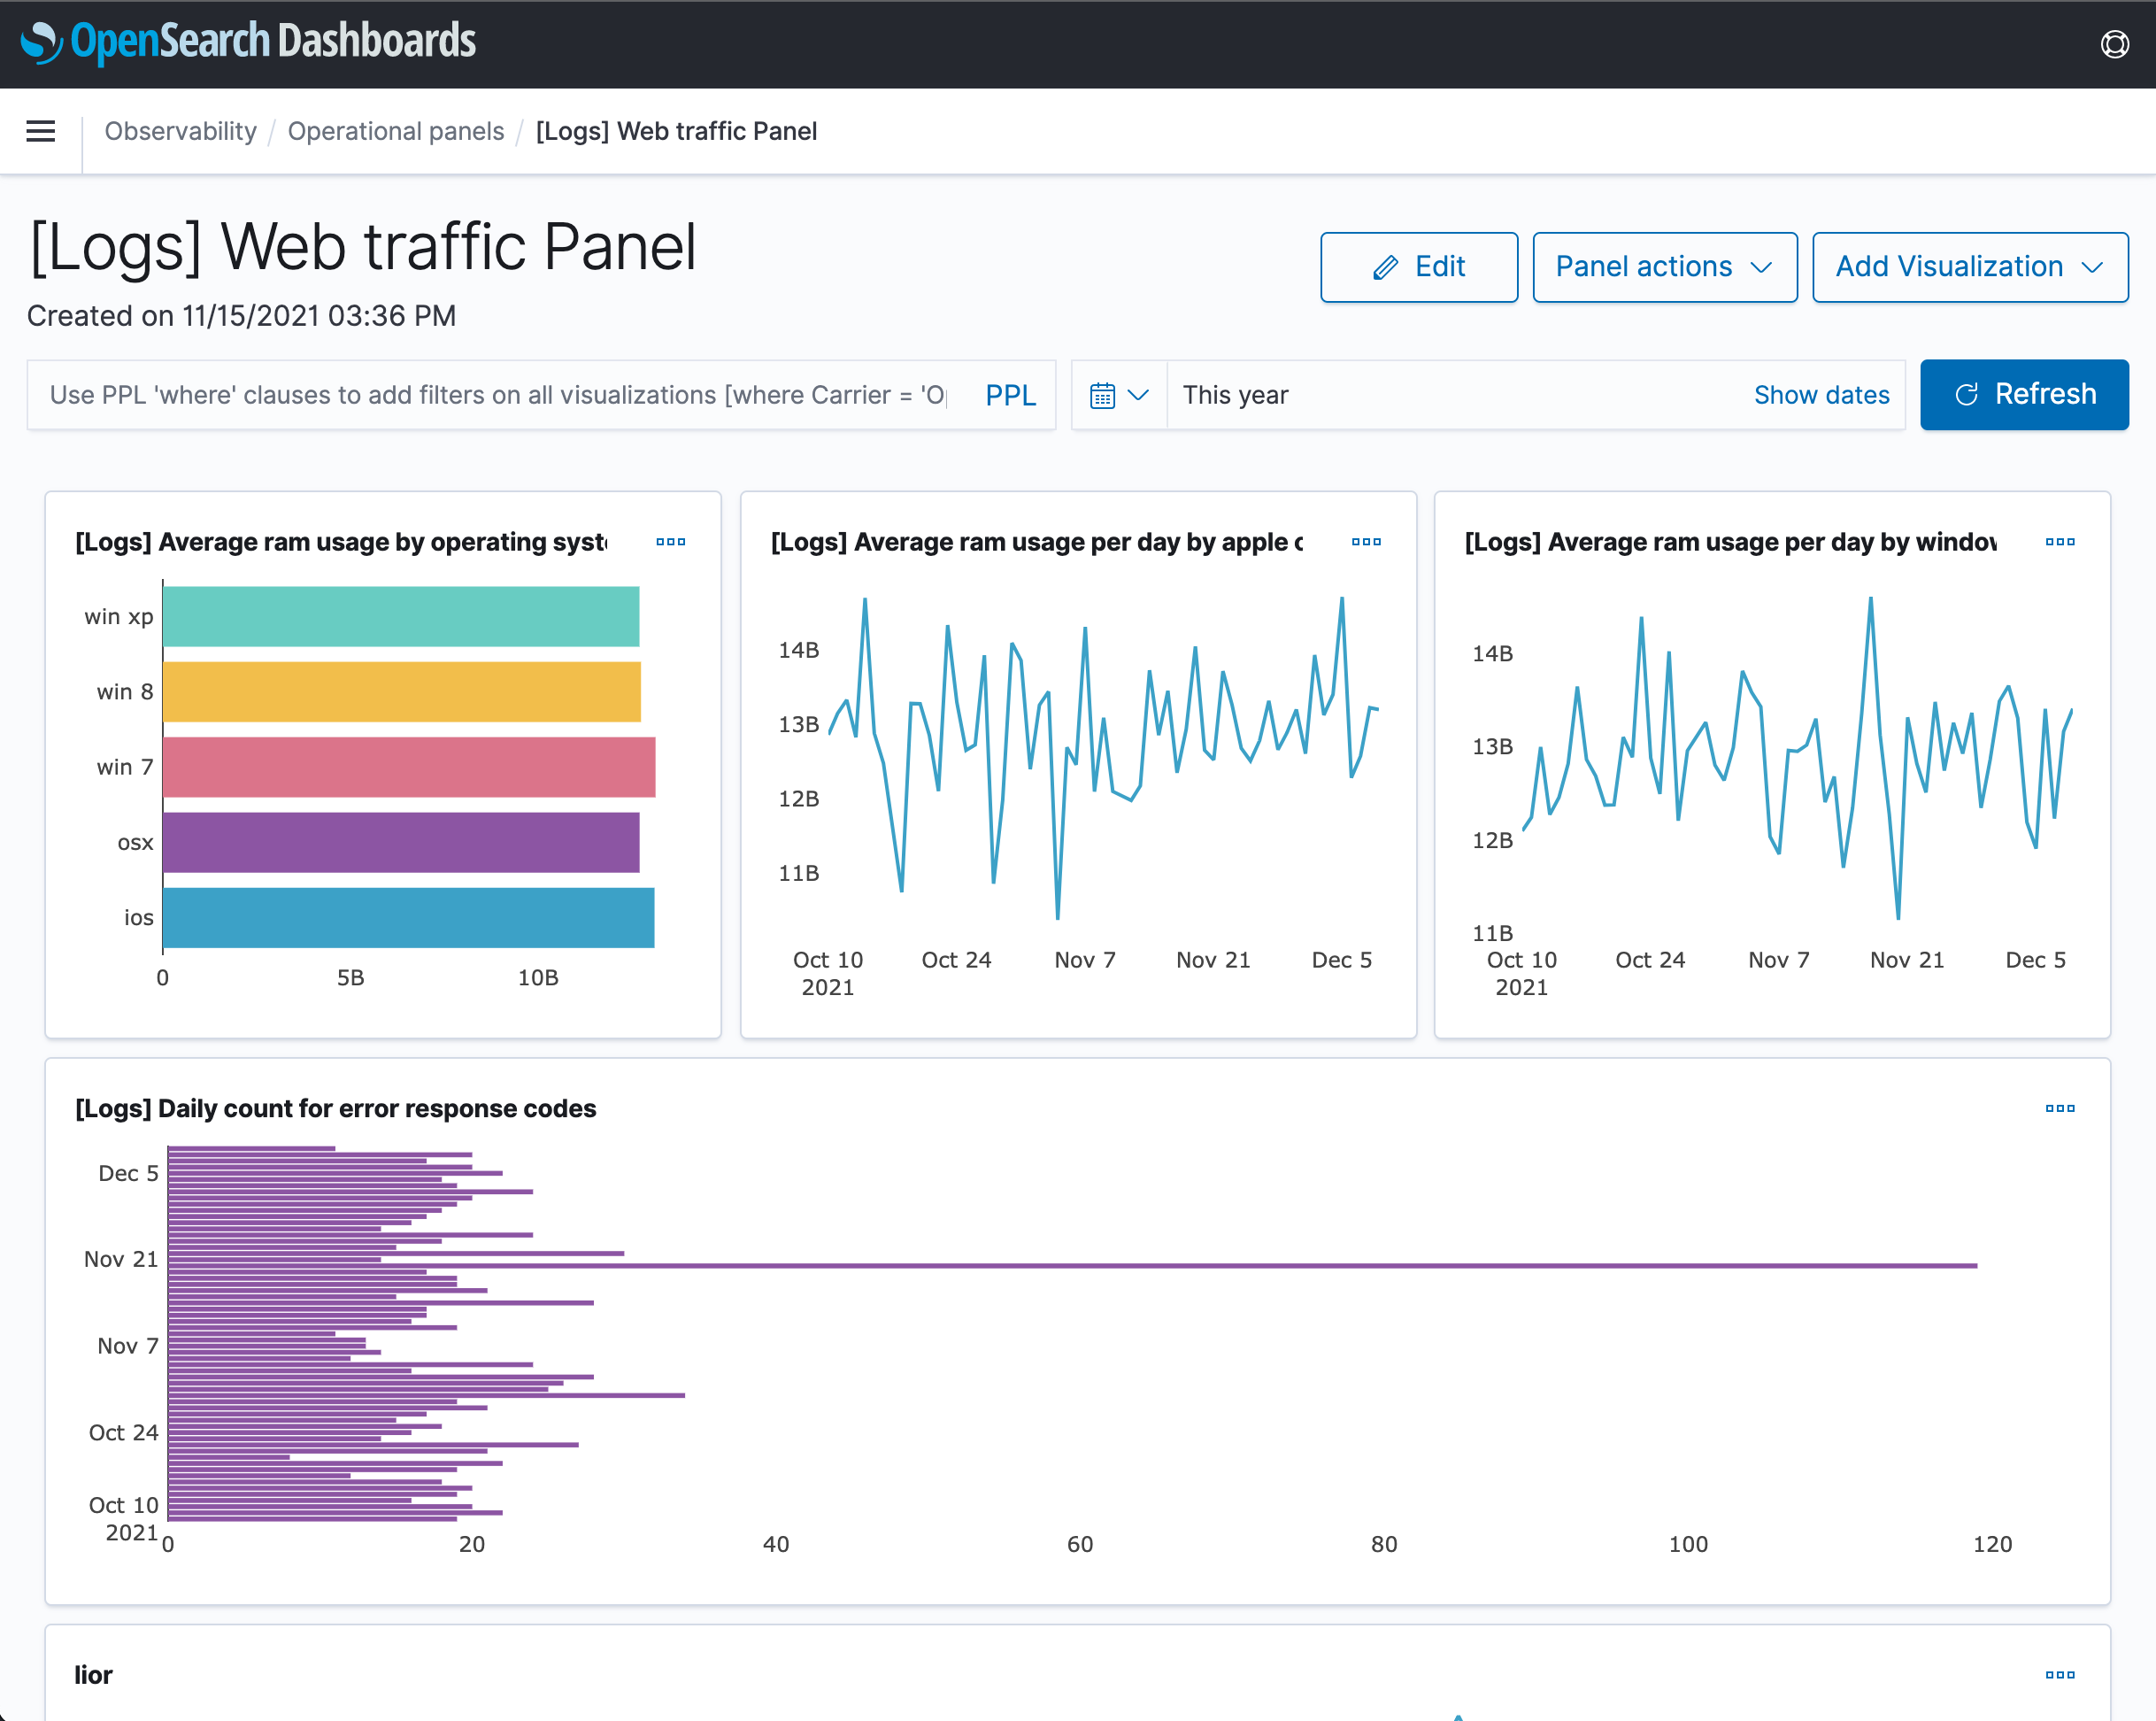
- Create operational panels and add visualizations to compare data the way you like.
- Use log analytics to transform unstructured log data.
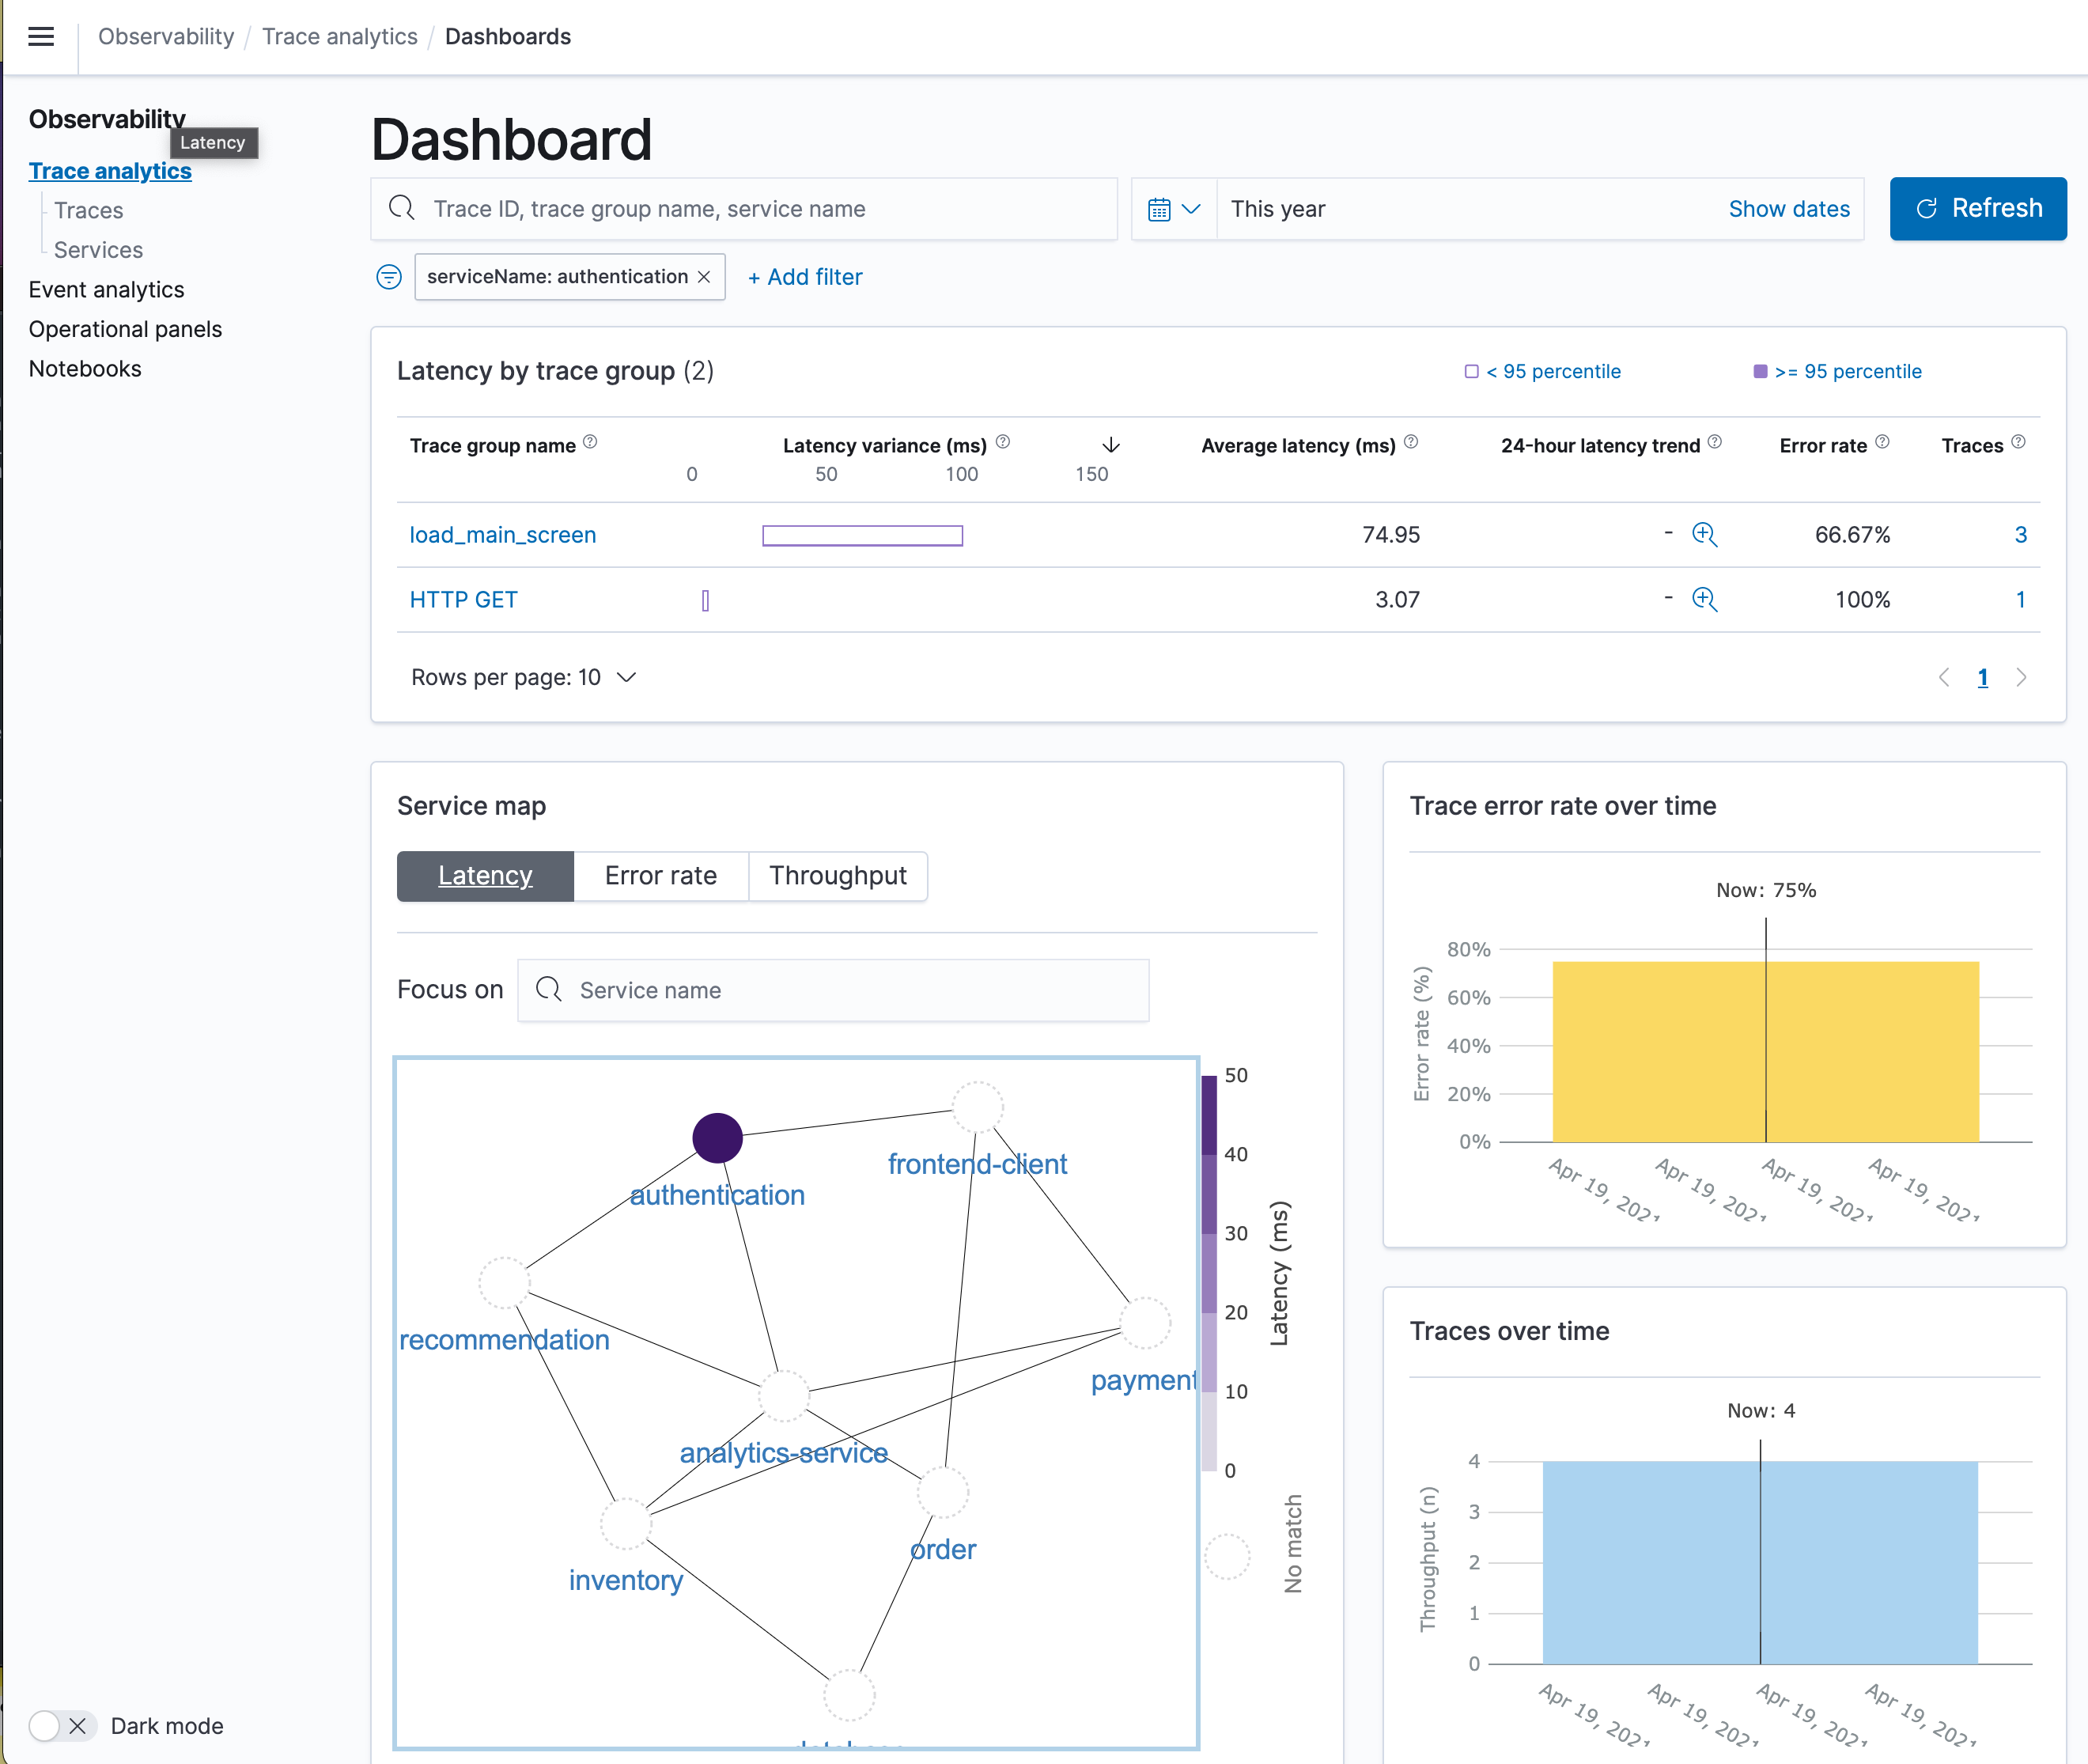
- Use trace analytics to create traces and dive deep into your data.
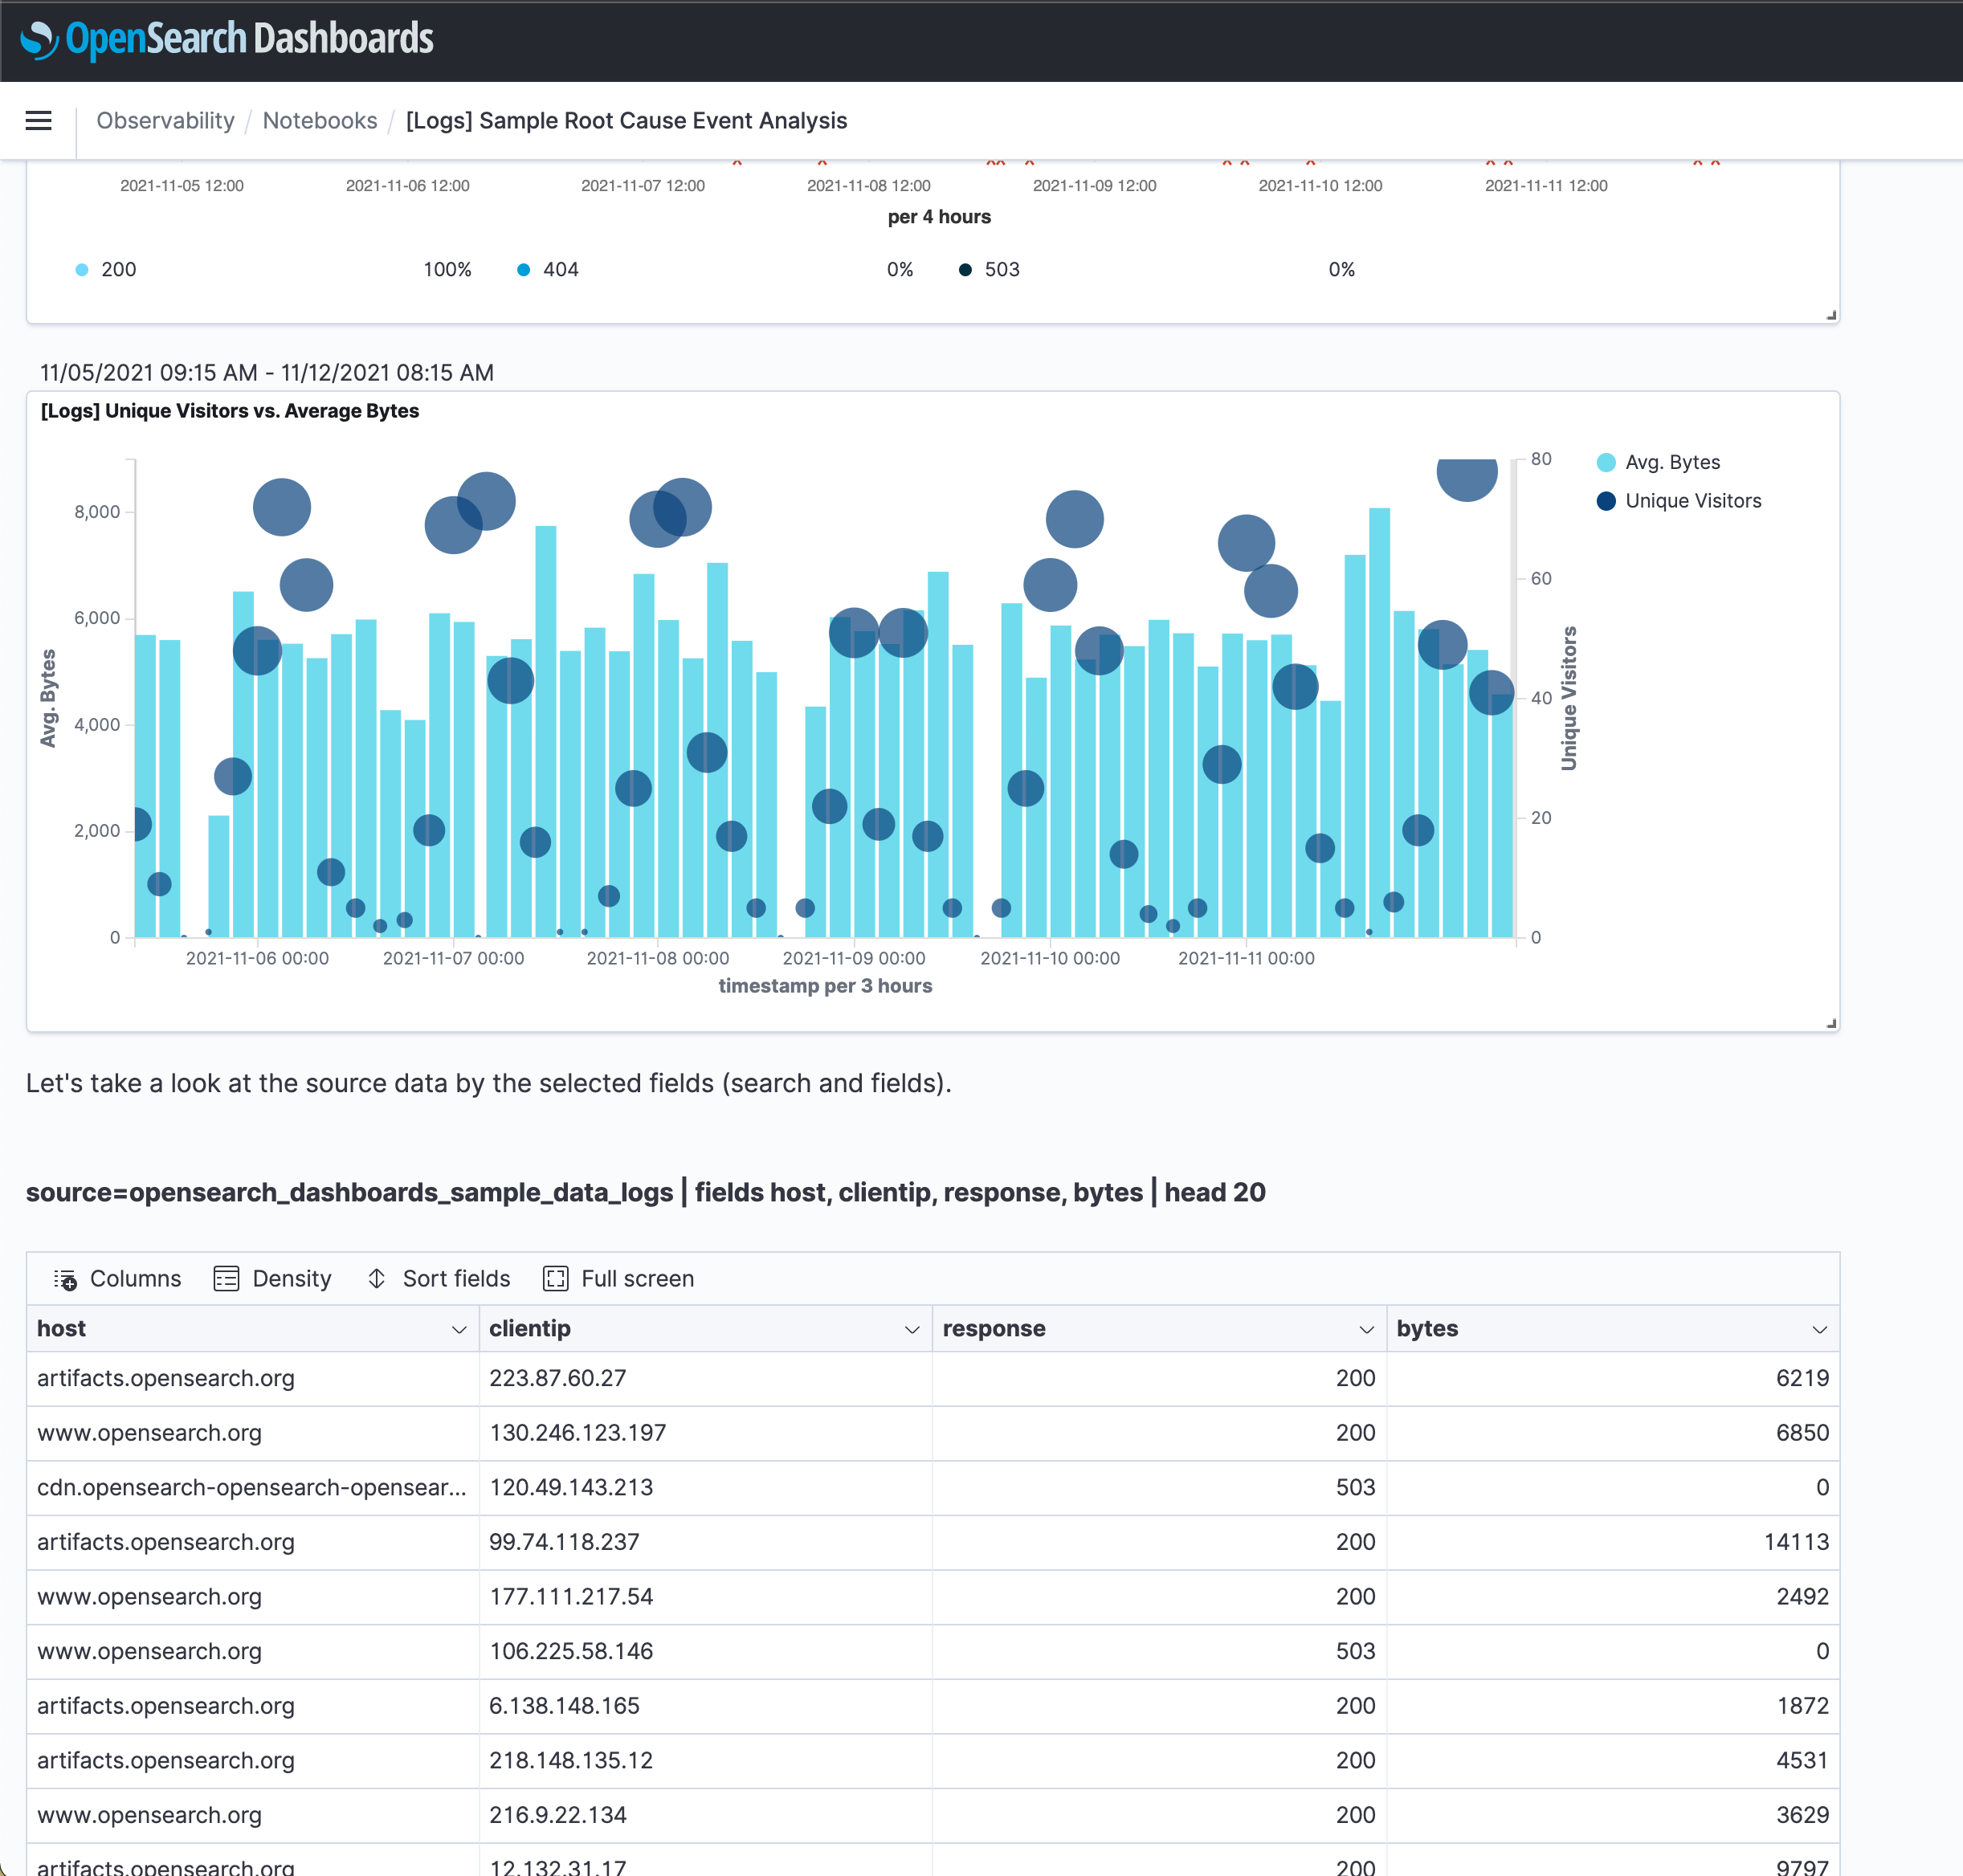
- Leverage notebooks to combine different visualizations and code blocks that you can share with team members.